# Gantt: Analytics

Bring greater context to your Gantt charts with reference lines marking important milestones: the current date, project start and end dates, and custom ranges such as sprint cycles. Click the **Analytics** button in the Story section of the header, then click the **Add new reference** button.&#x20;

<figure><img src="/files/pknCUSzOV8sYrs5yPvey" alt=""><figcaption><p>Analytics for Gantt charts</p></figcaption></figure>

Let's look at how to configure reference lines and bands.

#### 1. Name

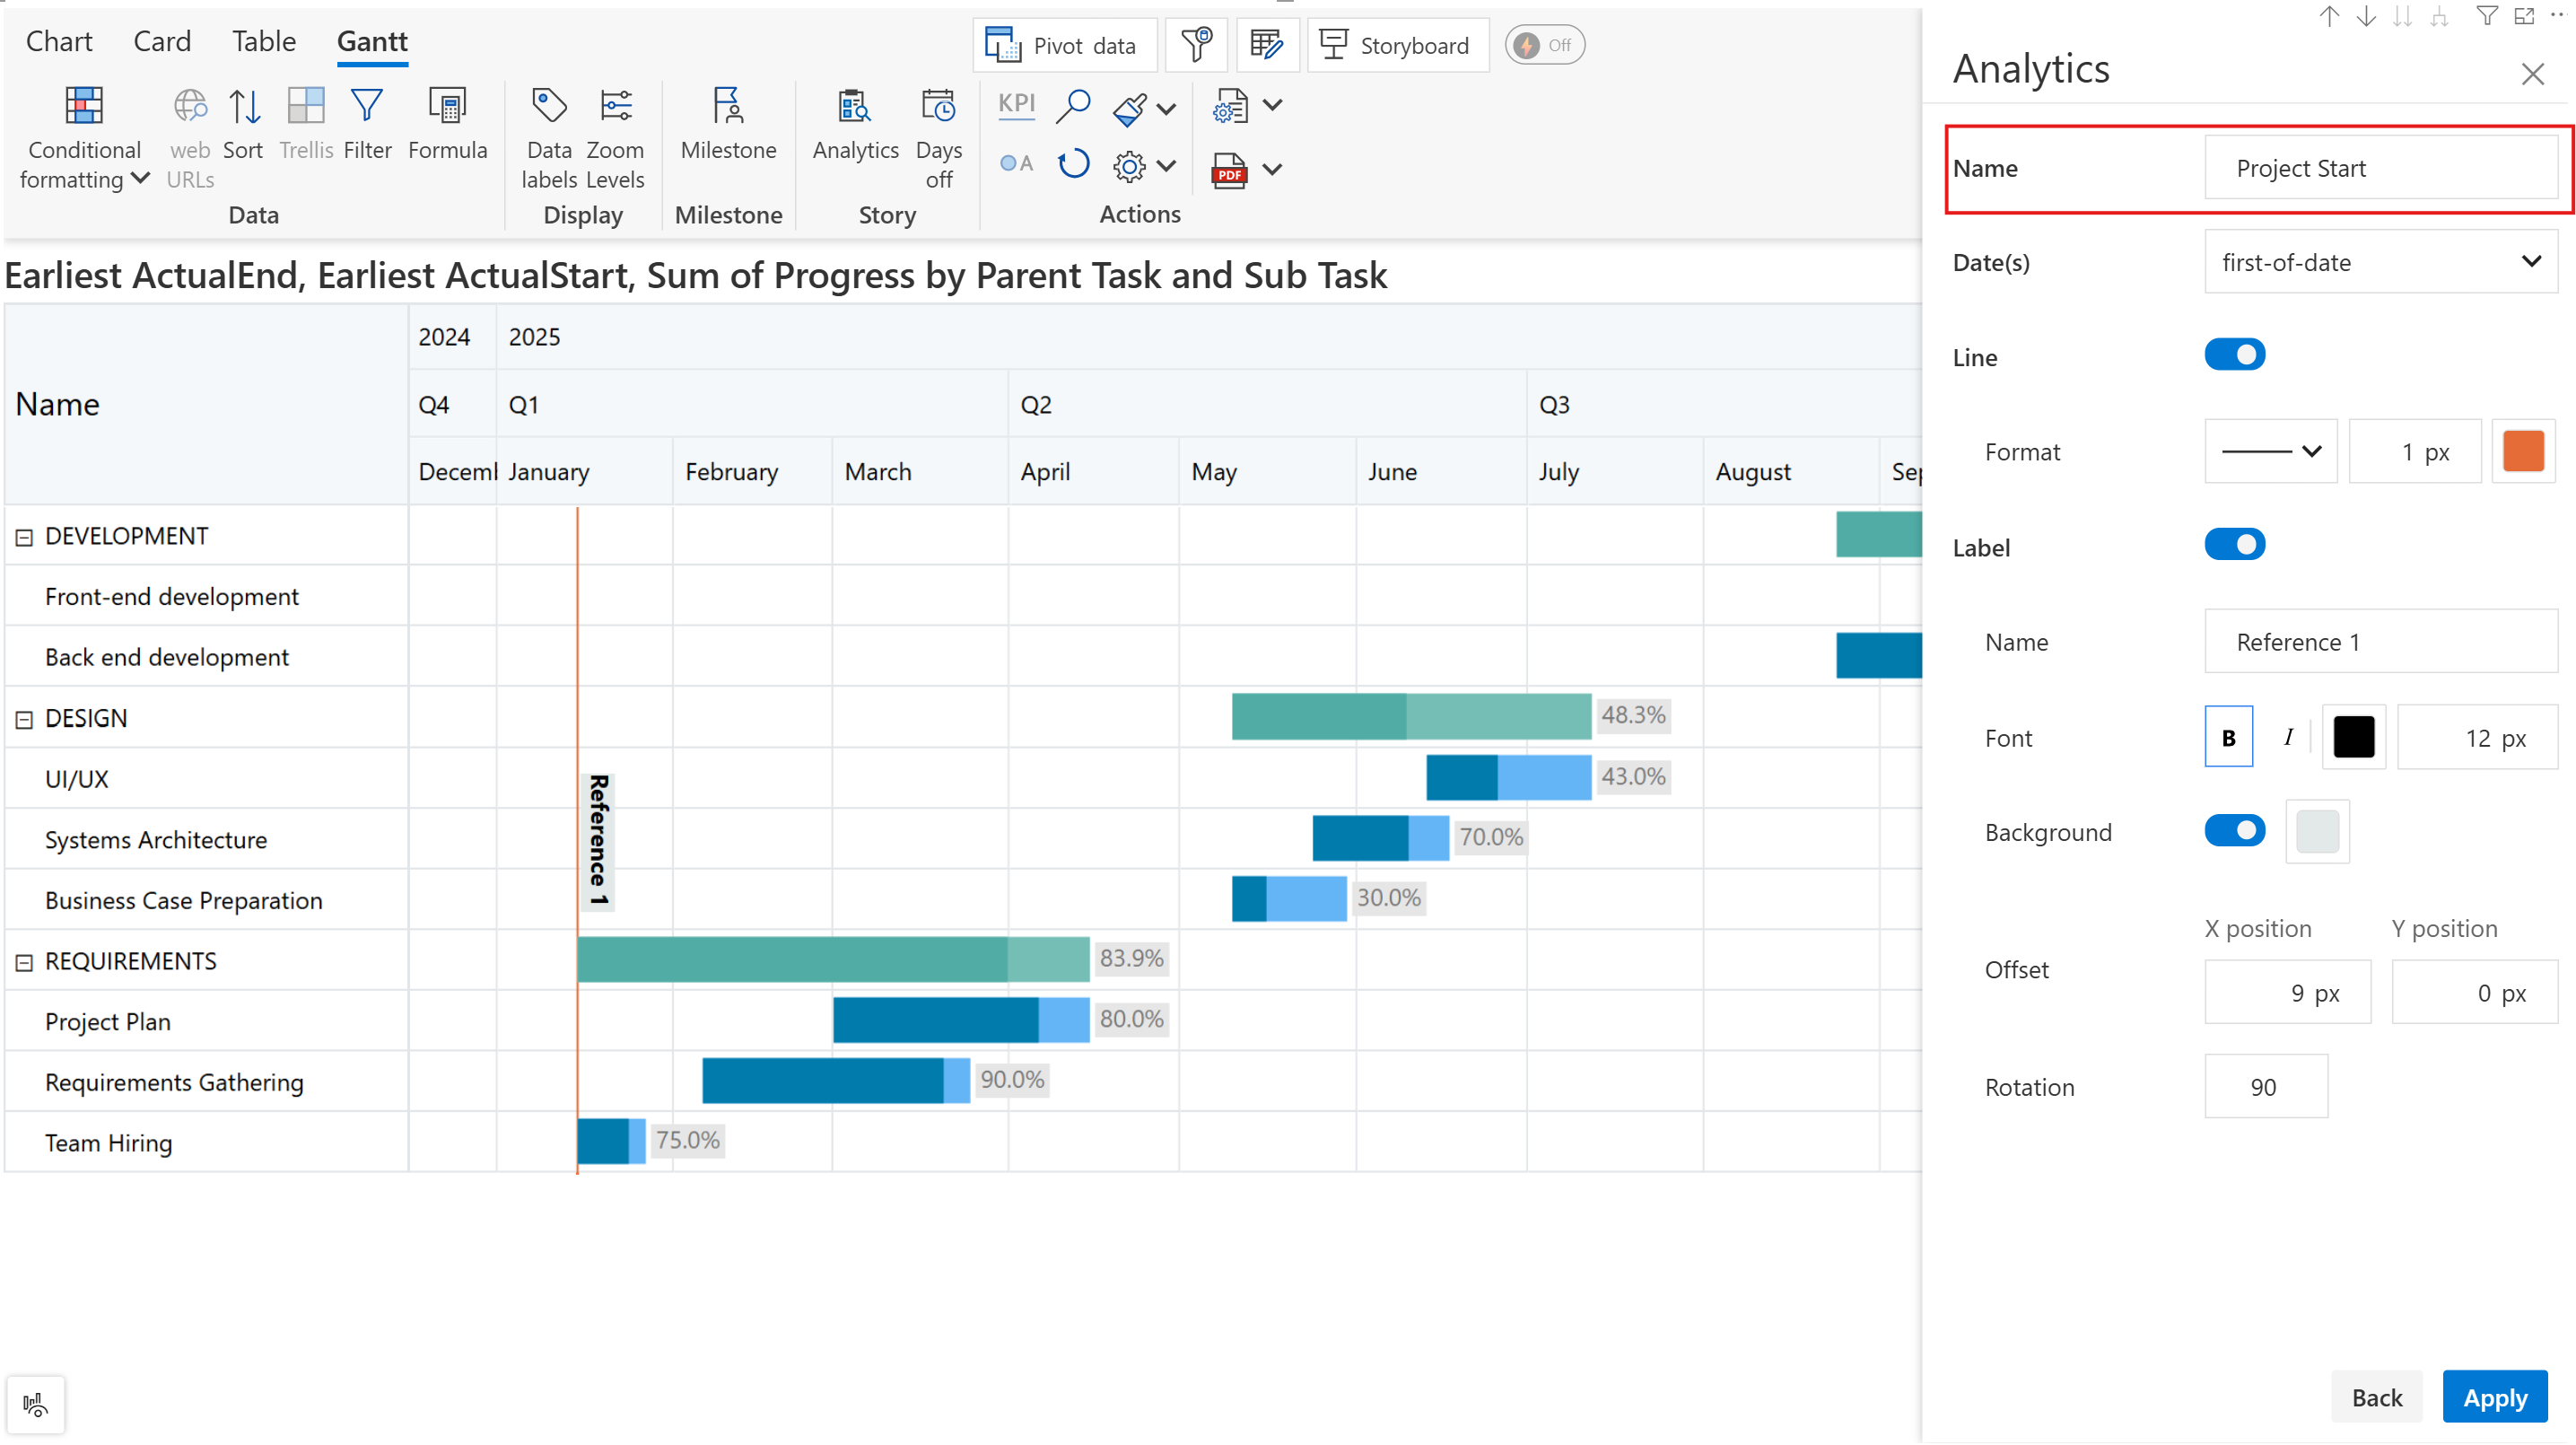
Add a custom name to identify the reference line/band. You will need to use this name to identify specific analytical components in the side pane to edit them.

In this example, we've changed the default name to 'Project Start'.

<figure><img src="/files/d3spIrauR3IDmlzewJnI" alt=""><figcaption><p>Name option</p></figcaption></figure>

#### 2. Date(s)

Analytics+ provides multiple options, like first-of-date, to highlight important events in the project.

<figure><img src="/files/29HFG88EzWjVFnh5LZO3" alt=""><figcaption><p>Reference line and band options</p></figcaption></figure>

* The first-of-date and last-of-date indicate the start date and end date of the project plan.

<figure><img src="/files/Irzrac843DrpSdxIAaKE" alt=""><figcaption><p>first-of and last-of date</p></figcaption></figure>

#### 3. Line

Enable the toggle to render the reference line. Choose between dotted, dashed, and regular lines. Customize the color and thickness.

<figure><img src="/files/tuatM0fATdZ78Vtpt9Xm" alt=""><figcaption><p>Line customization</p></figcaption></figure>

#### 4. Timezone offset

When adding a reference line for the current date across users in different time zones, apply the timezone offset to keep the date consistent for everyone.

<figure><img src="/files/AckqDCM10dGNZQGAn9wi" alt=""><figcaption><p>Timezone offset</p></figcaption></figure>

#### 5. Custom date

Plot a reference line to indicate significant milestones, like design approved, development complete, or go-live. This option is enabled when 'Custom Date' is selected from the Date(s) dropdown.

<figure><img src="/files/5lXMh61E1edcaKEeWV3u" alt=""><figcaption><p>Custom date</p></figcaption></figure>

#### 7. From and To

Plot reference bands to highlight sprint cycles, code freezes, or QA/UAT periods. Select the 'Custom Date Range' option from the Date(s) dropdown. Choose from built-in options like first-of-date, last-of-date, Today, or set custom dates.

In this example, we've used the first-of-date and a custom date to create a date range to display the hiring window.

<figure><img src="/files/qynP1mNOpB1QROT11FKx" alt=""><figcaption><p>Plotting date ranges</p></figcaption></figure>

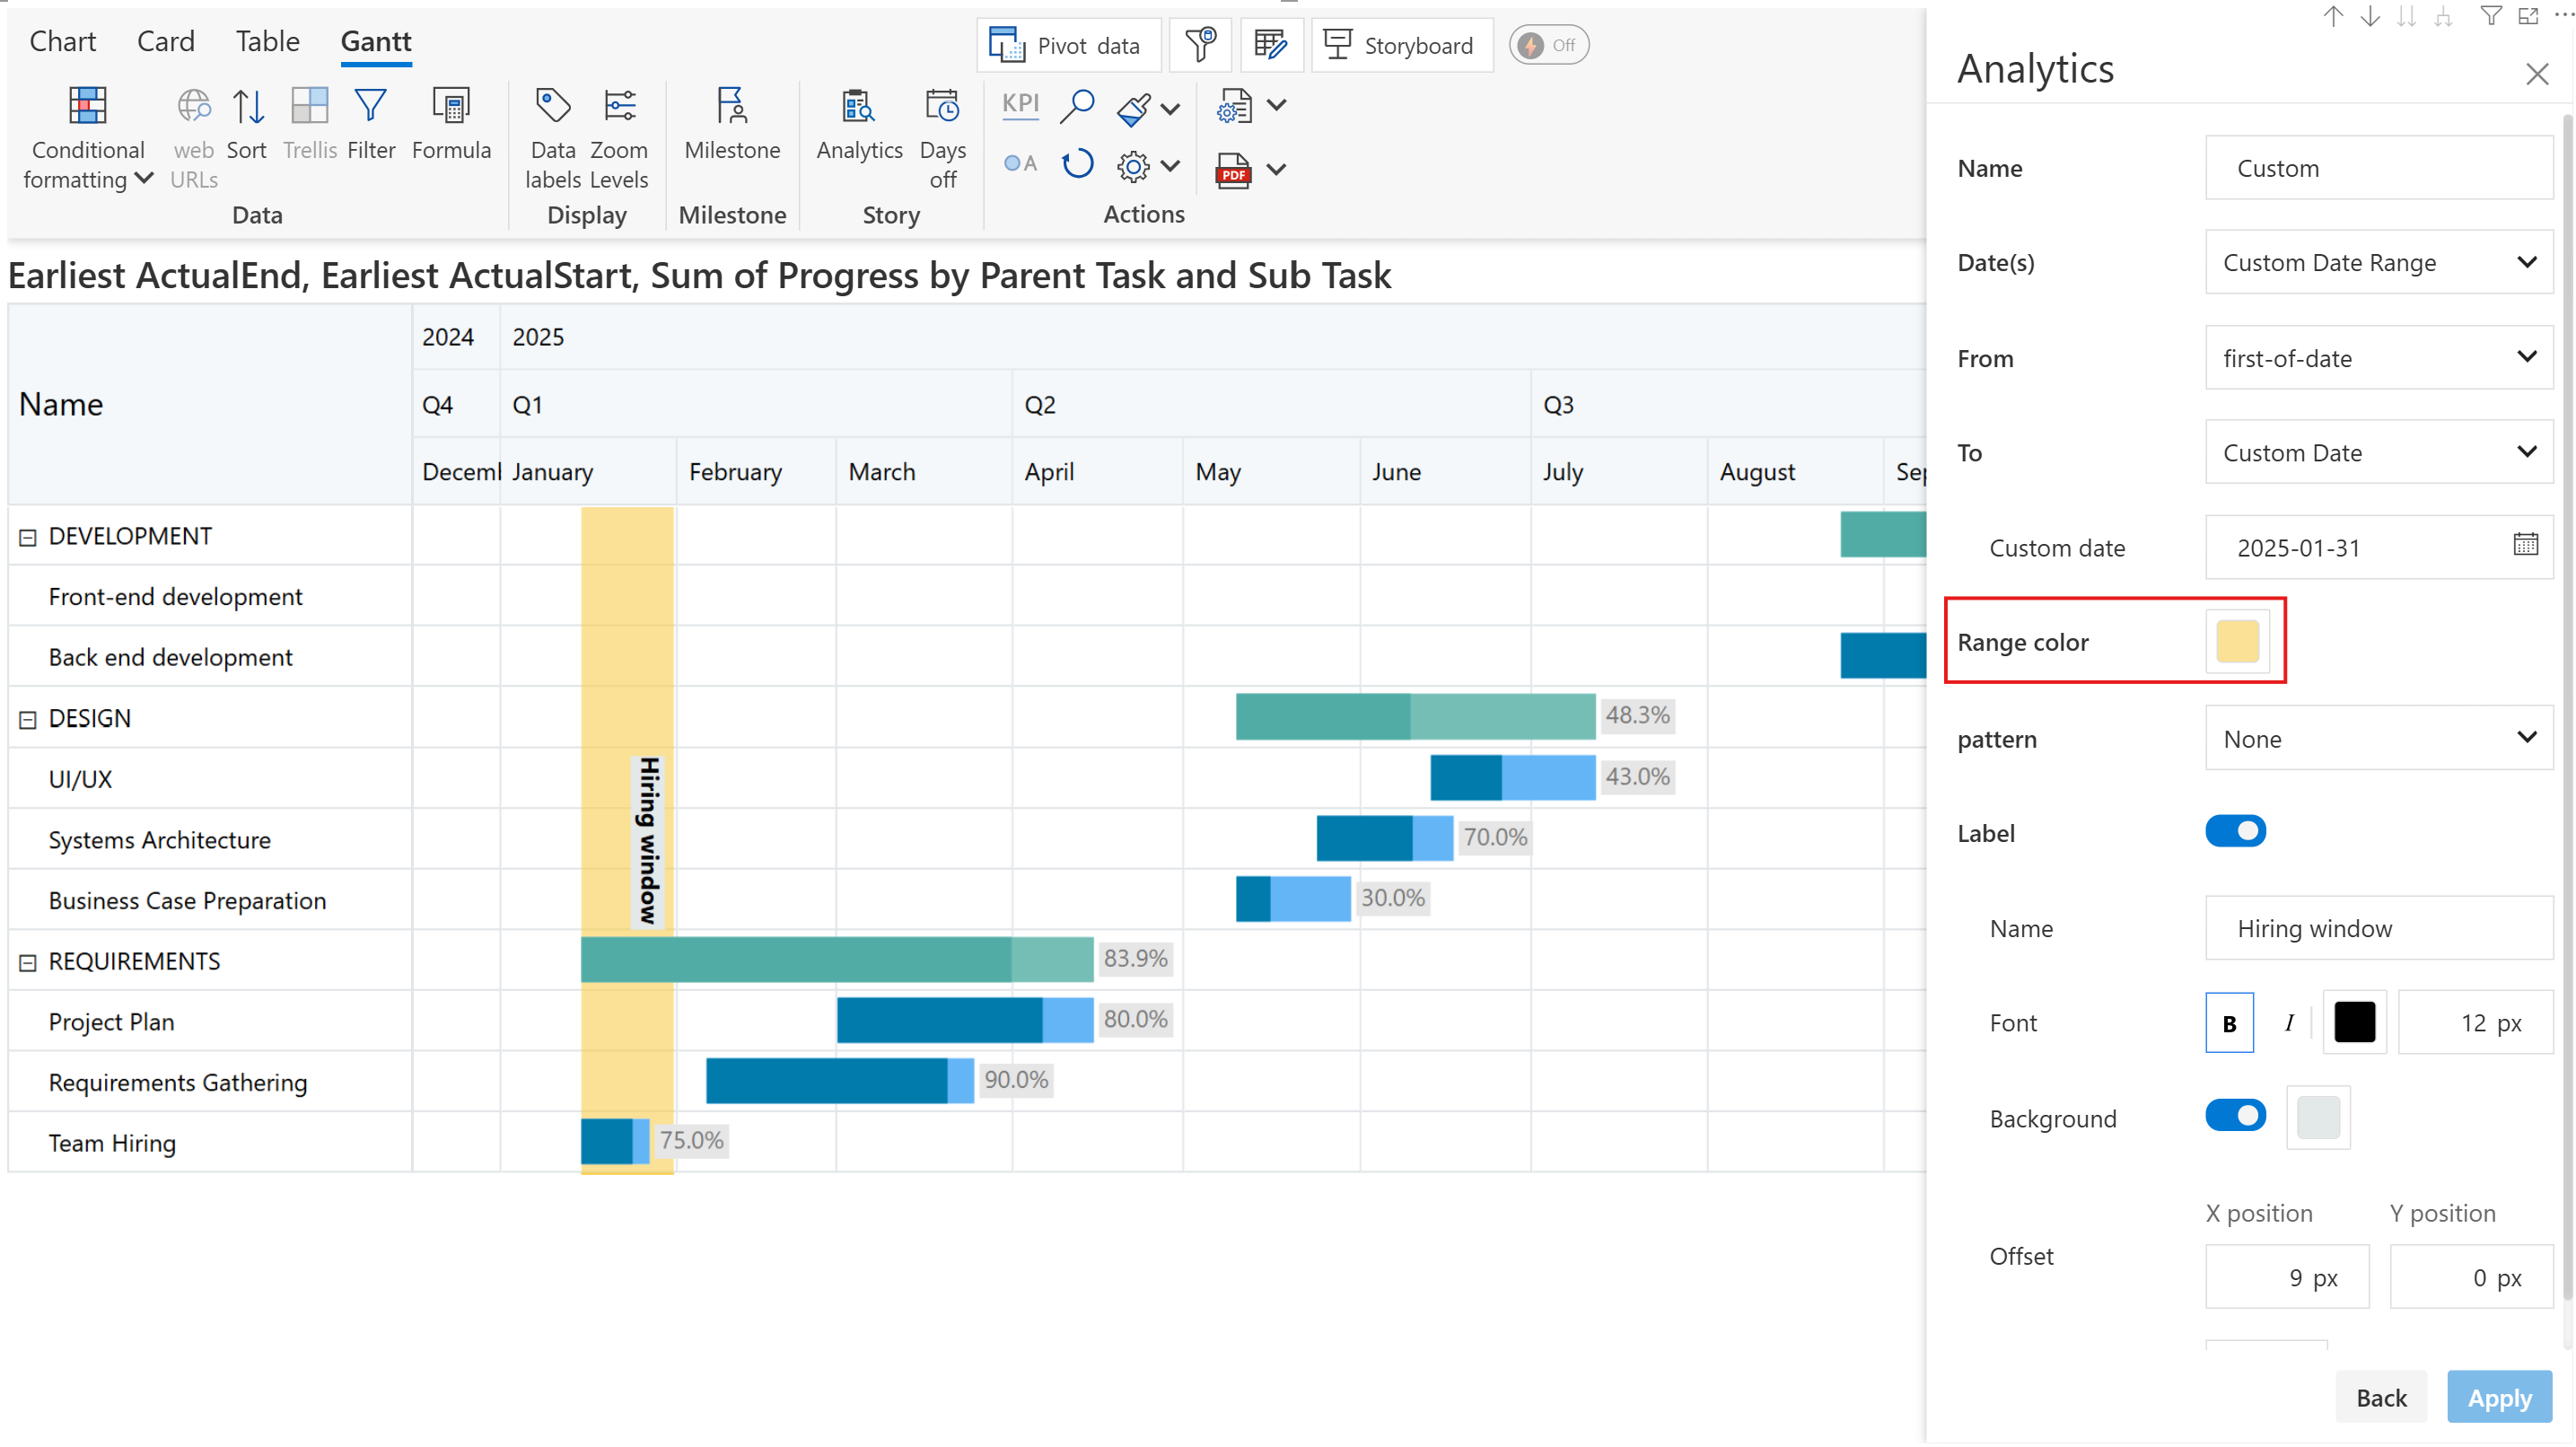
#### 8. Range color

Set a custom color for the reference band.

{% hint style="success" %}
Select 'Custom Date Range' from the Date(s) dropdown to enable this option.
{% endhint %}

<figure><img src="/files/su3MhzjGFVXZ1Rfzb4gM" alt=""><figcaption><p>Date range color</p></figcaption></figure>

#### 9. Pattern

Customize the reference band further by applying a fill pattern.

{% hint style="success" %}
Select 'Custom Date Range' from the Date(s) dropdown to enable this option.
{% endhint %}

<figure><img src="/files/d6cj5AG627vrZTn0nR0o" alt=""><figcaption><p>Fill pattern</p></figcaption></figure>

#### 10. Label

Enable this toggle to display a custom label against the reference line/band.

* Enter the display name in the **Name** textbox.

<figure><img src="/files/G8xvby2mbqUcitzotD0X" alt=""><figcaption><p>Label</p></figcaption></figure>

* Customize the **font** style, size, and color. You can also set a custom background color to highlight the label.

<figure><img src="/files/4aZvvFBu1hcdcaA7xl2W" alt=""><figcaption><p>Font customizations</p></figcaption></figure>

* Set the x and y co-ordinates at which to position the label using the **Offset** option.

<figure><img src="/files/lmVZ37JkB9TYGhOb0i49" alt=""><figcaption><p>Offset option</p></figcaption></figure>

* Rotate the label vertically or horizontally. Set the rotation to 0 to place the label horizontally.

<figure><img src="/files/vQAsaenwo86eJwflnixQ" alt=""><figcaption><p>Label rotation</p></figcaption></figure>


---

# Agent Instructions: Querying This Documentation

If you need additional information that is not directly available in this page, you can query the documentation dynamically by asking a question.

Perform an HTTP GET request on the current page URL with the `ask` query parameter:

```
GET https://docs.inforiver.com/analytics+/gantt-chart/gantt-analytics.md?ask=<question>
```

The question should be specific, self-contained, and written in natural language.
The response will contain a direct answer to the question and relevant excerpts and sources from the documentation.

Use this mechanism when the answer is not explicitly present in the current page, you need clarification or additional context, or you want to retrieve related documentation sections.