> For the complete documentation index, see [llms.txt](https://docs.inforiver.com/llms.txt). Markdown versions of documentation pages are available by appending `.md` to page URLs; this page is available as [Markdown](https://docs.inforiver.com/release-notes/inforiver-reporting-matrix/inforiver-reporting-matrix-october-2025-v3.3.9.md).

# Inforiver Reporting Matrix October 2025 - v3.3.9

Inforiver Reporting Matrix is now more enhanced with add-on features in the Reading view and exports, allowing you to tailor your reports exactly needed.

## 1. Expand/Collapse Option in Outline and Stepped Layout Exports

You can now export an Excel report with the Expand/collapse option in both Outline and Stepped Layouts.

<figure><img src="/files/293ZgwRuARKZwSSUQUgZ" alt=""><figcaption><p>Exporting an Excel with the Expand/Collapse option in Outline Layout</p></figcaption></figure>

The image below shows the exported Excel file in the Outline Layout

<figure><img src="/files/LhV0FarROoUckywV0ExP" alt=""><figcaption><p>Exported Excel File with Expand/Collapse option in the outline layout</p></figcaption></figure>

<figure><img src="/files/80Ug4vsgrU6TgnBoKcOT" alt=""><figcaption><p>Excel exported with  Expand/Collapse option in the stepped layout</p></figcaption></figure>

## 2. Grouping Columns

You can now group columns of your choice and manage them together in the reporting matrix by clicking on the Model view icon under manage columns.

<figure><img src="/files/I7qhtog0b8gF2sPrFMeh" alt=""><figcaption><p>Grouping under Manage Columns using the Model view icon.</p></figcaption></figure>

In the Model view pop-up, click on the Add Group options.

<figure><img src="/files/ulFWRDK73Q1vVkVBEQu9" alt=""><figcaption><p>Add group option in Model View</p></figcaption></figure>

In the Add View pop-up, enter the Group name and select the measures to be grouped, and click Save.

<figure><img src="/files/ck0riUXVZ2ax22IOwhHs" alt=""><figcaption><p>Naming and Grouping of Measures in Add View.</p></figcaption></figure>

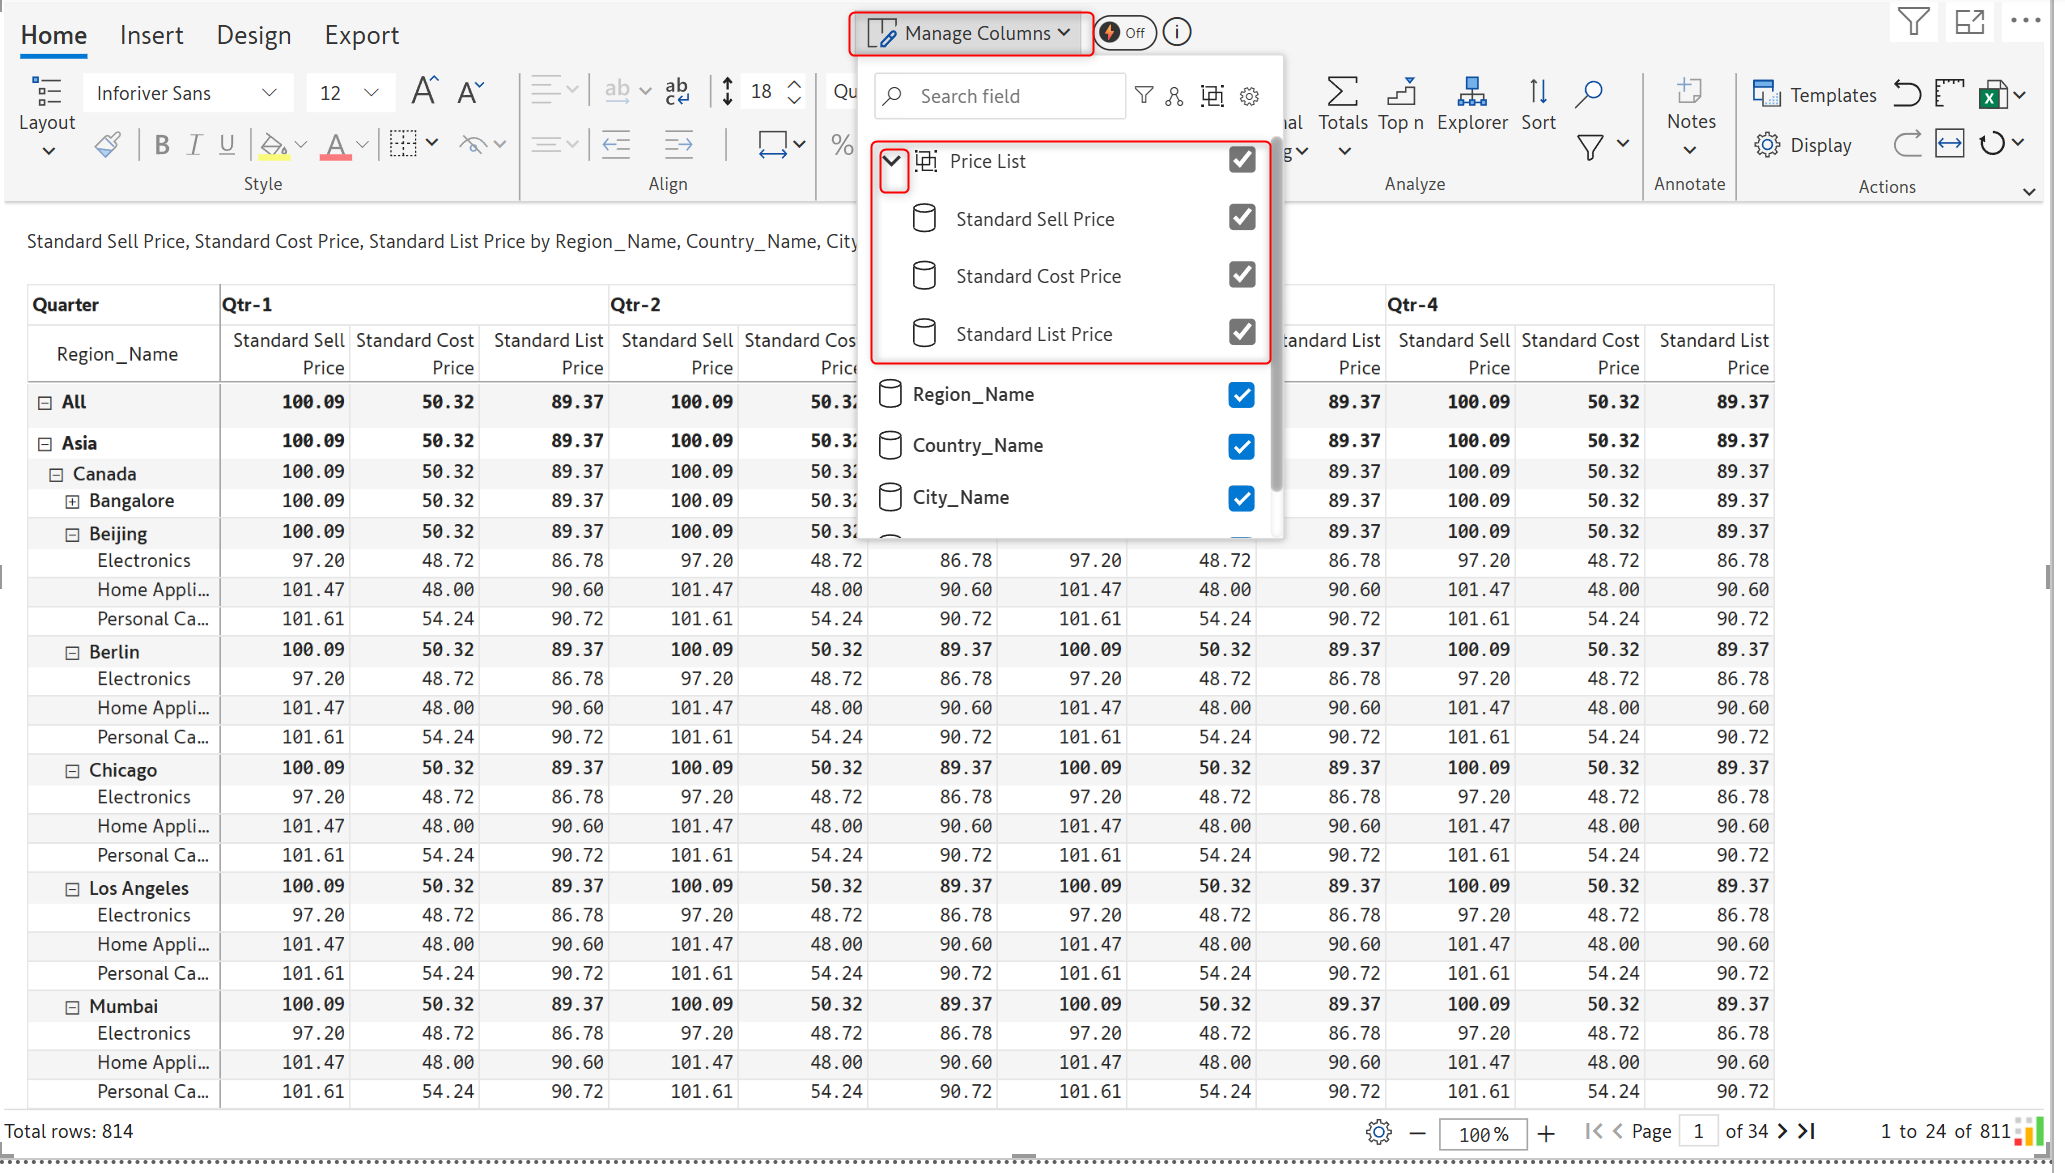
You can now see the Columns being grouped under the group name under Manage columns.Expand the group name to view the measures within.

In the image below, the Price list is the group that contains the measures Standard Sell.Cost and List Price.

<figure><img src="/files/b68nC3UqhpolduhsgyaL" alt=""><figcaption><p>Grouped Columns </p></figcaption></figure>

## 3. Supressing Rows with Zero

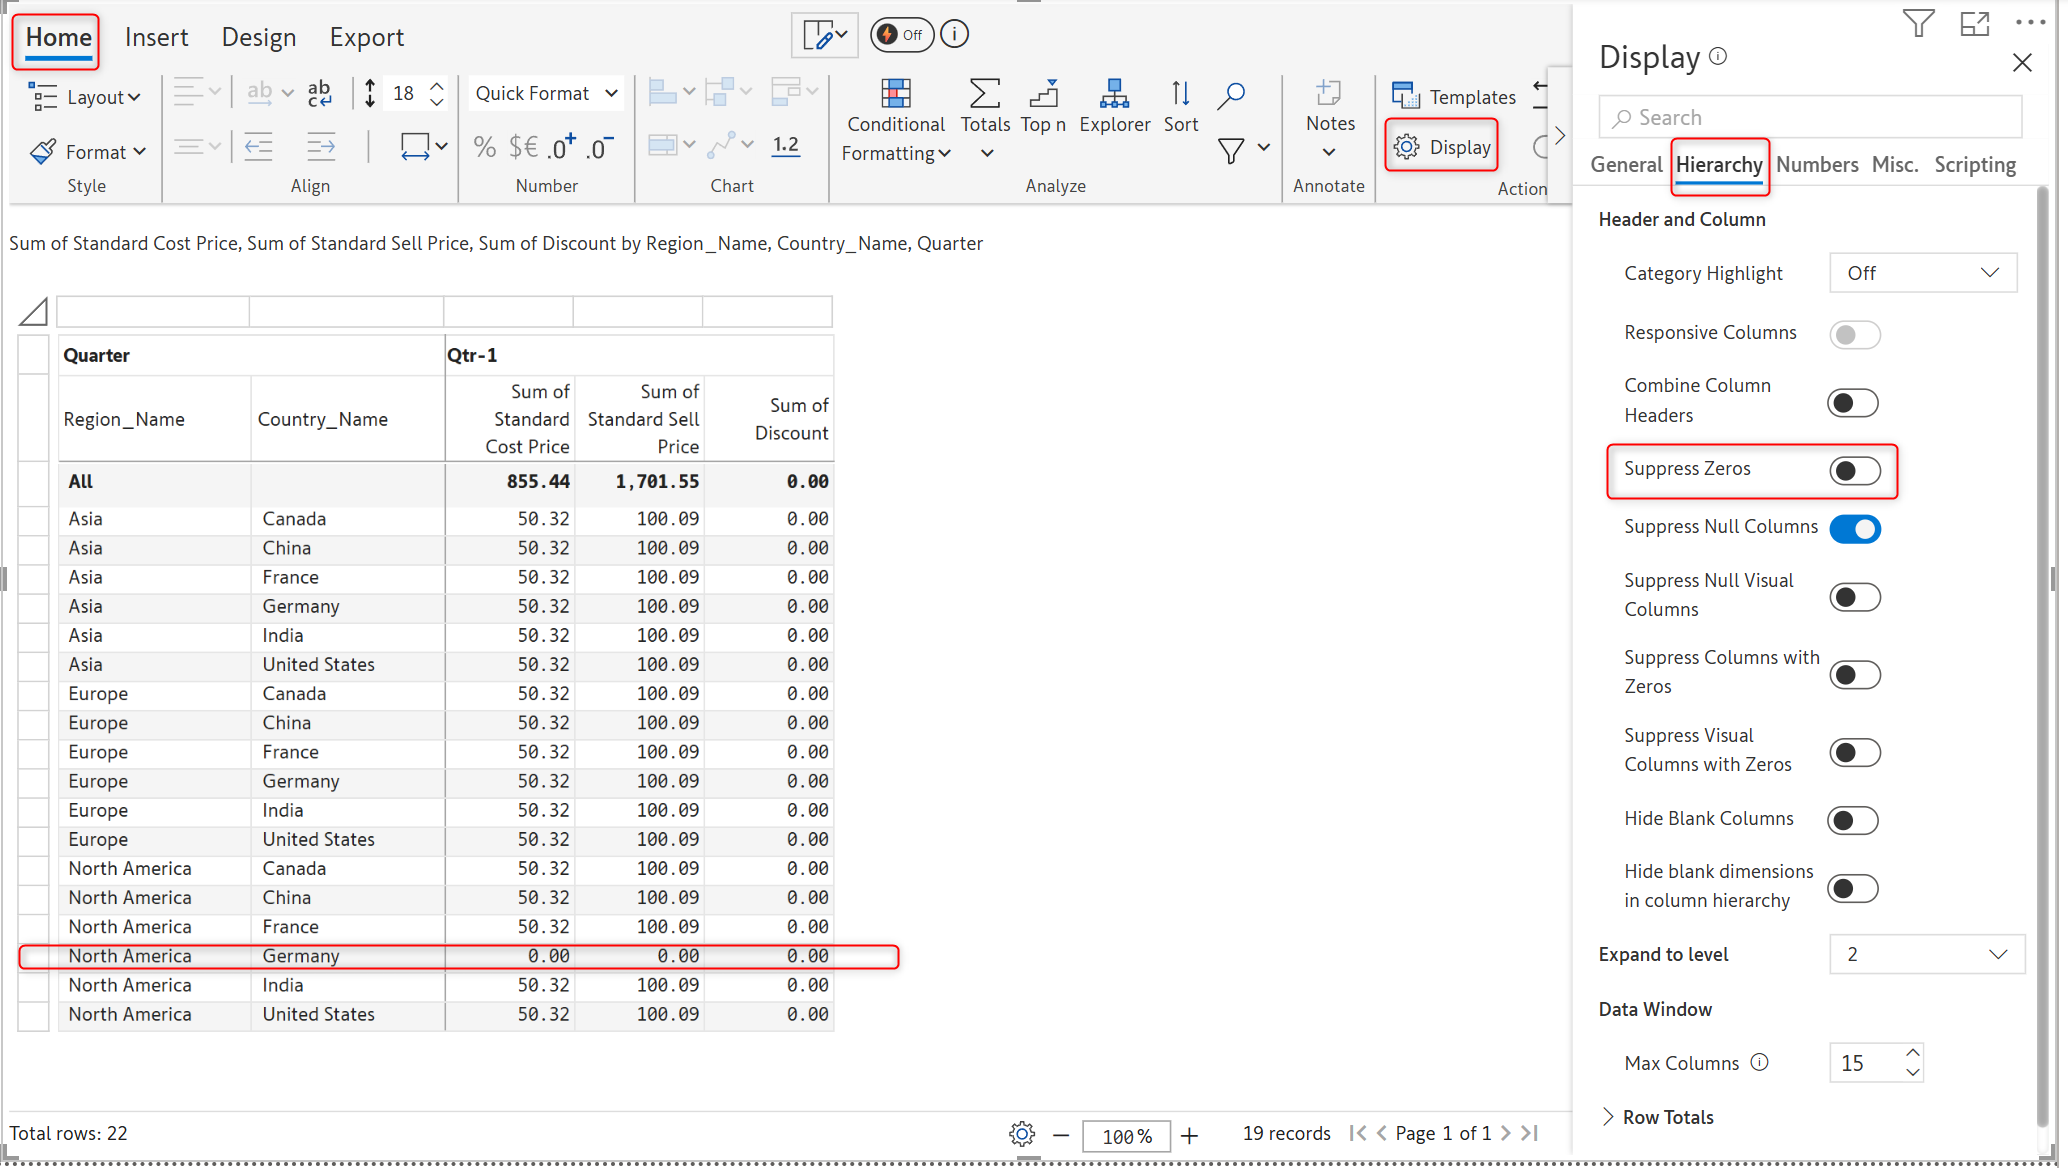
You can now suppress rows with zeros in the table layout as well. Suppression is done only when all the columns in a row have zeroes.

To do this, go to Home > Display > Hierarchy. Enable the Suppress Zeros toggle to suppress the rows with zeros.

<figure><img src="/files/xLy4PIjI2eJJesMvu75N" alt=""><figcaption><p>Suppress Zeros toggle is disabled</p></figcaption></figure>

<figure><img src="/files/YJXXcUYkVVlFHMY3mCzP" alt=""><figcaption><p>Suppress Zeros toggle is enabled</p></figcaption></figure>

## 4. Suppressing Columns with Zeros

You can now suppress both native measures and visual columns with zeros.

In the image below, the Sum of Discount is a native column with zero values and Loss is visual column with values as zero, which are visible as the Supress Column with Zeros and Suppress Visual Columns with zeros toggle are disabled.

<figure><img src="/files/CEeKCWHKHJTmpc37i29A" alt=""><figcaption><p>Suppress columns with zeros and suppress visual column with zeros toggle are disabled.</p></figcaption></figure>

In the image below, the native measure Discount Column is suppressed

<figure><img src="/files/1EGMxhp2cgi0FmbwKXTQ" alt=""><figcaption><p>Suppress columns with zeros is enabled</p></figcaption></figure>

In the image below, the visual column Loss is suppressed.

<figure><img src="/files/3HrJOITaqOWZ2EwJWciU" alt=""><figcaption><p>Suppress visual column with zeros toggle is enabled.</p></figcaption></figure>

## 5. Read View Enhancements – Insert Rows & Columns and Extended Formatting Capabilities

You can now give access to report users to insert and format the rows, columns and cells in reading view.

Enable the Insert and Conditional Formatting Toggle in the Allowed User Controls.

<figure><img src="/files/ZvOfKTtvnEpem468p5lD" alt=""><figcaption><p>Enabling the access toggles.</p></figcaption></figure>

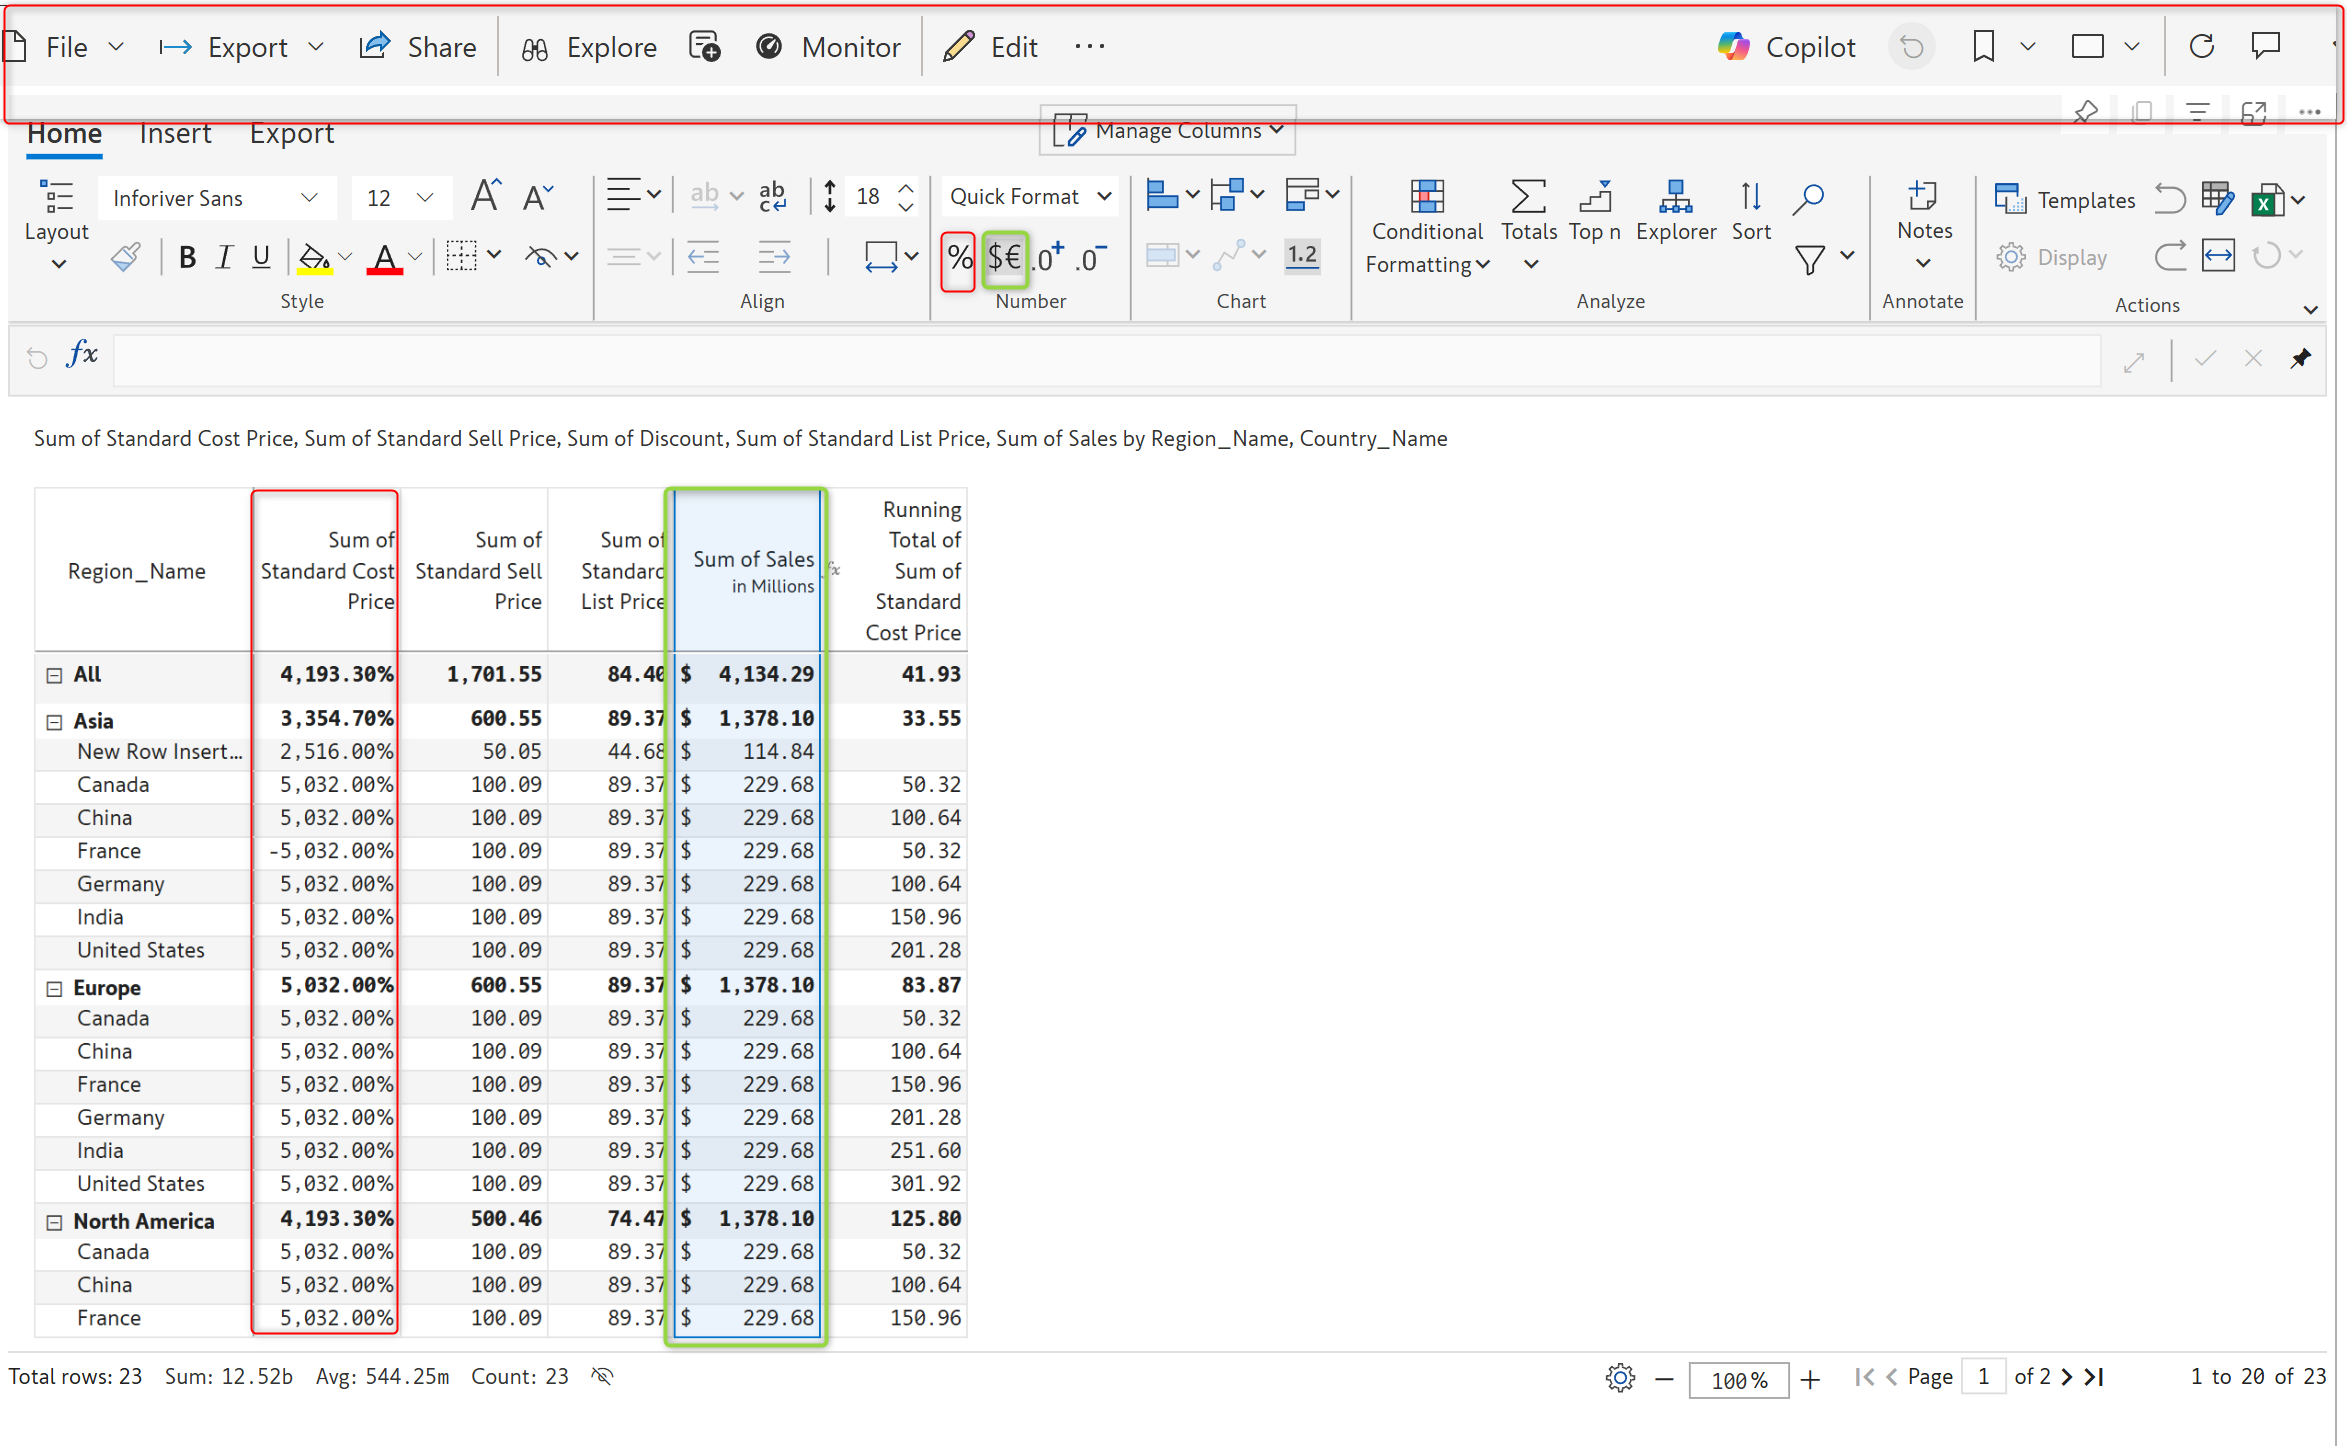
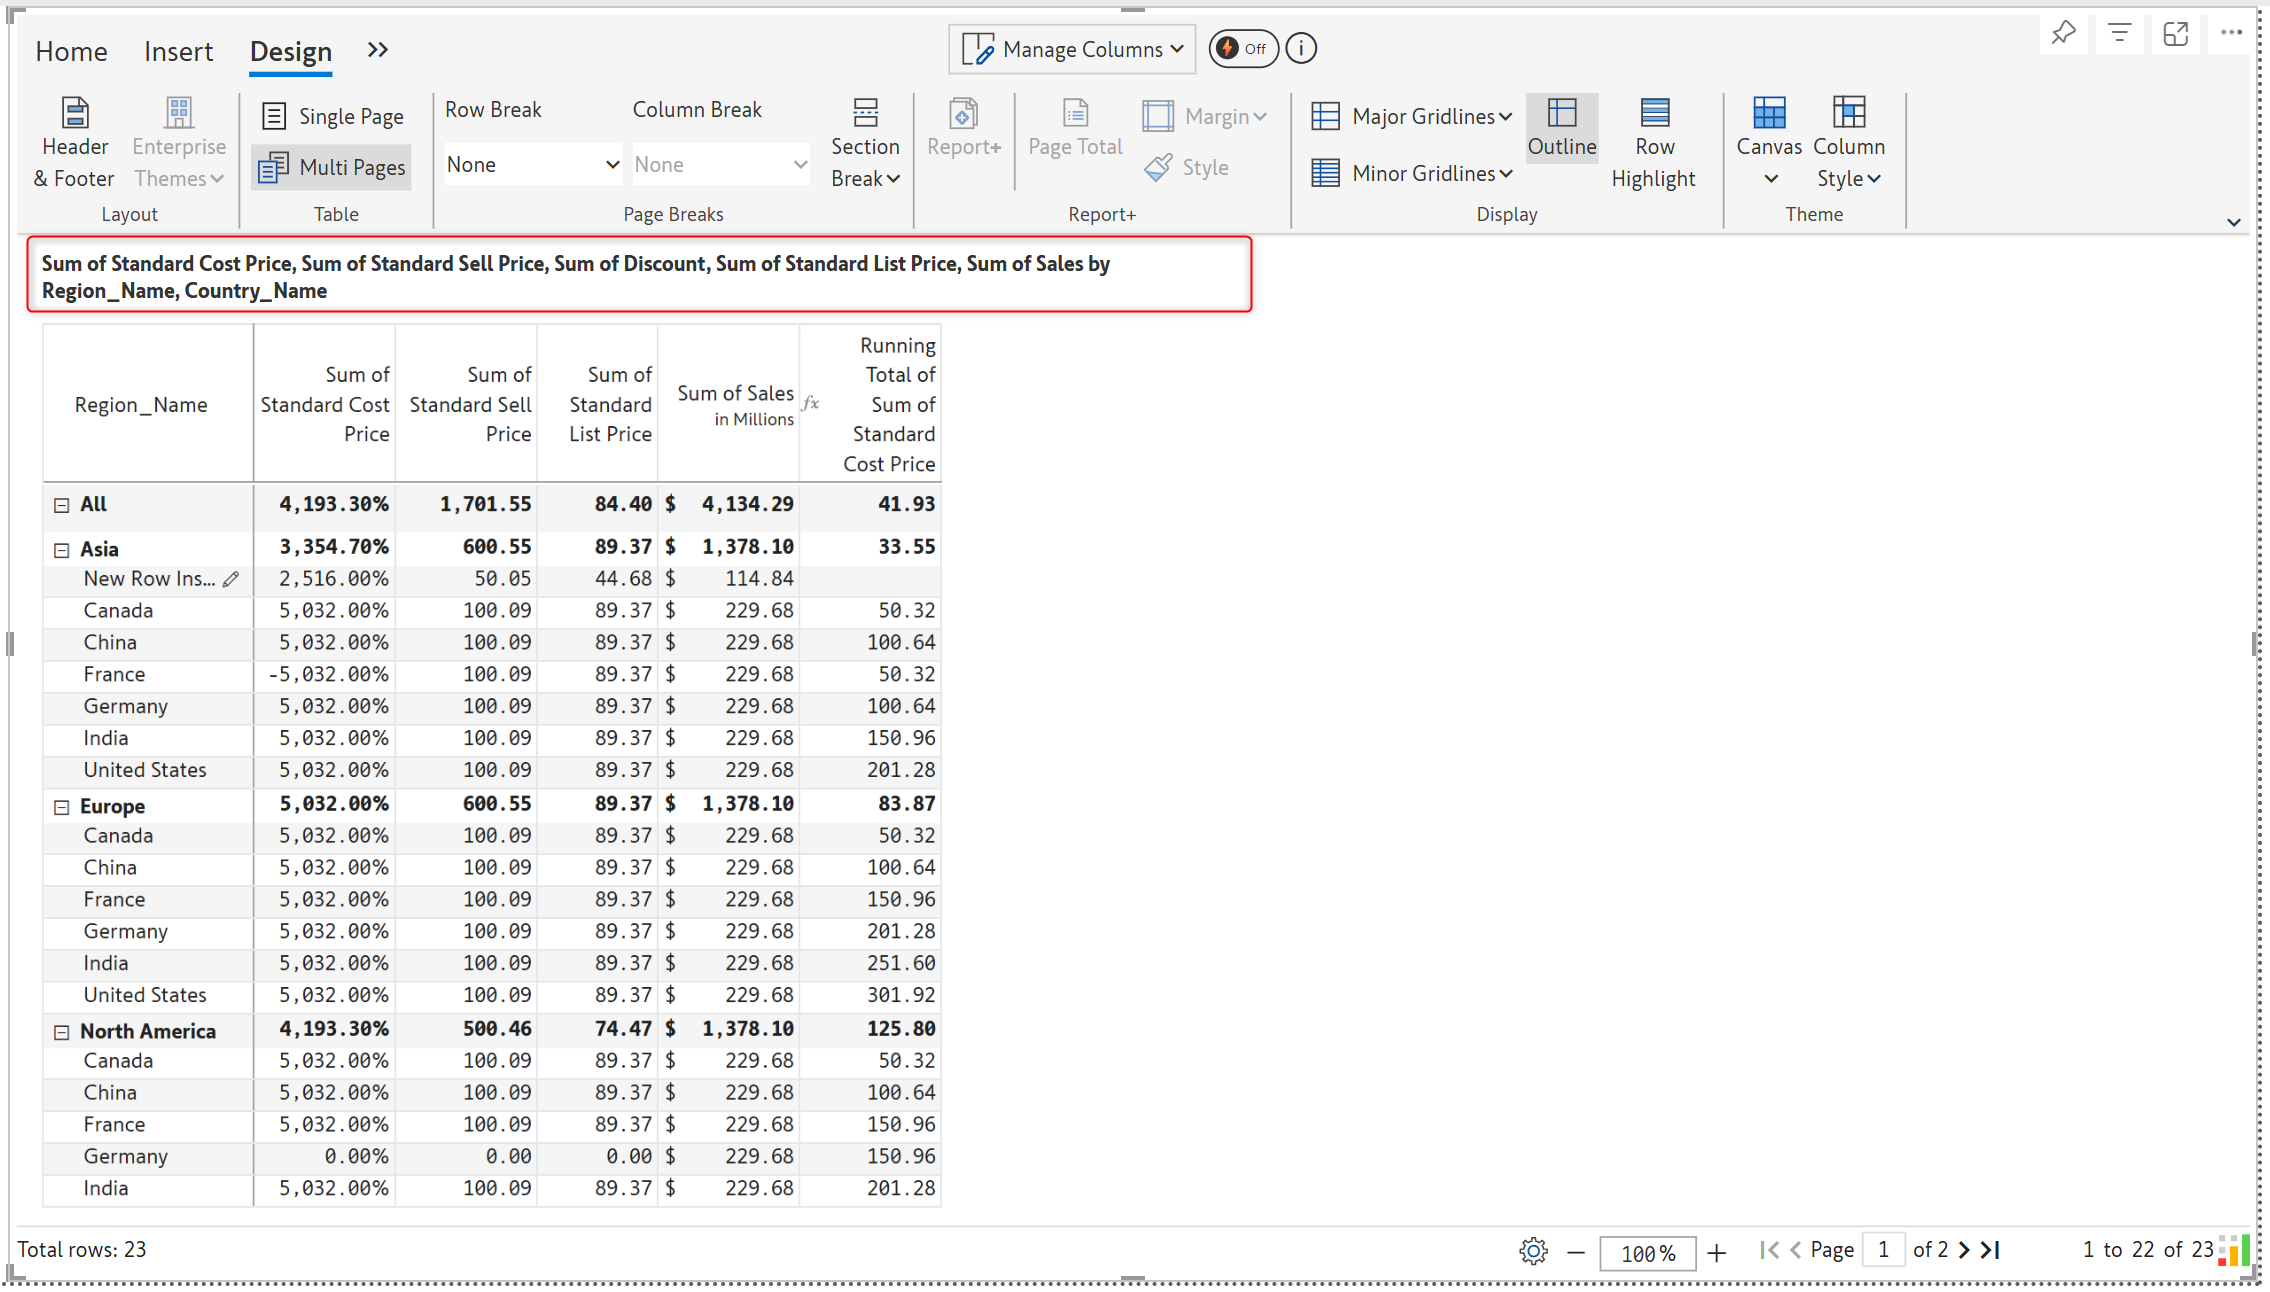
You can insert Rows, Columns, and invert them as well in the reading view. While these changes can be exported, they cannot be saved. When the page is refreshed or the page is switched, these changes will not be saved in the backend.

<figure><img src="/files/dWdUeqN8n4yOgIqvA2I4" alt=""><figcaption><p>A new row is inserted, and a cell is inverted in Reading View.</p></figcaption></figure>

<figure><img src="/files/S1fuvo7Fufb2DalPcoCI" alt=""><figcaption><p>Column is inserted in Reading View using Quick Formula</p></figcaption></figure>

<figure><img src="/files/PlcCy7lNVya85MaFm9TB" alt=""><figcaption><p> Prefix and % applied to columns in reading view</p></figcaption></figure>

The image below shows the Conditional Formatting applied.

<figure><img src="/files/uGTD60mrELPIZitpLRjN" alt=""><figcaption><p>Conditional Formatting applied.</p></figcaption></figure>

## 6. Exporting Footer in Excel

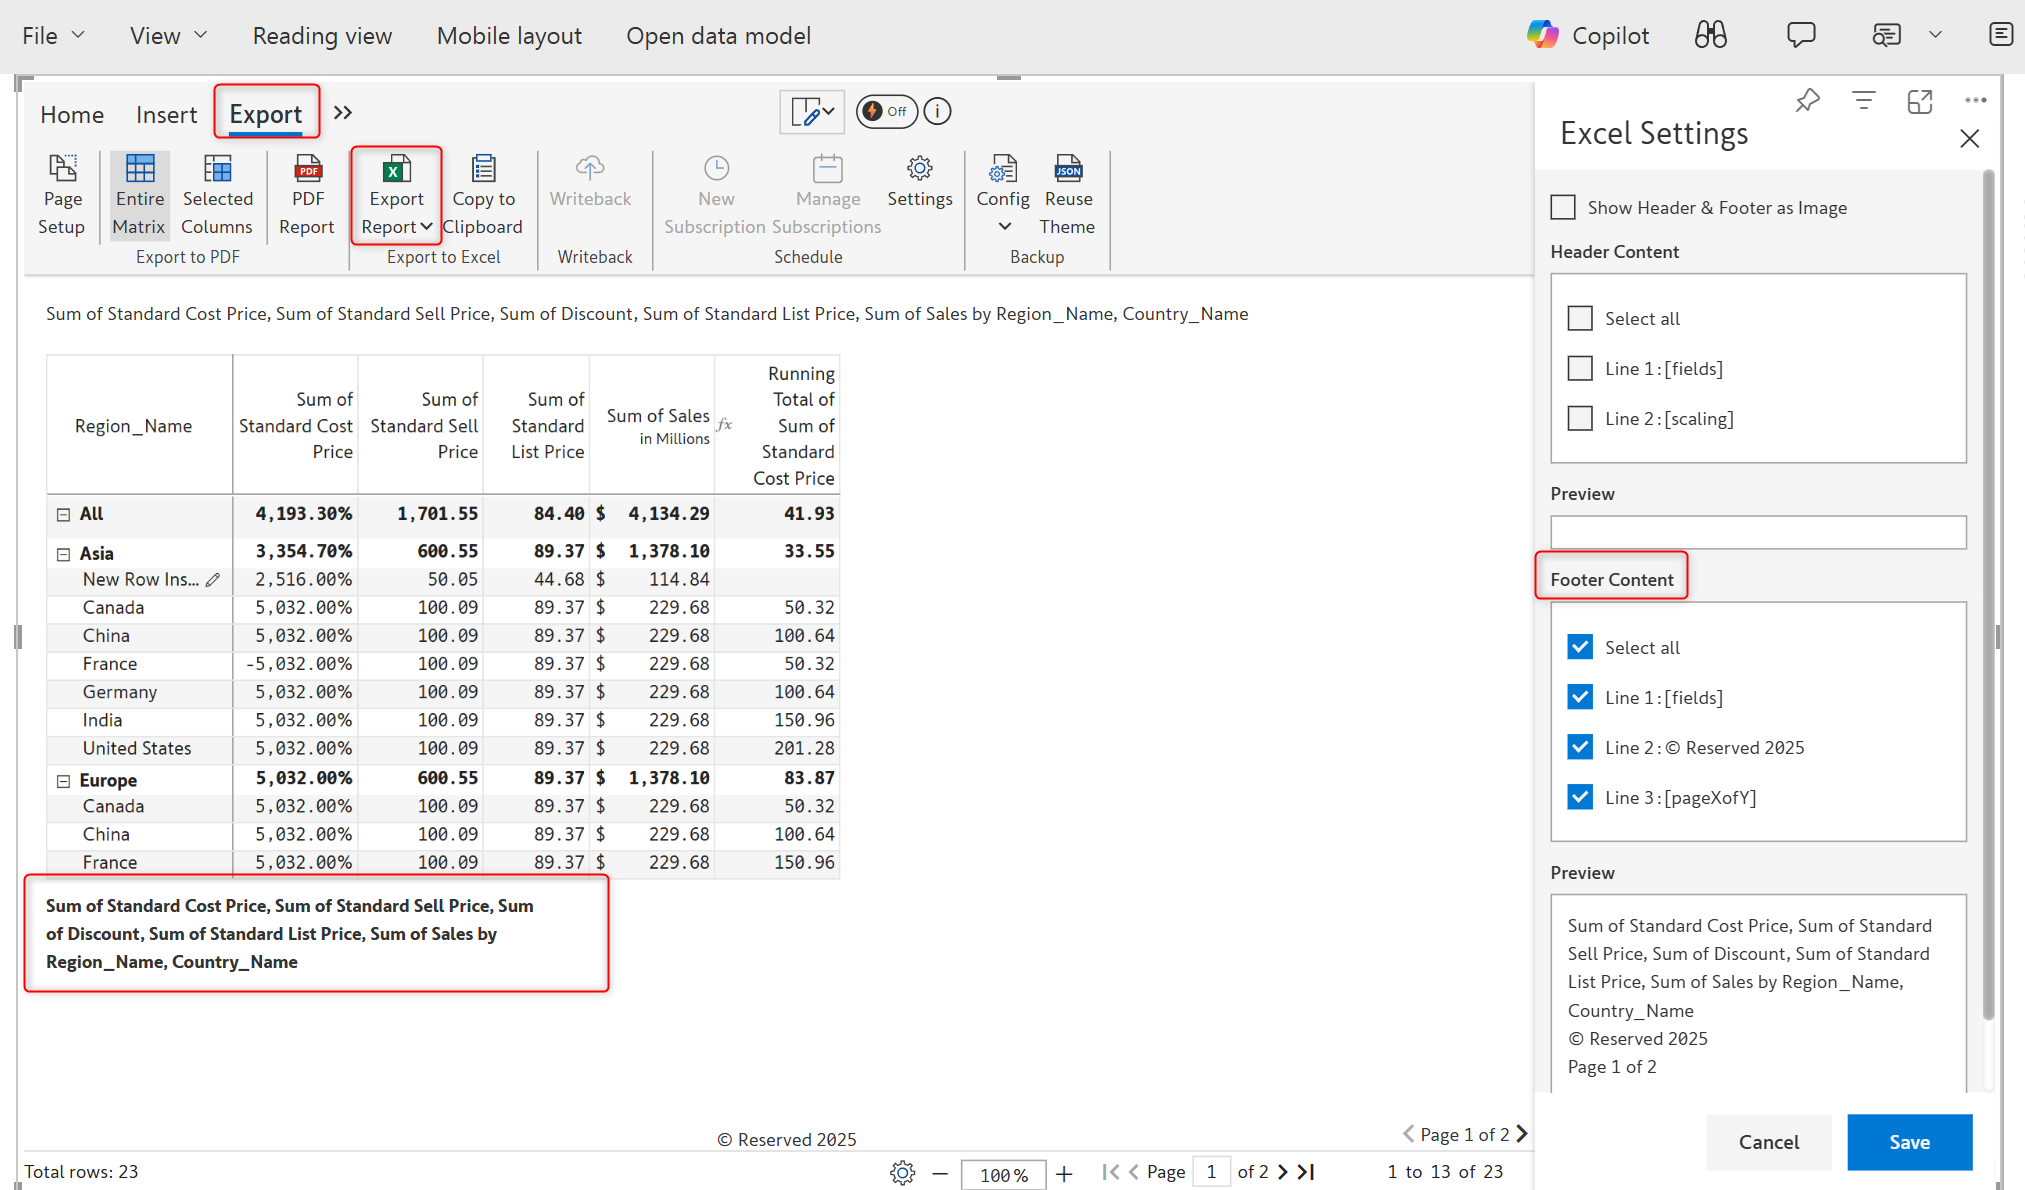
You can now include the footer while exporting. Go to Export > Export Report > Excel Settings.  In Excel Settings, select the options to be exported under Footer content and click Save.

<figure><img src="/files/bsKgcOZNXi3uMsHSQGzJ" alt=""><figcaption><p>Excel export setting for footer content</p></figcaption></figure>

<figure><img src="/files/WVbChgm2hmx1iJyRhpuU" alt=""><figcaption><p>Footer Content within the exported excel.</p></figcaption></figure>

## 7. Header Preset for Rows and Columns.

You now have row filter and column filter options in header presets to display row and column names in the header.

<figure><img src="/files/AeqUKkR3oMuqhk6L4Ktb" alt=""><figcaption><p>Header Preset options</p></figcaption></figure>

<figure><img src="/files/BBlgKQXX8paKzkcHZbCt" alt=""><figcaption><p>Header Preset with Column filter.</p></figcaption></figure>


---

# Agent Instructions
This documentation is published with GitBook. GitBook is the documentation platform designed so that both humans and AI agents can read, navigate, and reason over technical content effectively. Learn more at gitbook.com.

## Querying This Documentation
If you need additional information that is not directly available in this page, you can query the documentation dynamically by asking a question.

Perform an HTTP GET request on the current page URL with the `ask` query parameter, and the optional `goal` query parameter:

```
GET https://docs.inforiver.com/release-notes/inforiver-reporting-matrix/inforiver-reporting-matrix-october-2025-v3.3.9.md?ask=<question>&goal=<endgoal>
```

`ask` is the immediate question: it should be specific, self-contained, and written in natural language.
`goal` is optional and describes the broader end goal you are ultimately trying to accomplish on behalf of the user. GitBook uses it to tailor the answer towards what is most useful for that goal.

The response will contain a direct answer to the question and relevant excerpts and sources from the documentation.

Use this mechanism when the answer is not explicitly present in the current page, you need clarification or additional context, or you want to retrieve related documentation sections.