> For the complete documentation index, see [llms.txt](https://docs.inforiver.com/llms.txt). Markdown versions of documentation pages are available by appending `.md` to page URLs; this page is available as [Markdown](https://docs.inforiver.com/release-notes/inforiver-writeback-matrix/inforiver-writeback-matrix-may-2025-v4.5-audit-redesign-writeback-optimizations-and-more.md).
# Inforiver Writeback Matrix May 2025 - v4.5 - Audit redesign, Writeback optimizations, and more
Capturing business insights in Power BI is easier than ever with our lineup of Data Input features, like the data import utility, conditional template rows, and enhancements to data input rules. We've also released a number of optimizations under the hood to make sure you have the most efficient reporting experience with Inforiver Matrix. In a highly collaborative environment like Inforiver Matrix, a robust audit trail is vital - we've re-designed the Audit log to a full-page, spreadsheet-style view.
Explore our new range of features that make Inforiver Writeback Matrix the most powerful platform for planning, collaboration, and writeback in Power BI.
## 1. Writeback
#### 1.1. Writeback performance and data volume optimizations
Inforiver's writeback now delivers faster writebacks and handles more data volumes - writeback up to 1 million cells with a 75% reduction in processing time.
To trigger faster writebacks, enable the **Execute Writeback using optimized approach** toggle from the Admin console > Writeback Settings. This option is enabled by default from this release for both existing tenants and new tenants. This option can be disabled at any point.
## 2. Scheduler
#### 2.1. Priority for subscriptions
Managing multiple report subscriptions just got easier—with the new *Priority* option, you can now control which subscription takes precedence. If you have bookmarks and filters in your reports, you can set individual priorities for each. The priorities set for bookmarks/filters will automatically be cascaded across all destinations.
For dynamic subscriptions, you can source the priority from semantic models or CSV files.
{% hint style="info" %}
The Priority option is available only for on-prem users.
{% endhint %}
## 3. Goal Seek
#### 3.1. Goal Seek for formula rows
Strengthen your “what-if” analysis with Goal Seek for calculated rows. If you have a calculated row that refers to a data input or forecast row, you can now use Goal Seek to automatically adjust the input row to achieve the desired result based on the row-level formula.
In this report, we have a Total formula row based on a native row and a forecast row. We can change values in the formula row with Goal Seek and let Inforiver do the heavy lifting to calculate and apply the required modification to the forecast row.
## 4. Audit log
#### 4.1. Audit log redesign and refactoring
Inforiver Writeback Matrix provides a platform for multiple teams or departments to collaborate on reports, e.g., to update budgets and forecasts or update project/approval status. A comprehensive audit log is essential to ensure accountability, data integrity, and regulatory compliance. In this release, we've completely re-hauled the audit log to make it more streamlined and easier to use.
The audit log has been redesigned from a side pane to a full-page, spreadsheet-style view—complete with filters and dropdowns—making it easier to track and manage audits. The **Data Input** tab, as the name implies, captures all the changes made to data input fields.
View the report-level changes in the Reports tab.
## 5. Admin console
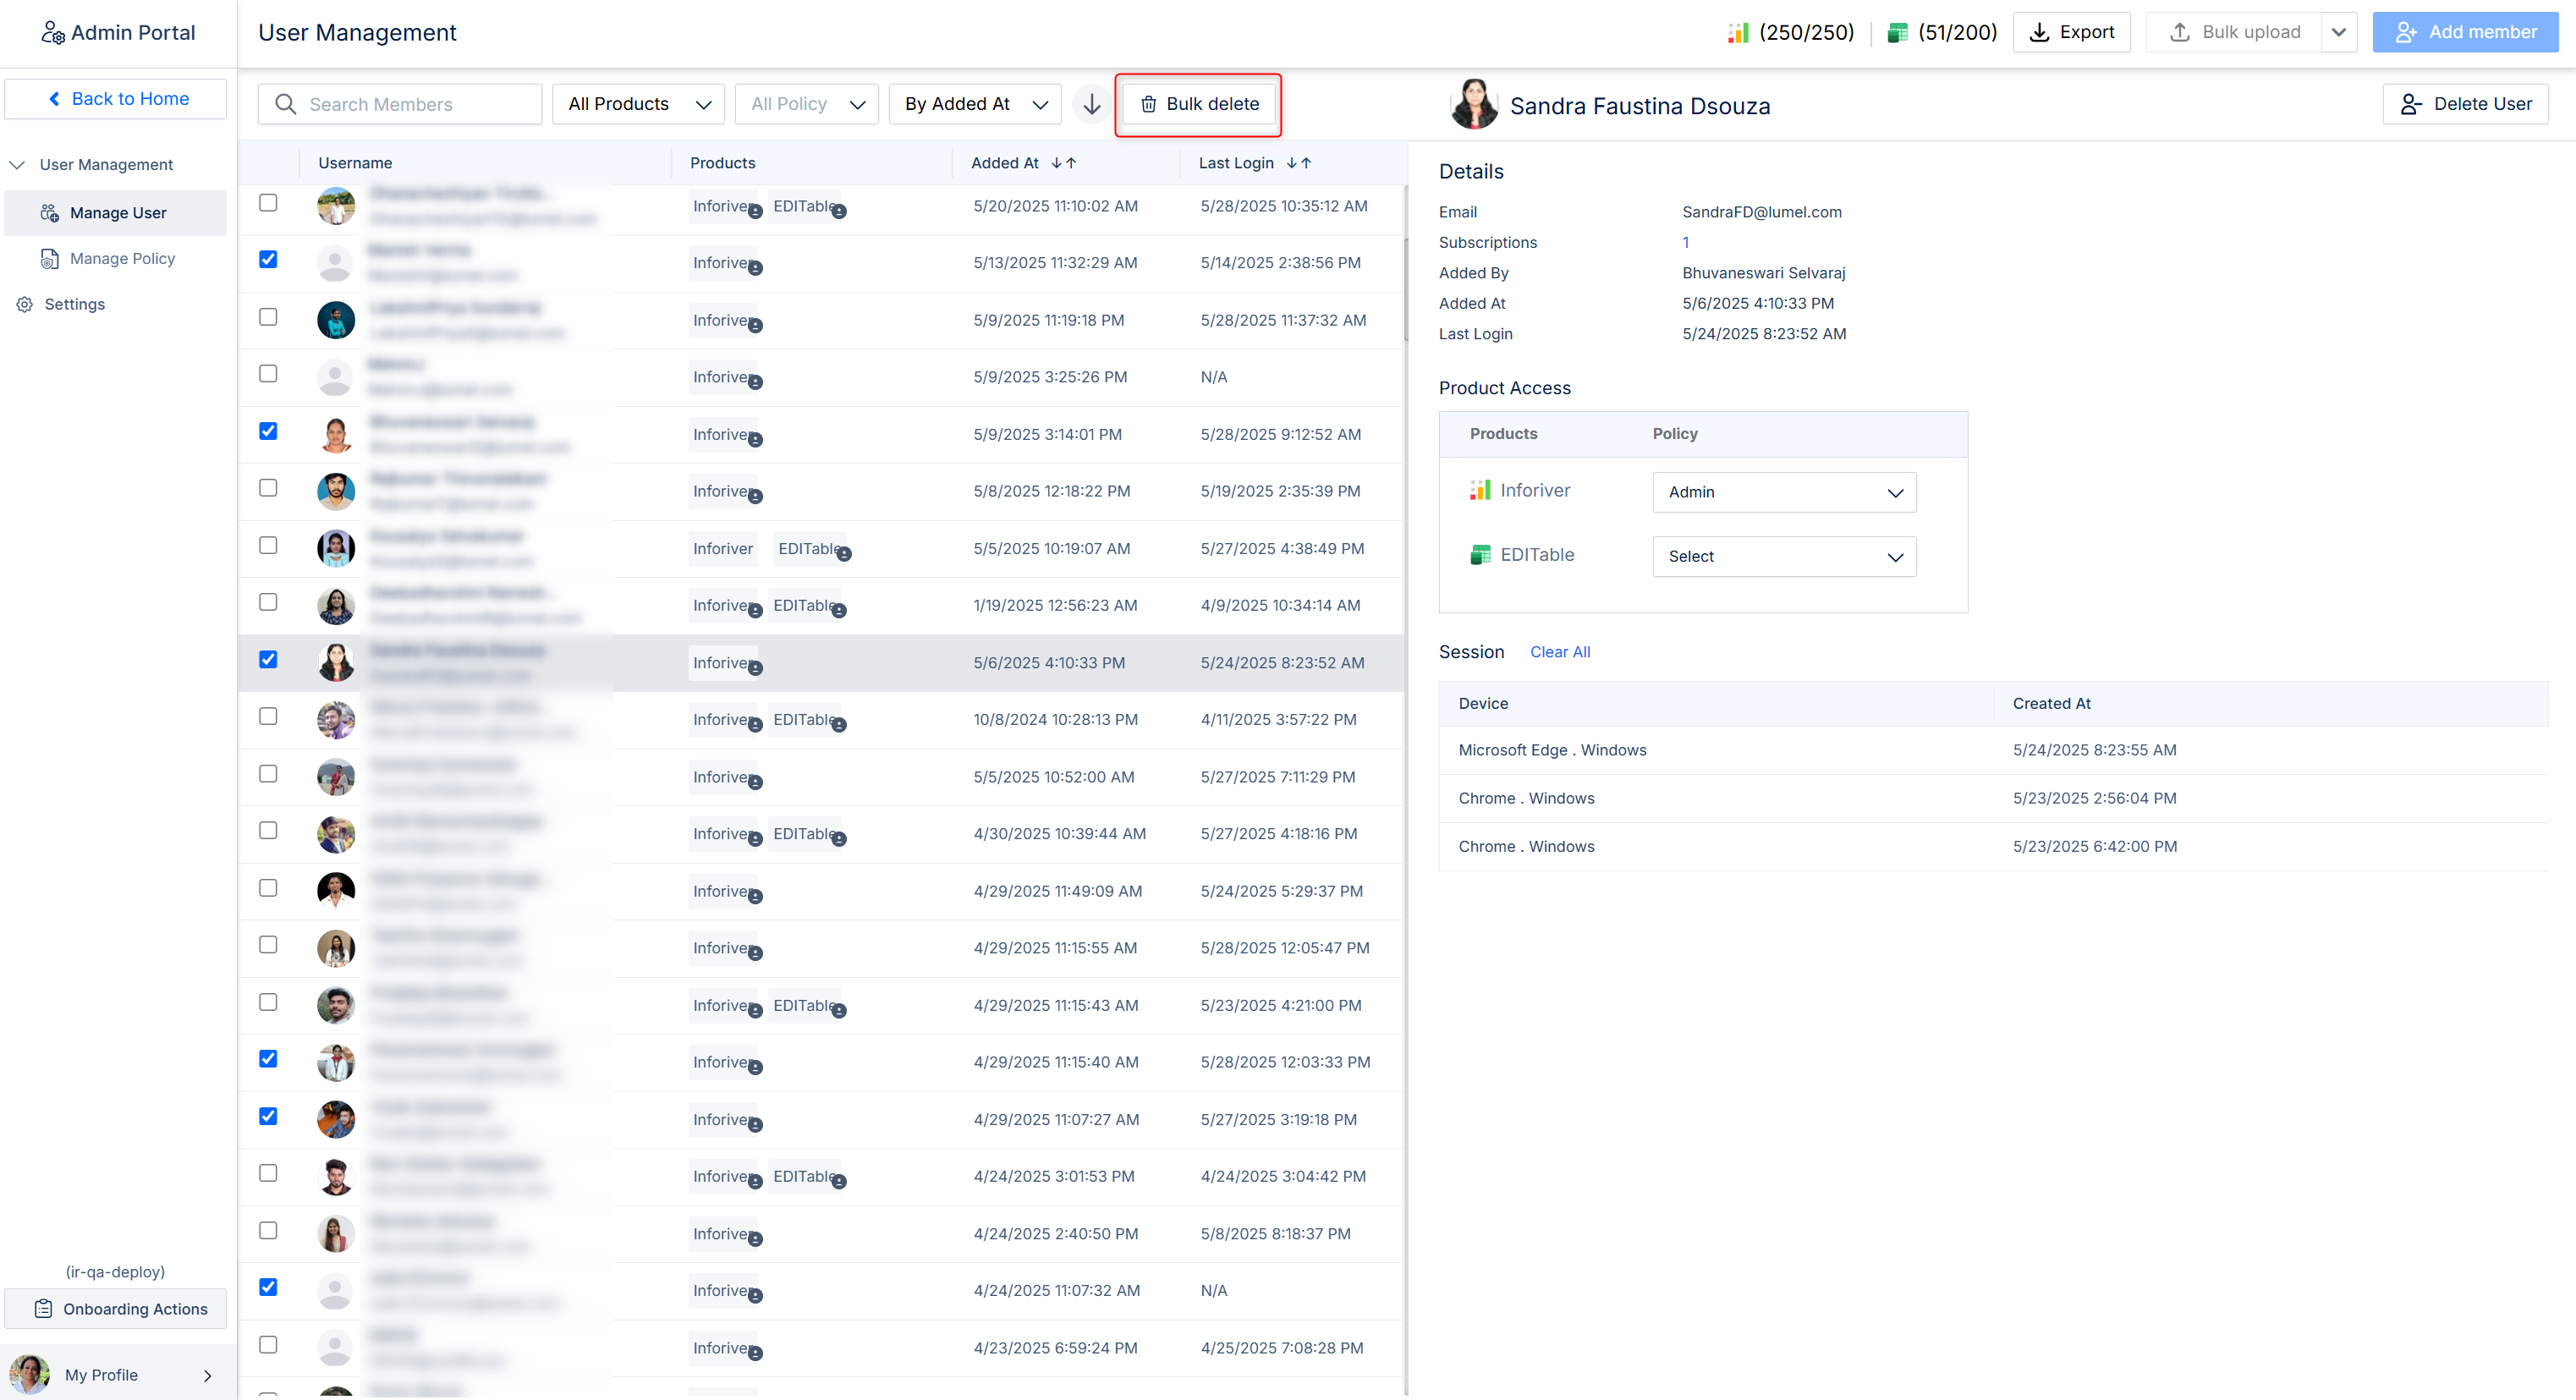
#### 5.1. Bulk delete option
Easily delete multiple users in one action by selecting them and clicking the Bulk Delete button.
#### 5.2. Admin console export user details
Exporting user details from the admin console may be required for operational, compliance, or business continuity reasons. Inforiver's admin console now supports exporting all the metadata associated with registered users.
## 6. Manage custom visual rows
#### 6.1. Conditional template rows
Inforiver Matrix delivers efficient hierarchy handling with the template rows option - insert custom rows automatically at each level of the hierarchy at one shot, without having to insert them individually. You now have additional control over which levels to create template rows in. Click the configure link in the Template conditions section. You can directly select the row categories by selecting the *Simple* radio button or specify filter conditions by selecting the *Advanced* option.
#### 6.2. Filter for inserted rows
Inforiver Matrix offers a no-code, intuitive interface that enables users to insert aggregated rows, custom row hierarchies, calculated rows, and even forecast rows directly in the visual. The robust row-management feature now comes packaged with a filter that allows users to quickly locate different types of rows.
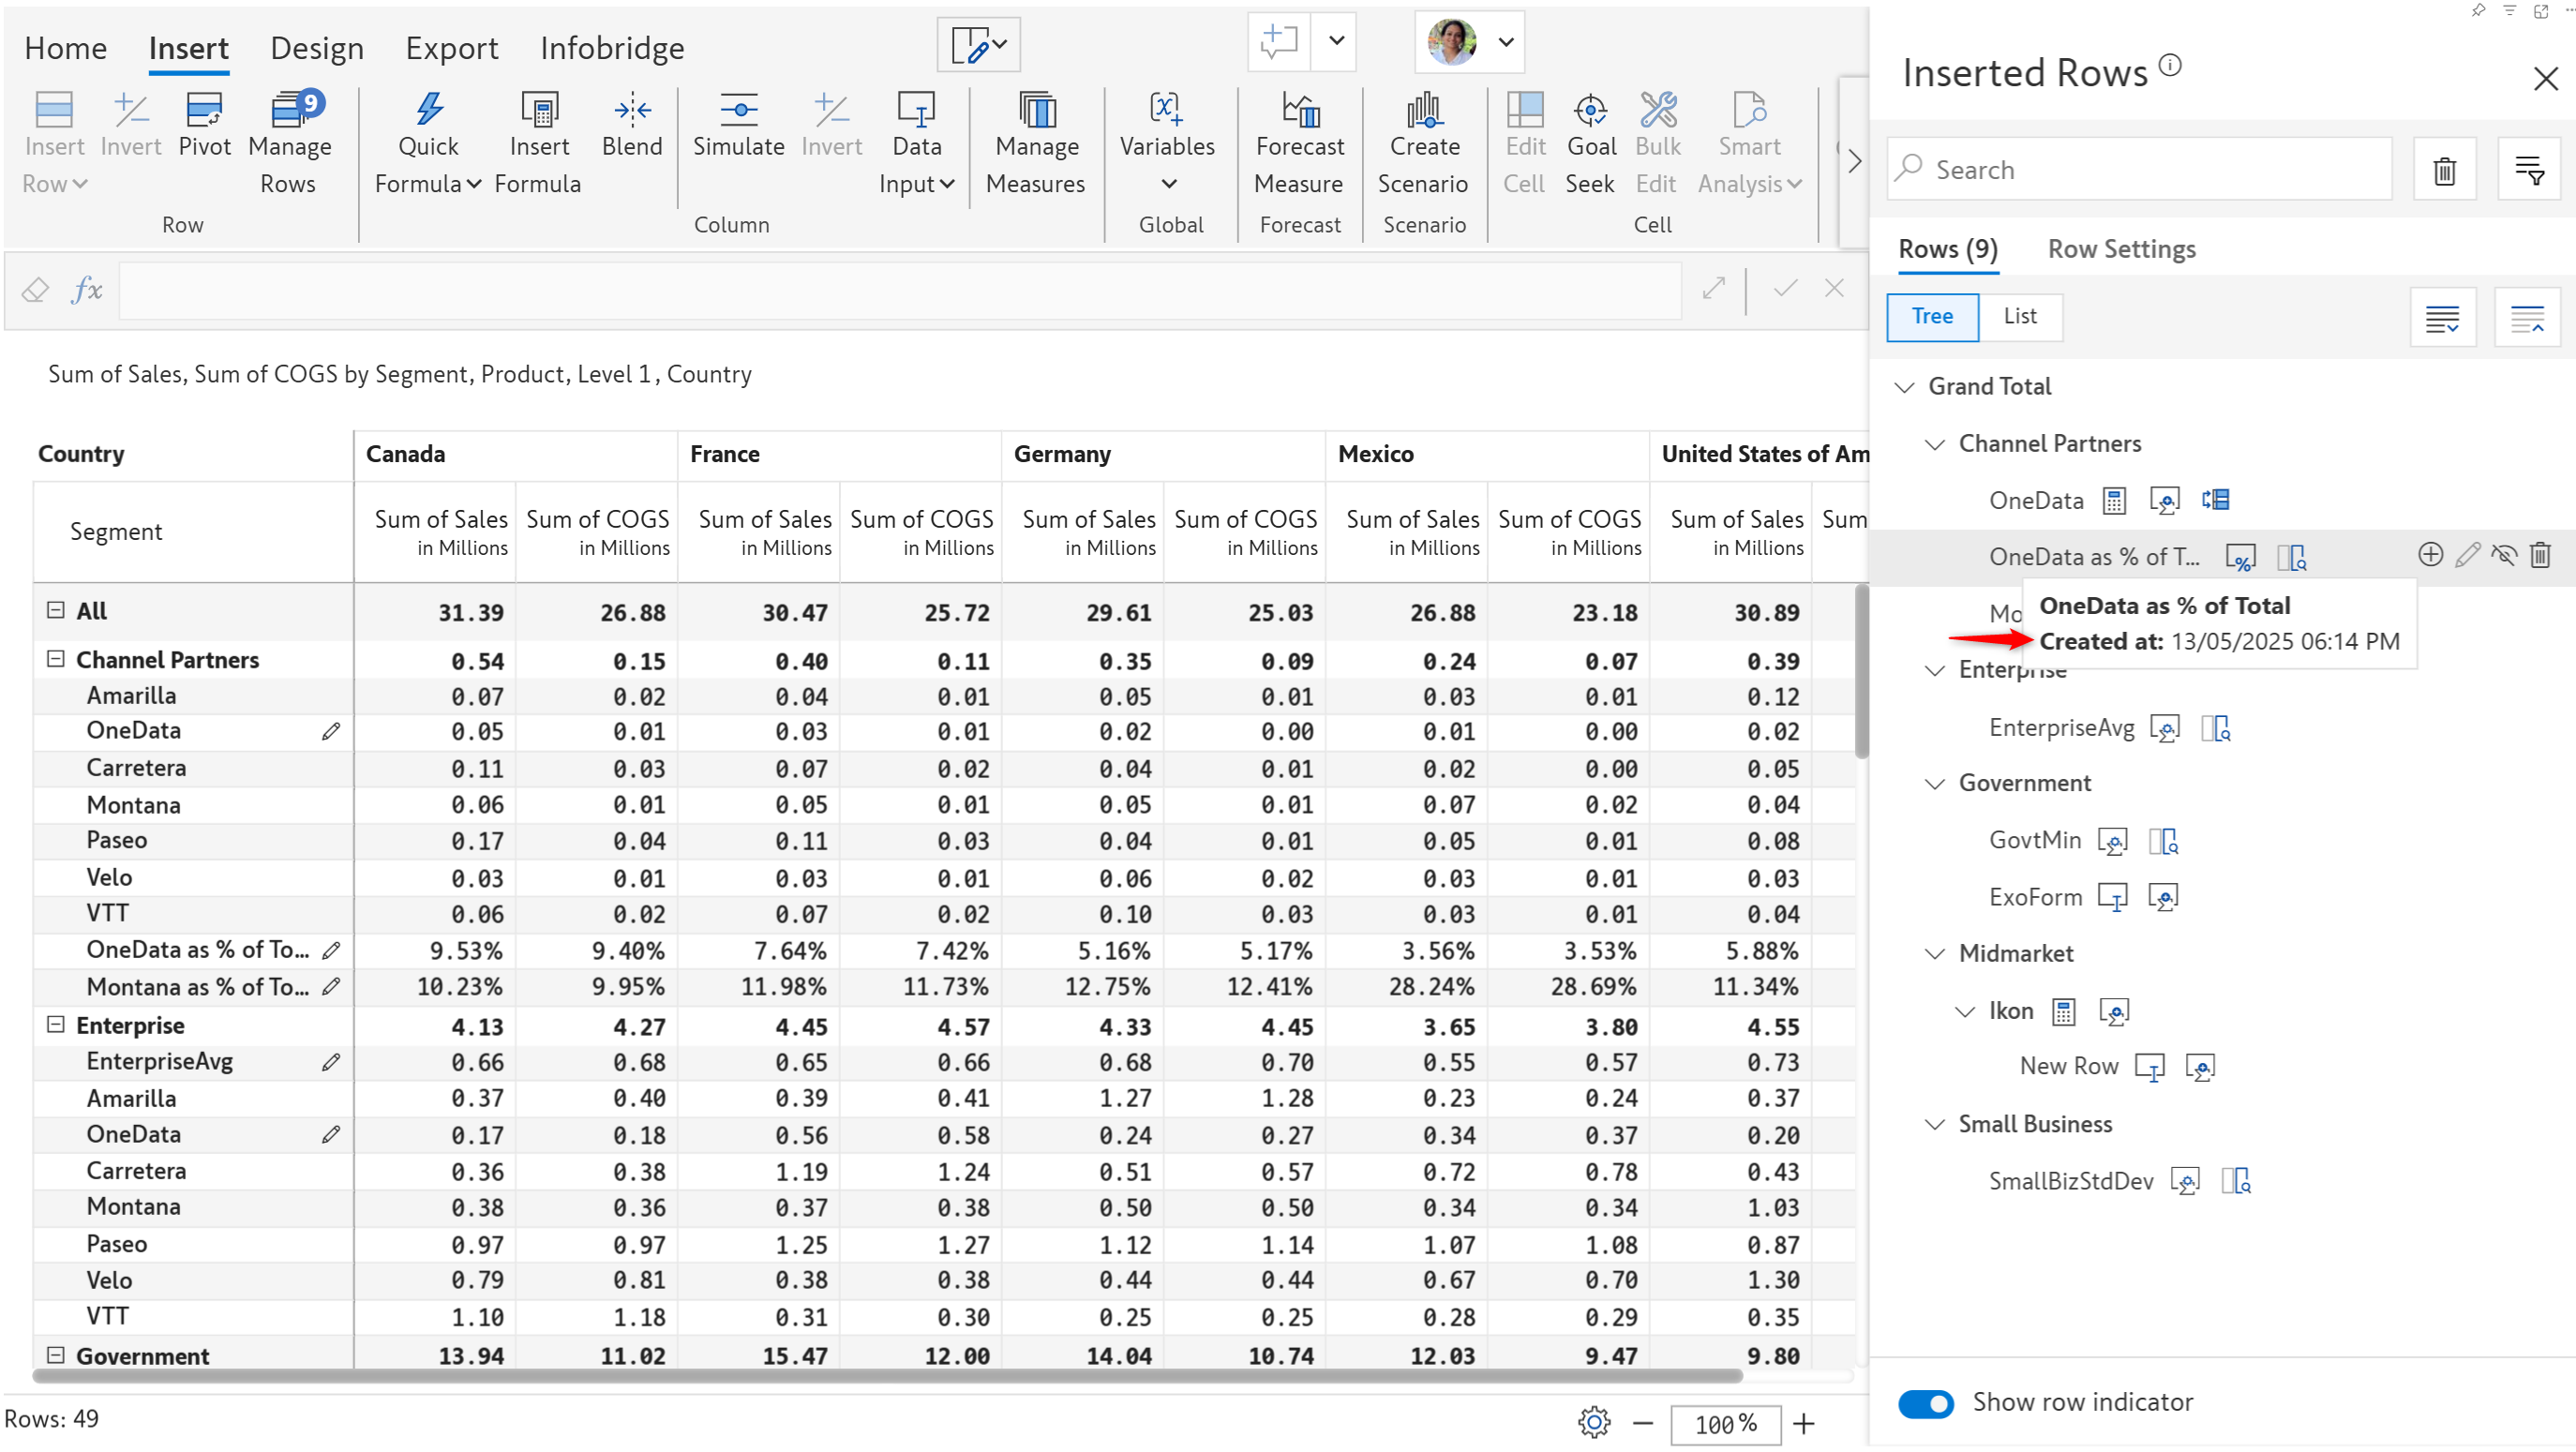
#### 6.3. Insert rows - creation timestamp
In list or tree view, simply hover over a row to view the timestamp when it was inserted.
## 7. Data input
#### 7.1. Data import utility
Inforiver Matrix provides the flexibility to input values in Excel and seamlessly import them into the visual. This option, which was previously supported only for data input number fields, has now been extended to all data input types.
Using the import utility is as simple as selecting the measure to input values -> downloading the Excel template -> entering values directly in Excel, and importing the template back into the Inforiver Matrix visual.
#### 7.2. Aggregation for date data input
Track the earliest or latest date under a parent category by setting the subtotal aggregation to minimum or maximum for date data input fields - for instance, the earliest or latest delivery date for a product range.
#### 7.3. Duplicate formula
Use the new duplicate icon to quickly replicate formulas that need to be reapplied in similar calculations.
#### 7.4. Suppress null data input measures
Data input measures with no assigned values offer no meaningful contribution to reports. You can opt to suppress them by enabling the Suppress Null DI (Number) Measures option in Display Settings.
In this sample report, a budget has not been allocated to the Mineral Water category. We can hide this column by enabling the suppress null option for data input measures.
{% hint style="info" %}
This option will be enabled only when the Ragged Hierarchy option is turned on.
{% endhint %}
Suppress null disabled
Suppress null enabled
#### 7.5. Data input rules -enhancements
* Pop-out window for easy dimension selection
When you apply rules to data input fields, you can also select the row and column dimensions to which the rules apply. The new pop-out window makes it convenient to scroll and select dimensions, especially when complex hierarchies are involved or the report has a large number of row/column dimension categories.
* Specify custom filter conditions to apply rules with the new filter tab.
* Measure values for min/max rules
In addition to setting a static value, you can now define minimum and maximum ranges using the new 'Measure' option. Simply select a measure to dynamically control the range limits.
## 8. Export
#### 8.1. Display negative signs in Excel export
In Excel exports of Writeback Matrix reports, manually changing positive numbers to negative numbers would not be reflected in the cells. The negative sign would be displayed only in the toolbar when the cell was clicked. This issue has been rectified in the latest version.
#### 8.2. Export Excel - formula index
Have you ever needed to understand how a specific field was derived in an Excel export? The new **Add appendix at last sheet** option includes a formula index tab in the Excel export, enabling users to easily refer to the underlying formulas used.
## 9. Freeze rows and columns
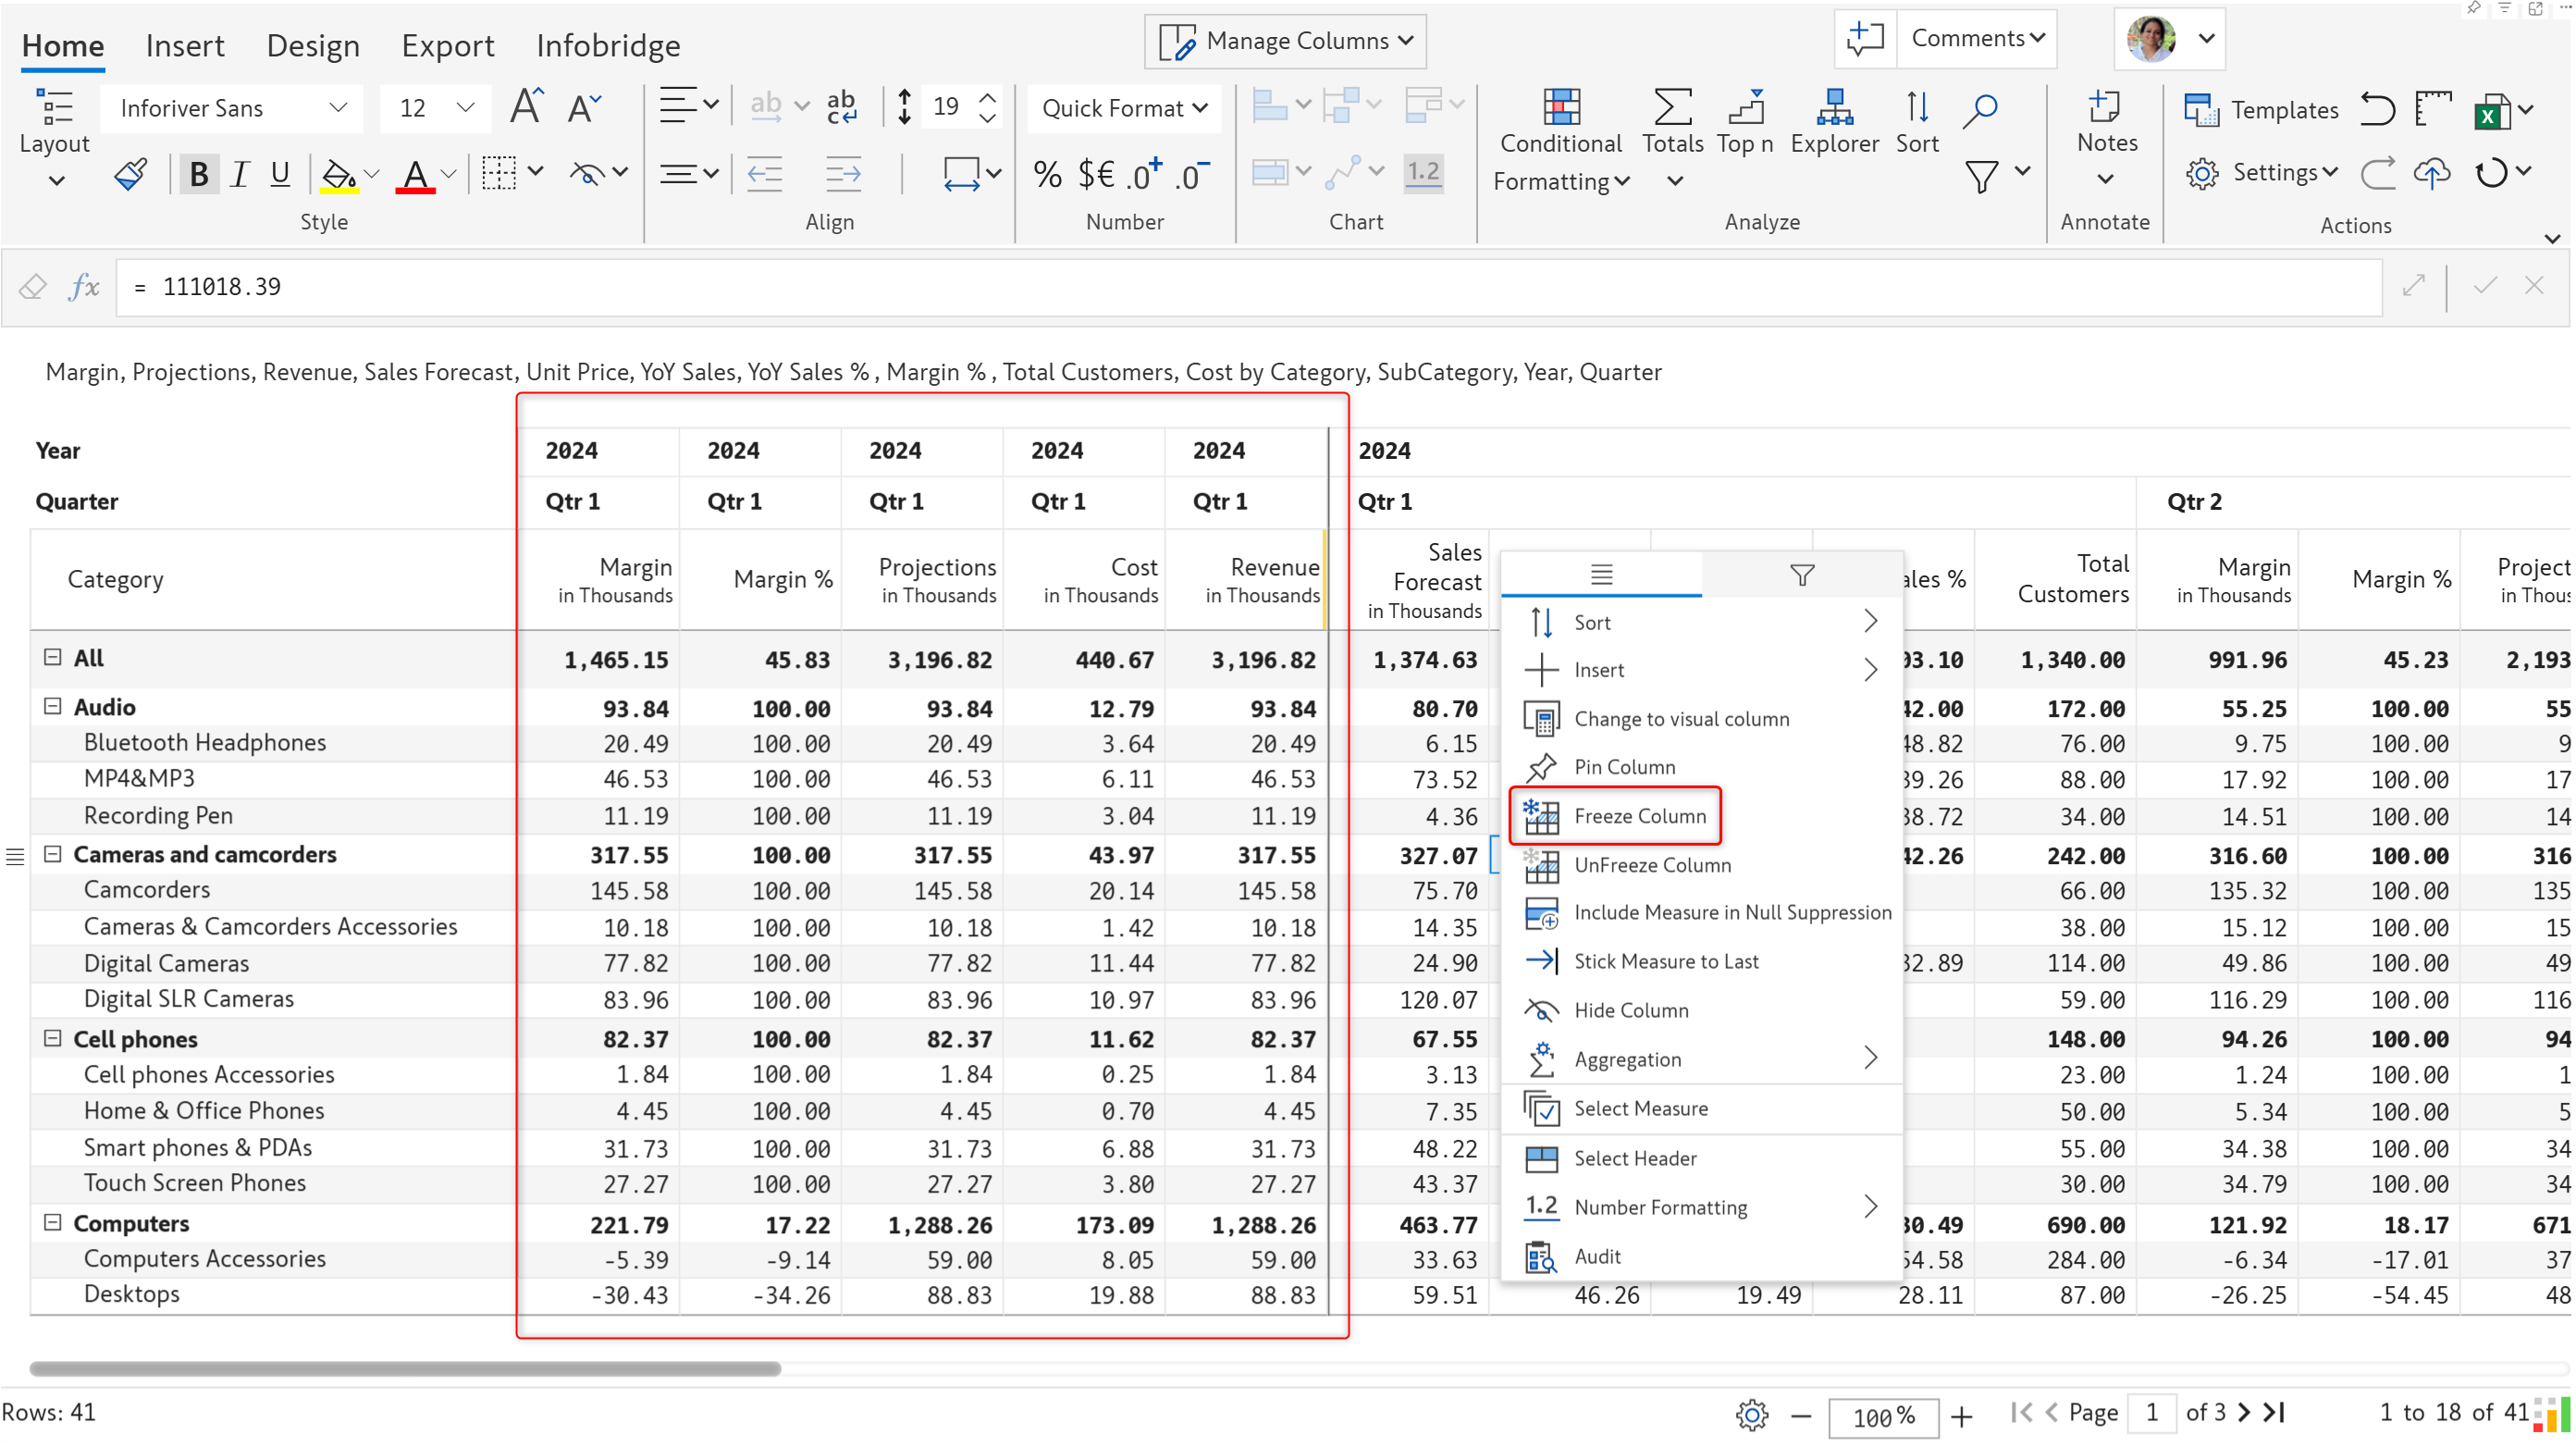
Navigating large reports with numerous rows and columns can make data comparison cumbersome with a significant amount of scrolling. With Inforiver Matrix, you can freeze selected rows and columns to keep key metrics in view - making analysis faster and more efficient.
For example, to use the key metrics for 2024-Q1 as a benchmark, you can freeze those specific columns as shown in Image 1. To analyze the Gross Profit and Net Revenue based on US Central metrics, you can freeze the selected rows and columns from the row/column grippers.
Freeze columns
Freeze rows and columns
Frozen rows and columns will be retained in Excel and PDF exports:
Excel export
## 10. Commenting and collaboration
#### 10.1. Specific handling for tagged and assigned users
When you add context to a report with a comment, you can tag a user with the @ symbol and assign the comment to a different user. In earlier versions, the comment would get re-assigned to the tagged user. In the latest version, the assignee will not change irrespective of @ mentions in the comment.
All the tagged users will also receive notification emails that they have been mentioned in a comment.
## 11. Other enhancements
#### 11.1. Checkbox-based filters
Checkboxes are widely used in reports for data selection, like shortlisting specific transactions or marking approval/review status. You can now filter data based on checkbox values using the new 'Checked' and 'Unchecked' options. An application within Inforiver Matrix would be to use the checkbox filter to writeback only the selected records.
#### 11.2. Total rows in the footer
In the table layout, the aggregated row subtotals for each parent dimension category are suppressed by default; however, these rows were being considered while calculating the overall number of rows. In the latest version, the subtotal rows that are not displayed will not be counted when calculating the total number of rows.
Notice how the total number of rows is different in the Hierarchy layout where subtotals are enabled.
#### 11.3. Formula bar enhancements
The formula bar has been optimized for better usability. In earlier versions, unintentionally clicking a cell would automatically create a cell reference. Cell references will now be created only if it is the first item in a formula or preceded by an arithmetic operator. Users need to explicitly click inside the formula bar to create cell references. The erase button can be used to reset the cell to its original value.
#### 11.4. Approval workflows for reports without column dimensions
The latest version of Inforiver Writeback Matrix supports configuring approval workflows for reports that do not have column dimensions.
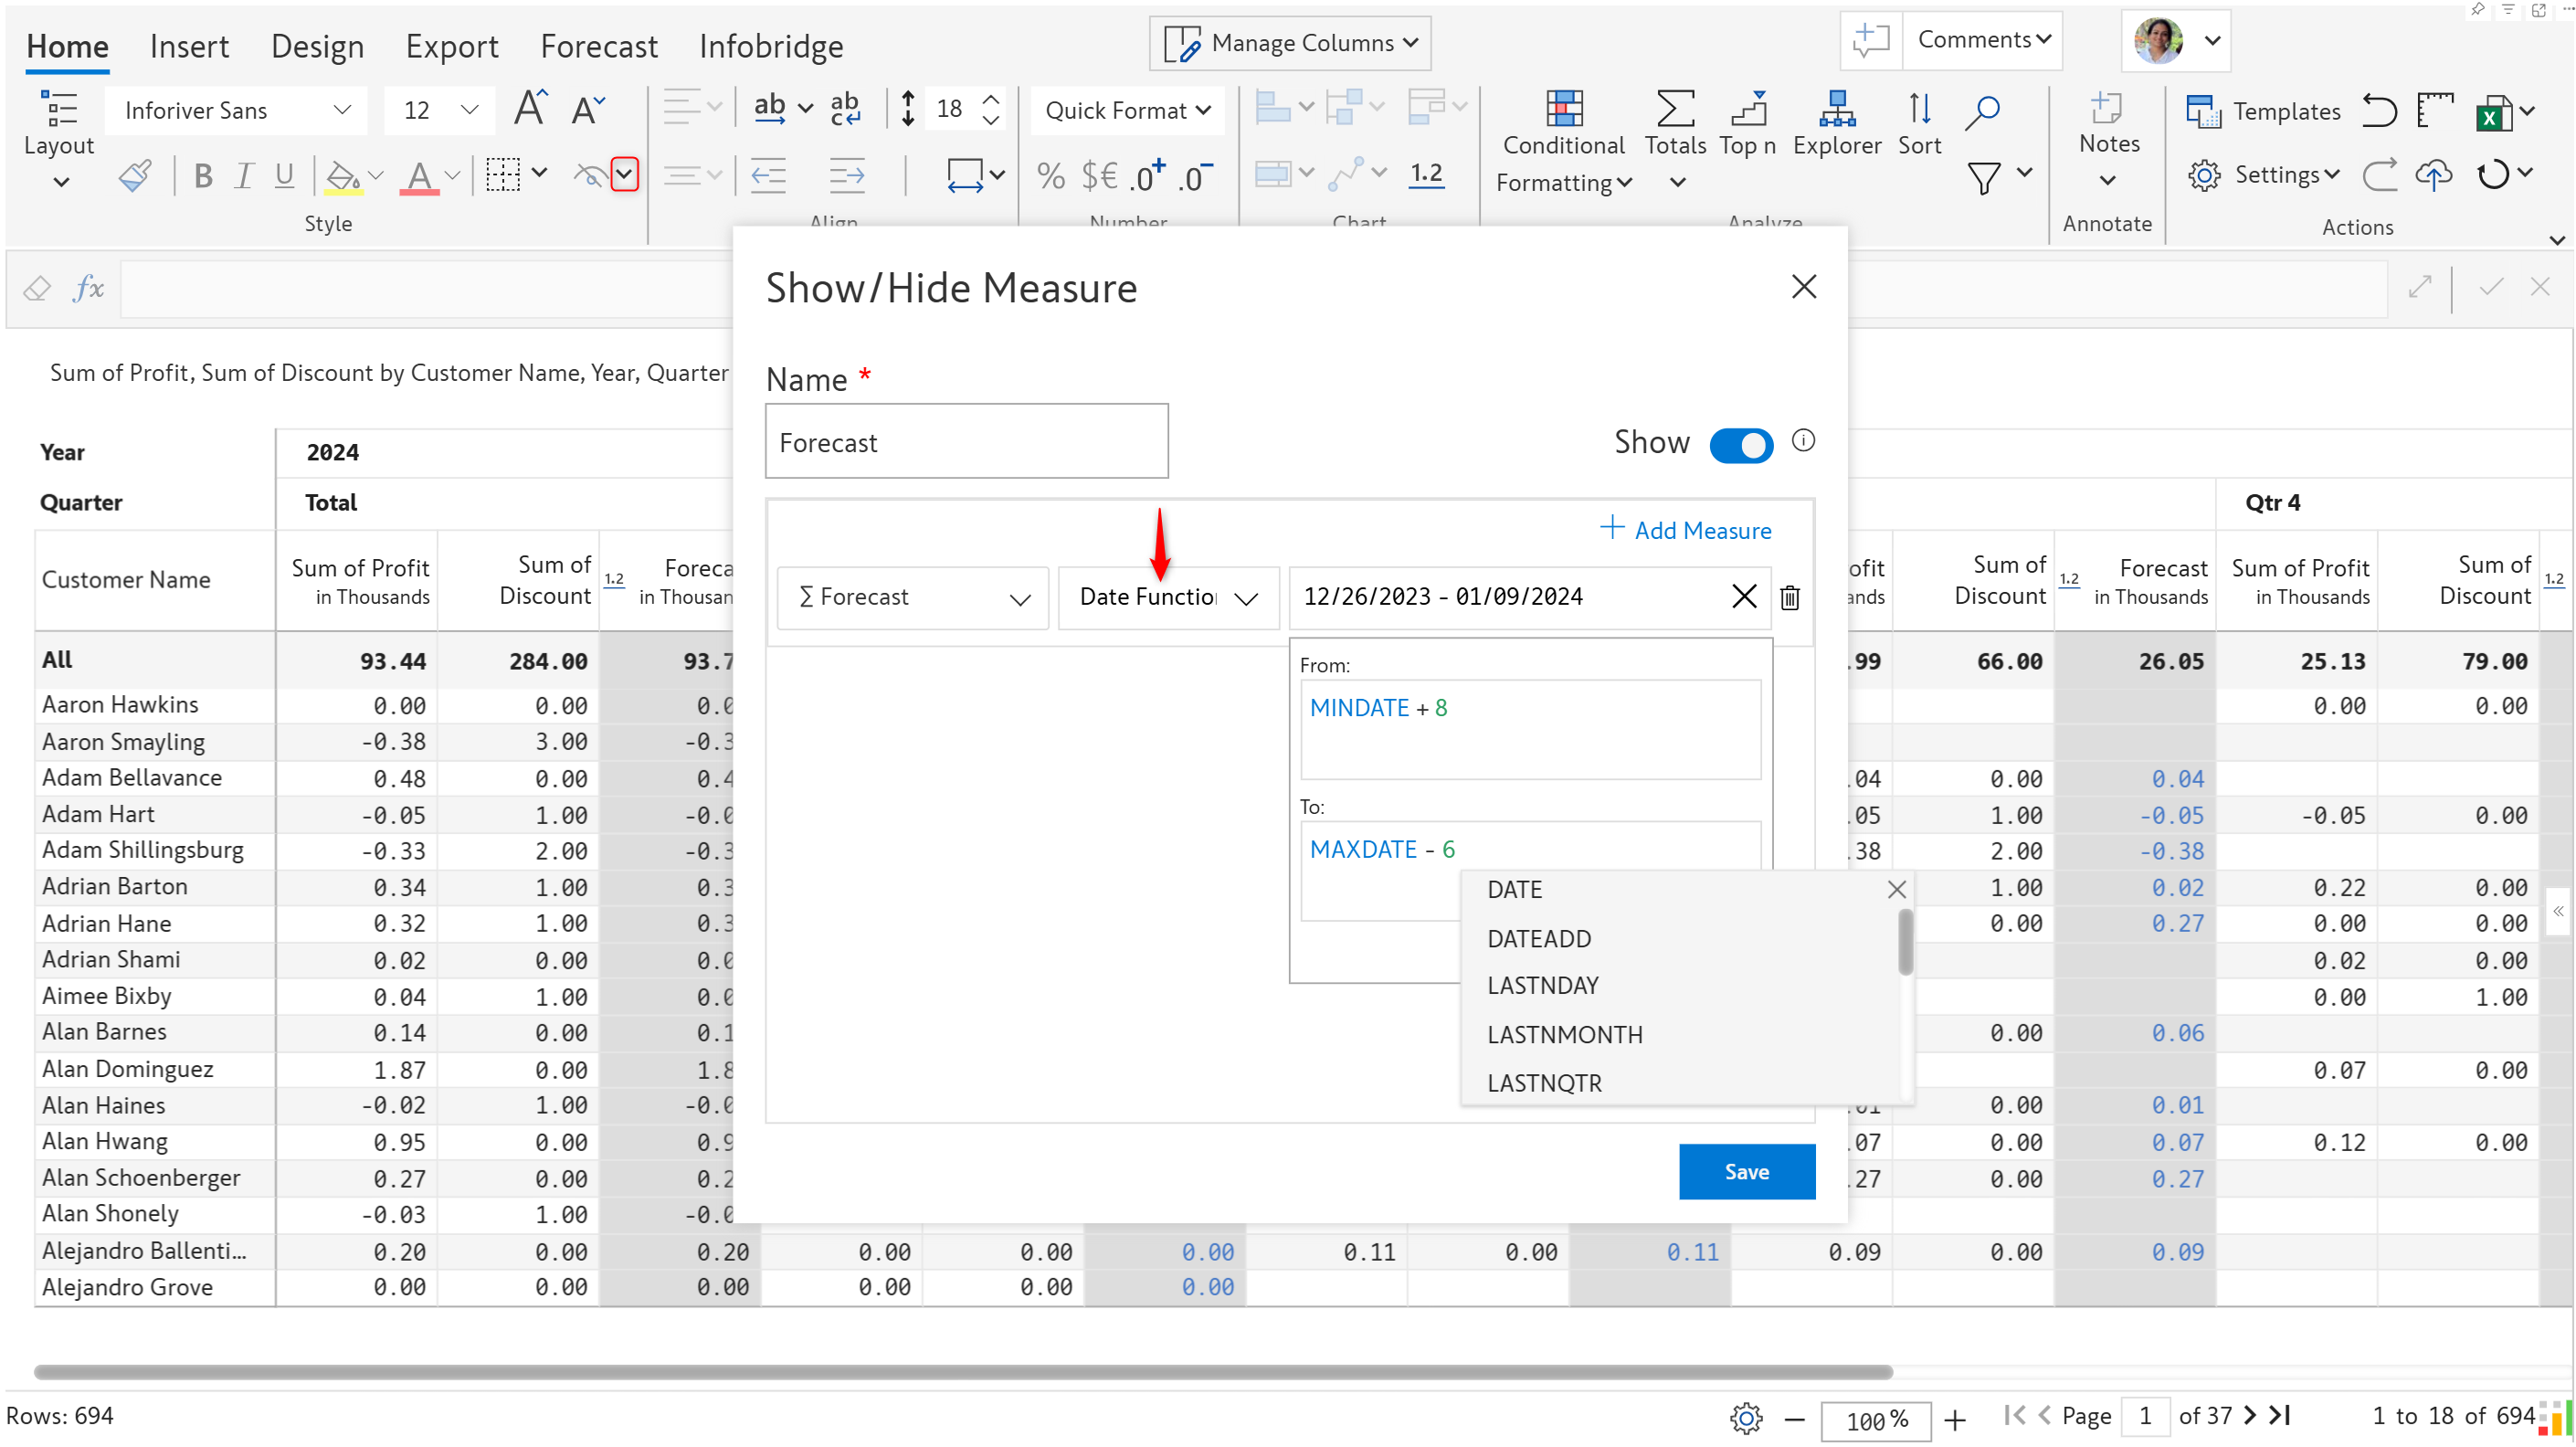
#### 11.5. Date functions to show/hide measures
You can now use Inforiver's built-in date and time intelligence functions to display measures over a specific range of time. Select the **Date Functions** options in the Show/Hide measures interface.
#### 11.6. My tasks - display unresolved tasks
The My Tasks pane will now display tasks assigned to users that are not resolved. Users can view other tasks with the filter button, but unresolved tasks will be displayed by default, helping users easily identify and address them on priority.
#### 11.7. Multi-select to filter data in other Inforiver Matrix visuals
In Inforiver Matrix, you can enable checkboxes to select multiple rows. Multi-row selection can now filter the records in another Inforiver Matrix visual. You'll see that the product names in the first visual are automatically filtered when we make category selections in the second visual.
#### 11.8. Improved accuracy for Scenario simulations
Scenarios created on numeric data input measures were not capturing simulations correctly. To demonstrate this, we've created a data input measure and used the native Sales measure as the default value. We've also updated the Grand Total from 2,297k to 4500k.
Data input number measure created with default measure value
Notice how the scenario did not capture the updated value of 4500k and instead automatically applied an incorrect simulation of 49%.
In the latest version, the updated data input values are accurately captured in scenarios without applying any incorrect simulations.
---
# Agent Instructions
This documentation is published with GitBook. GitBook is the documentation platform designed so that both humans and AI agents can read, navigate, and reason over technical content effectively. Learn more at gitbook.com.
## Querying This Documentation
If you need additional information that is not directly available in this page, you can query the documentation by asking a question.
Perform an HTTP GET request on the following URL with the `ask` and `goal` query parameters:
```
GET https://docs.inforiver.com/release-notes/inforiver-writeback-matrix/inforiver-writeback-matrix-may-2025-v4.5-audit-redesign-writeback-optimizations-and-more.md?ask=&goal=
```
`ask` is the immediate question: it should be specific, self-contained, and written in natural language.
`goal` is what the user is ultimately trying to achieve, the reason they need the answer. Sharing it helps GitBook give you a better, more relevant answer. A goal is most helpful when it describes the outcome the user wants rather than restating the question. For example, with `ask=how do I create an API token`, a goal like `automate deployments from our CI pipeline` lets GitBook tailor the answer to that use case.
The response will contain a direct answer to the question and relevant excerpts and sources from the documentation.
Use this mechanism when the answer is not explicitly present in the current page, you need clarification or additional context, or you want to retrieve related documentation sections.