> For the complete documentation index, see [llms.txt](https://docs.inforiver.com/llms.txt). Markdown versions of documentation pages are available by appending `.md` to page URLs; this page is available as [Markdown](https://docs.inforiver.com/working-with-inforiver/4.-adding-business-logic-and-formulae/template-rows/template-rows-1.md).
# Template rows (Reporting Matrix)
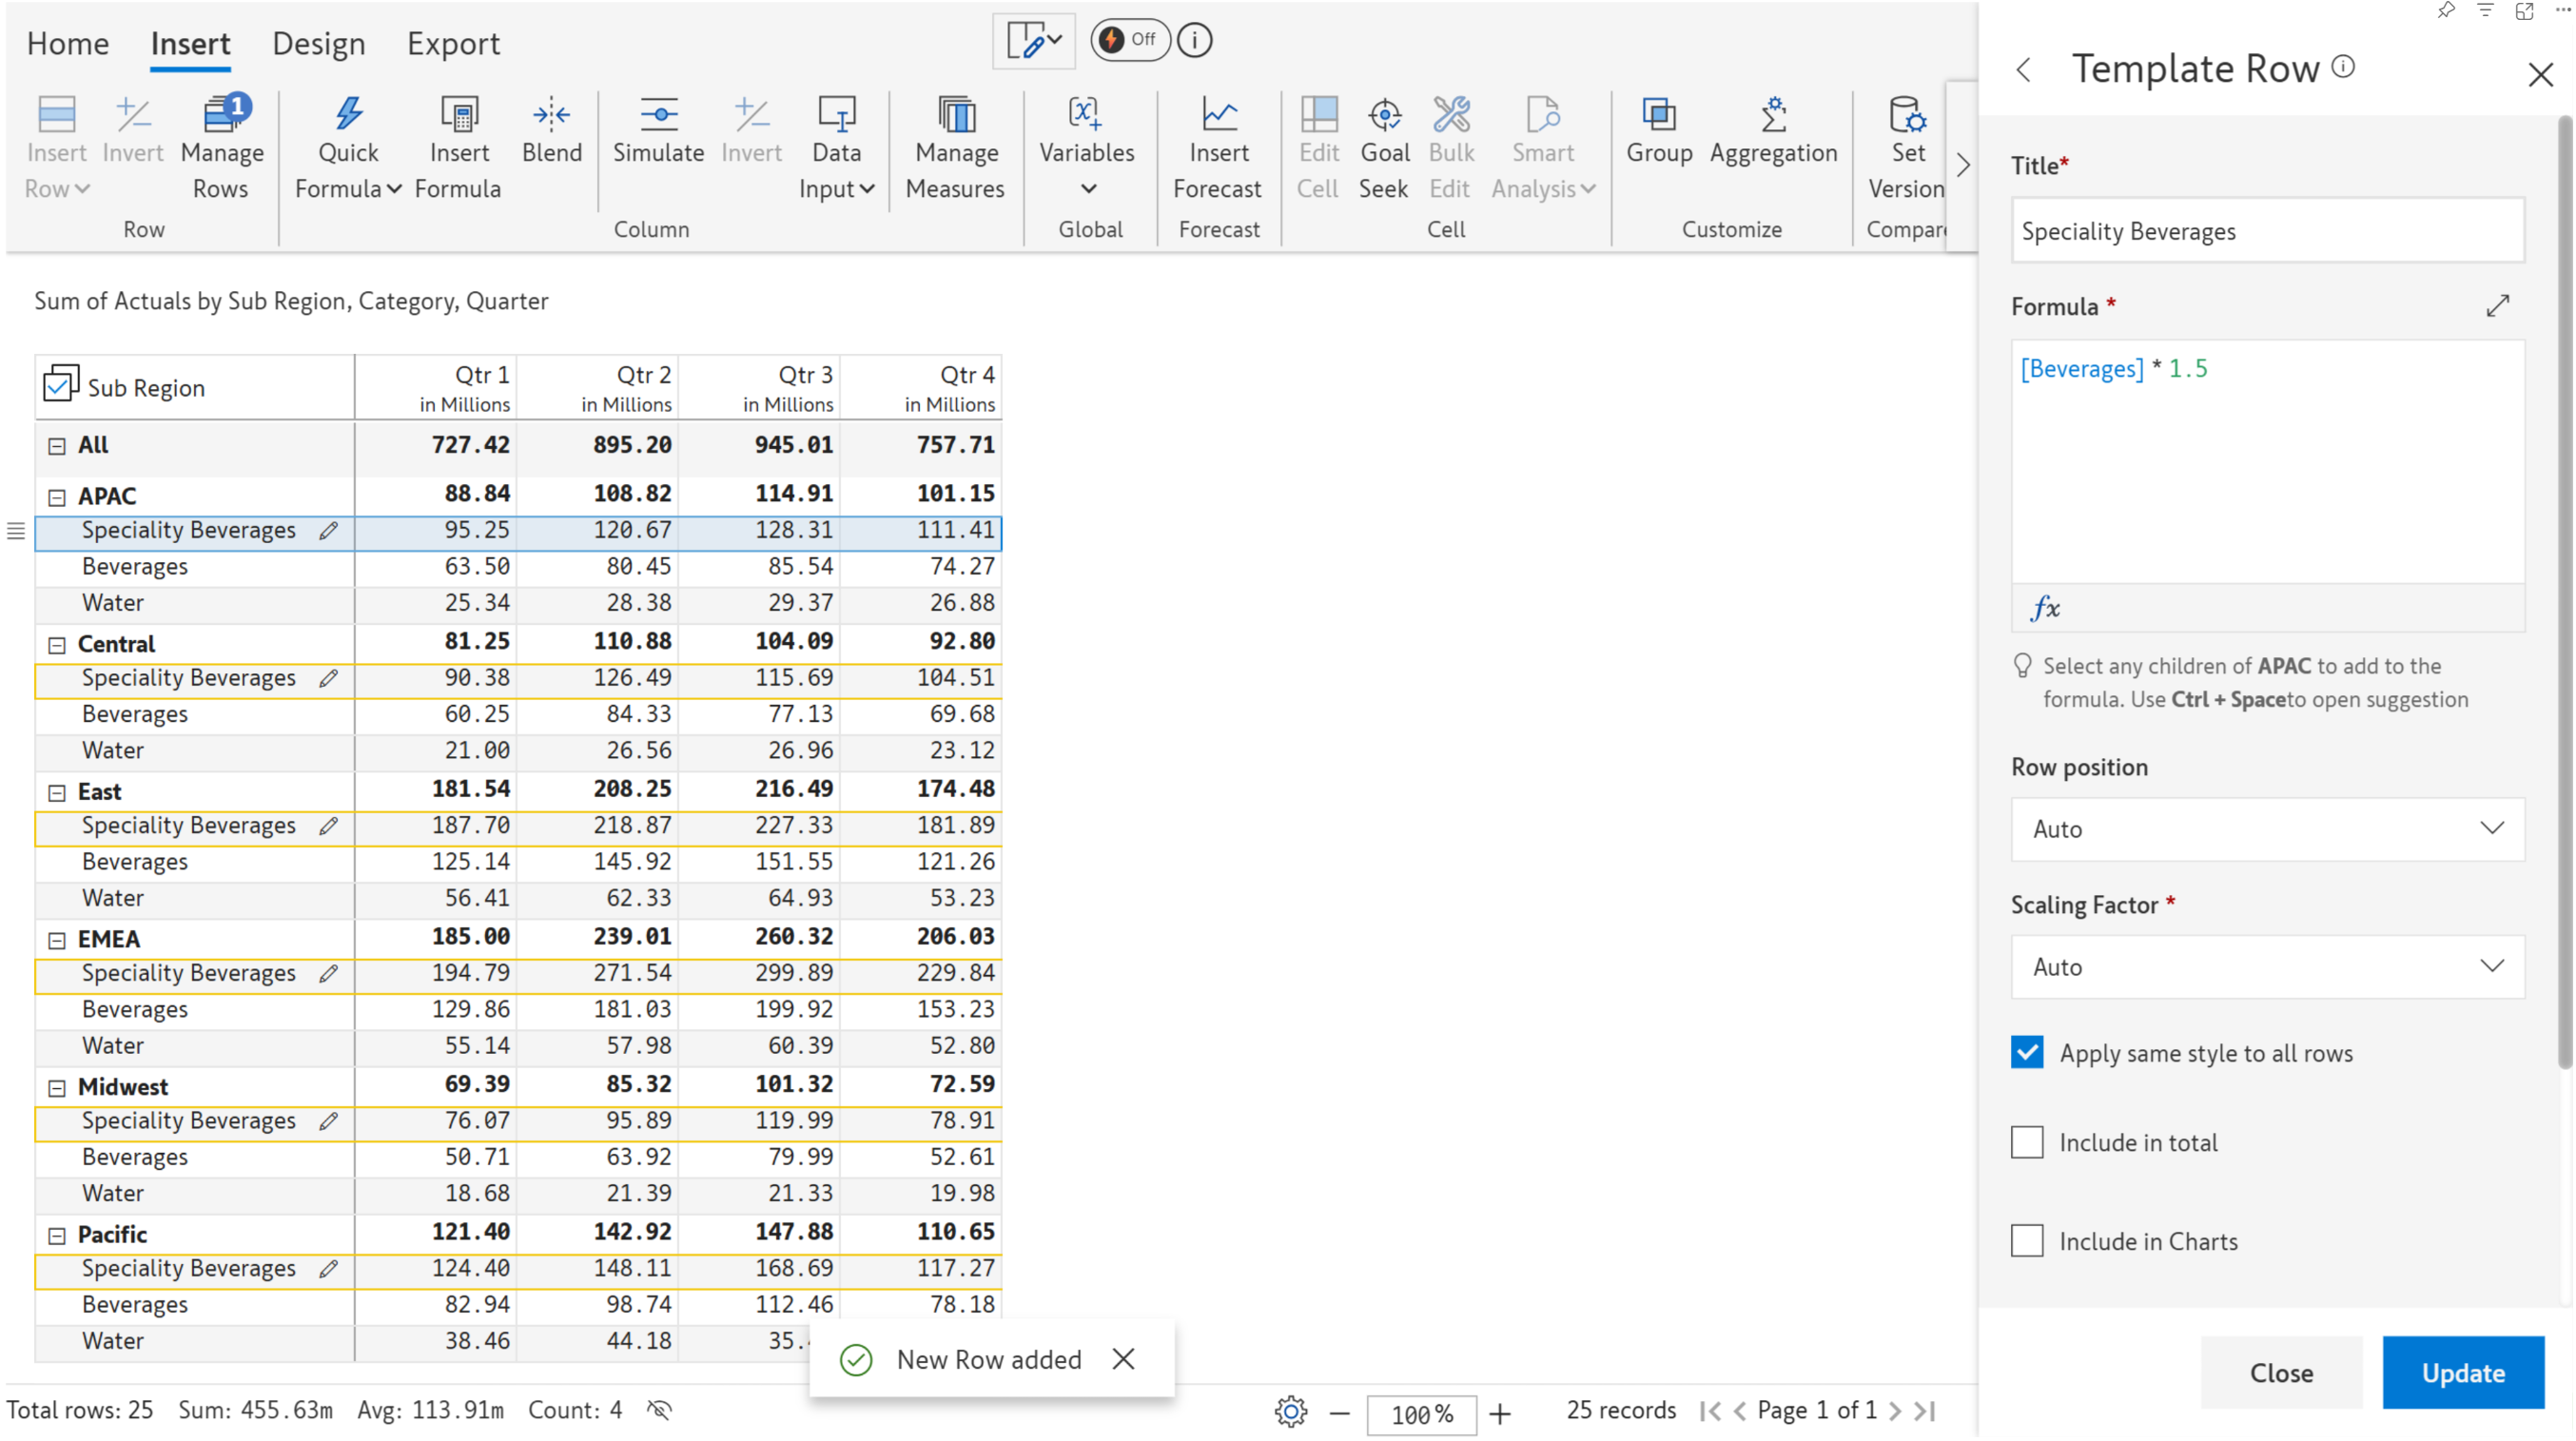
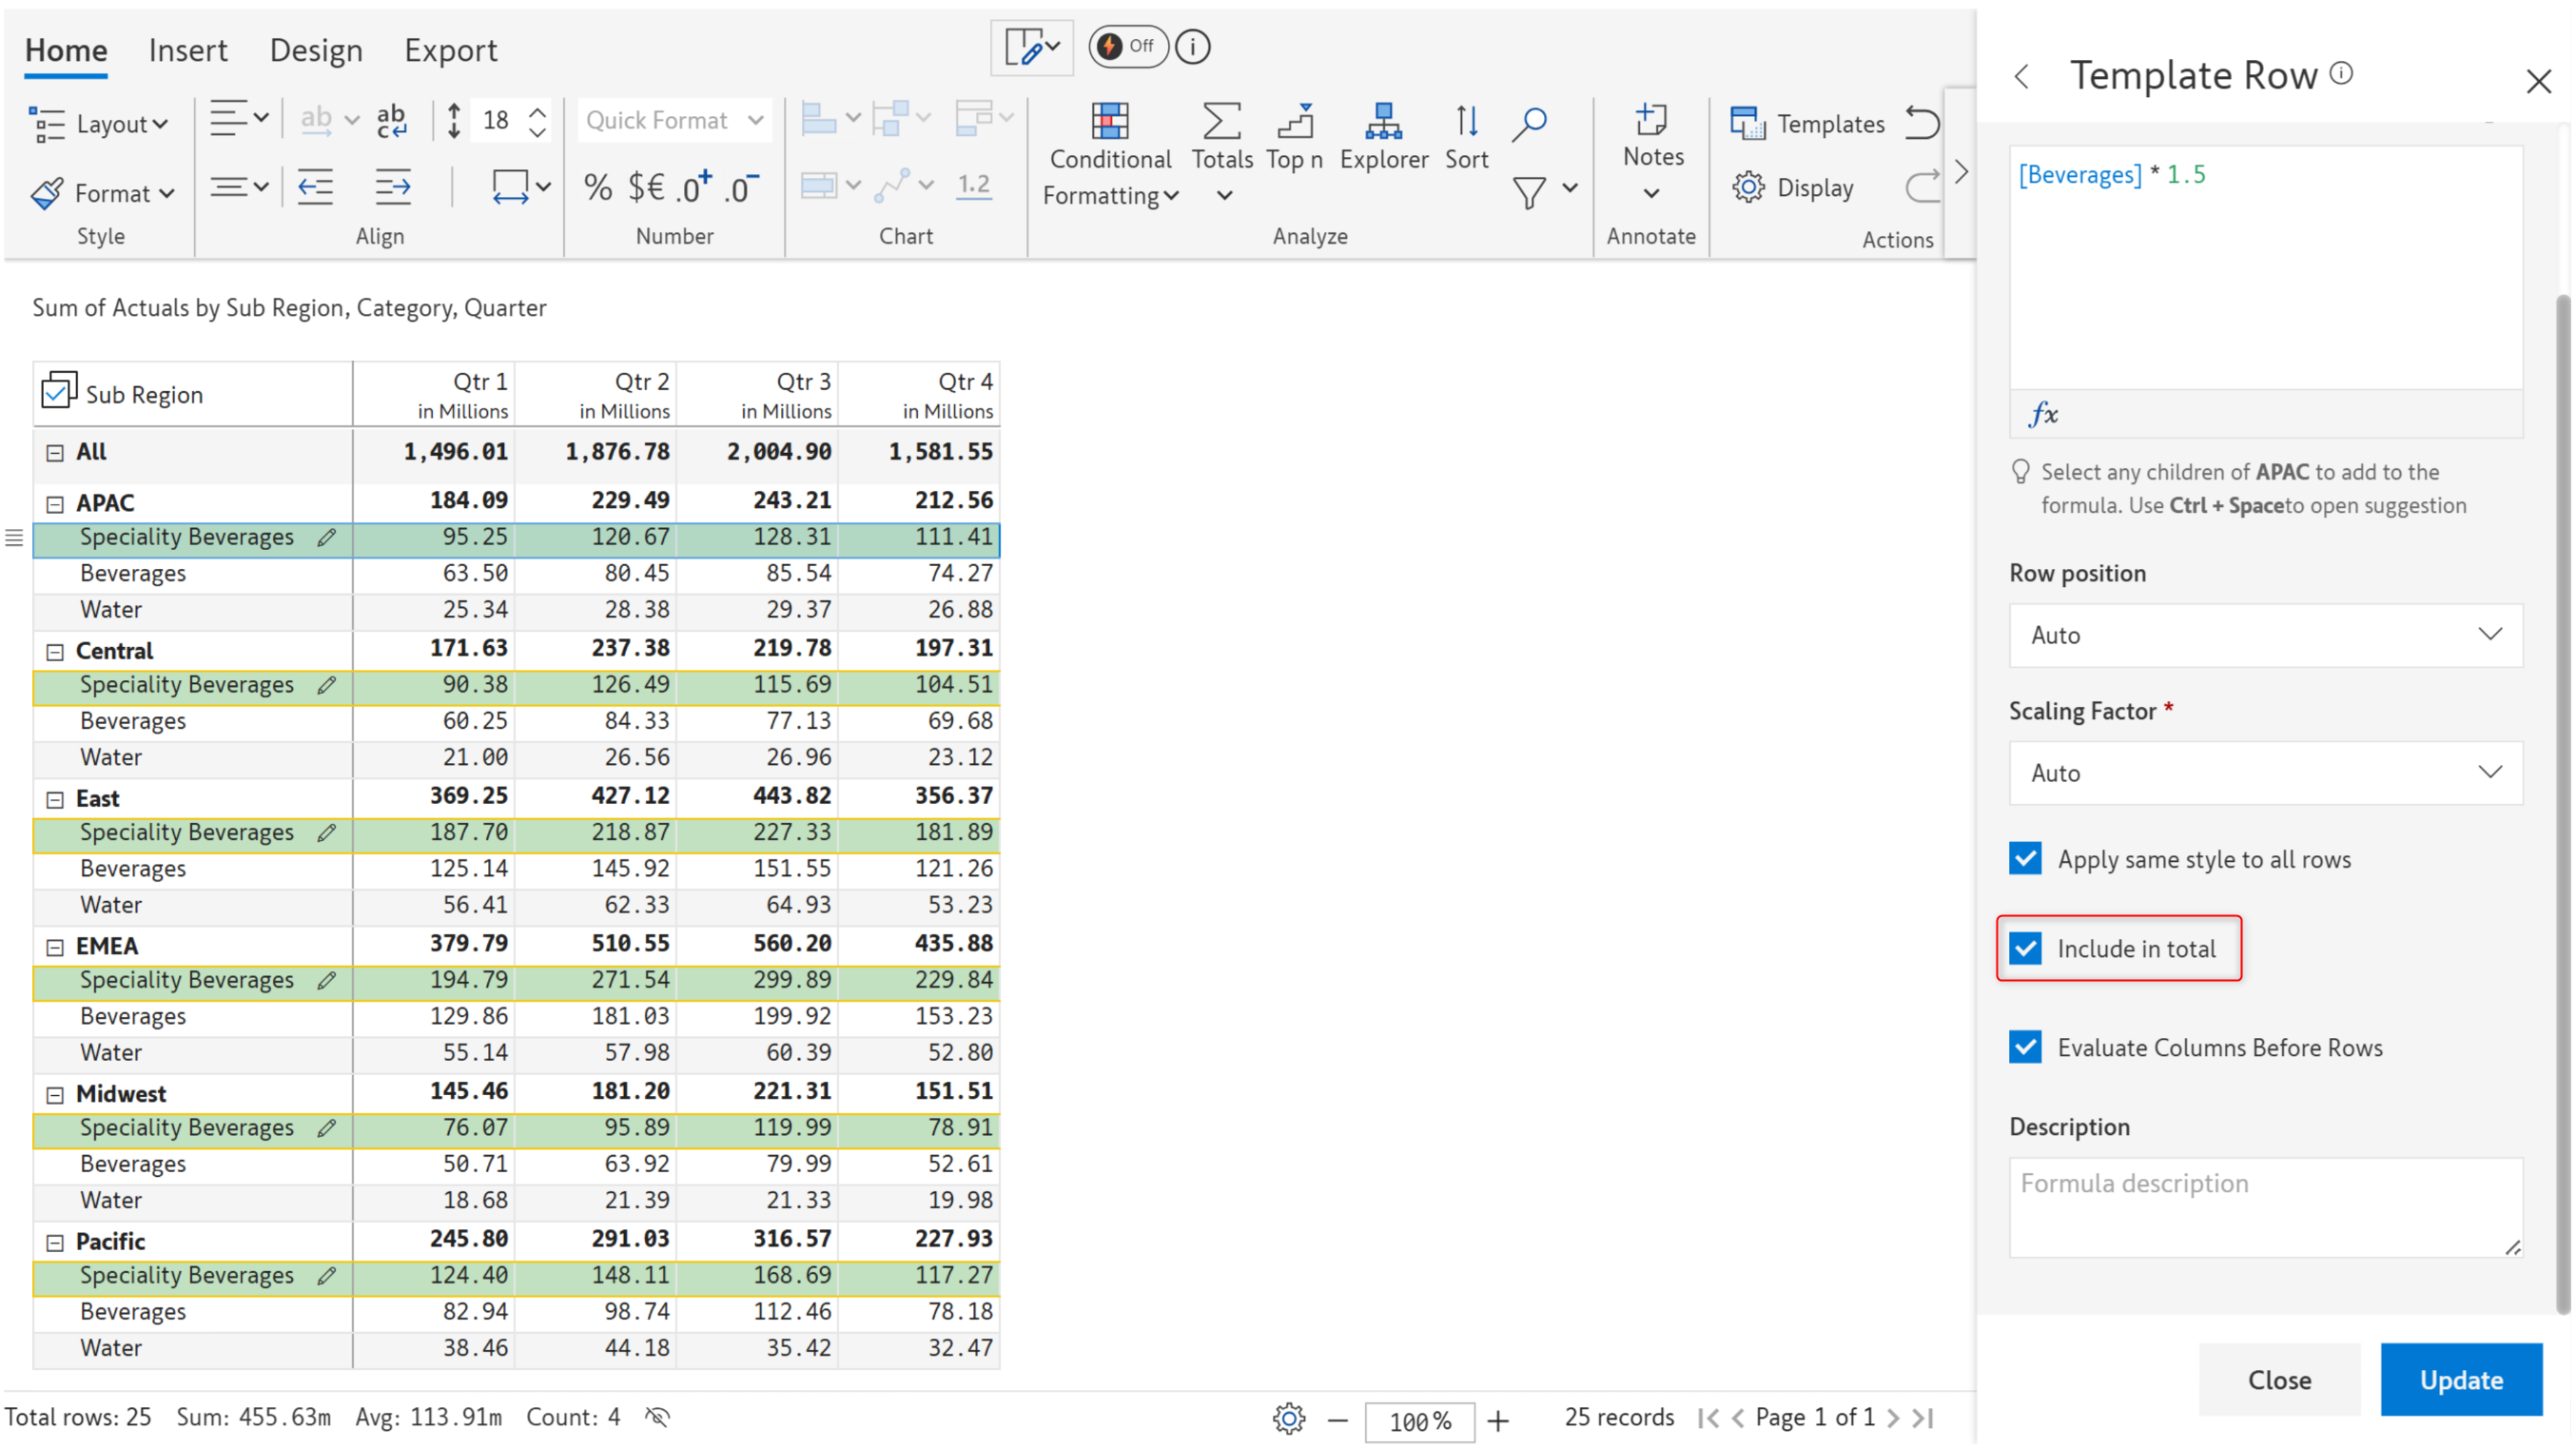
Let us take this example: Sales data by region and category. Let's insert a calculated row in each hierarchy that is 1.5 times the value of Beverages across quarters.
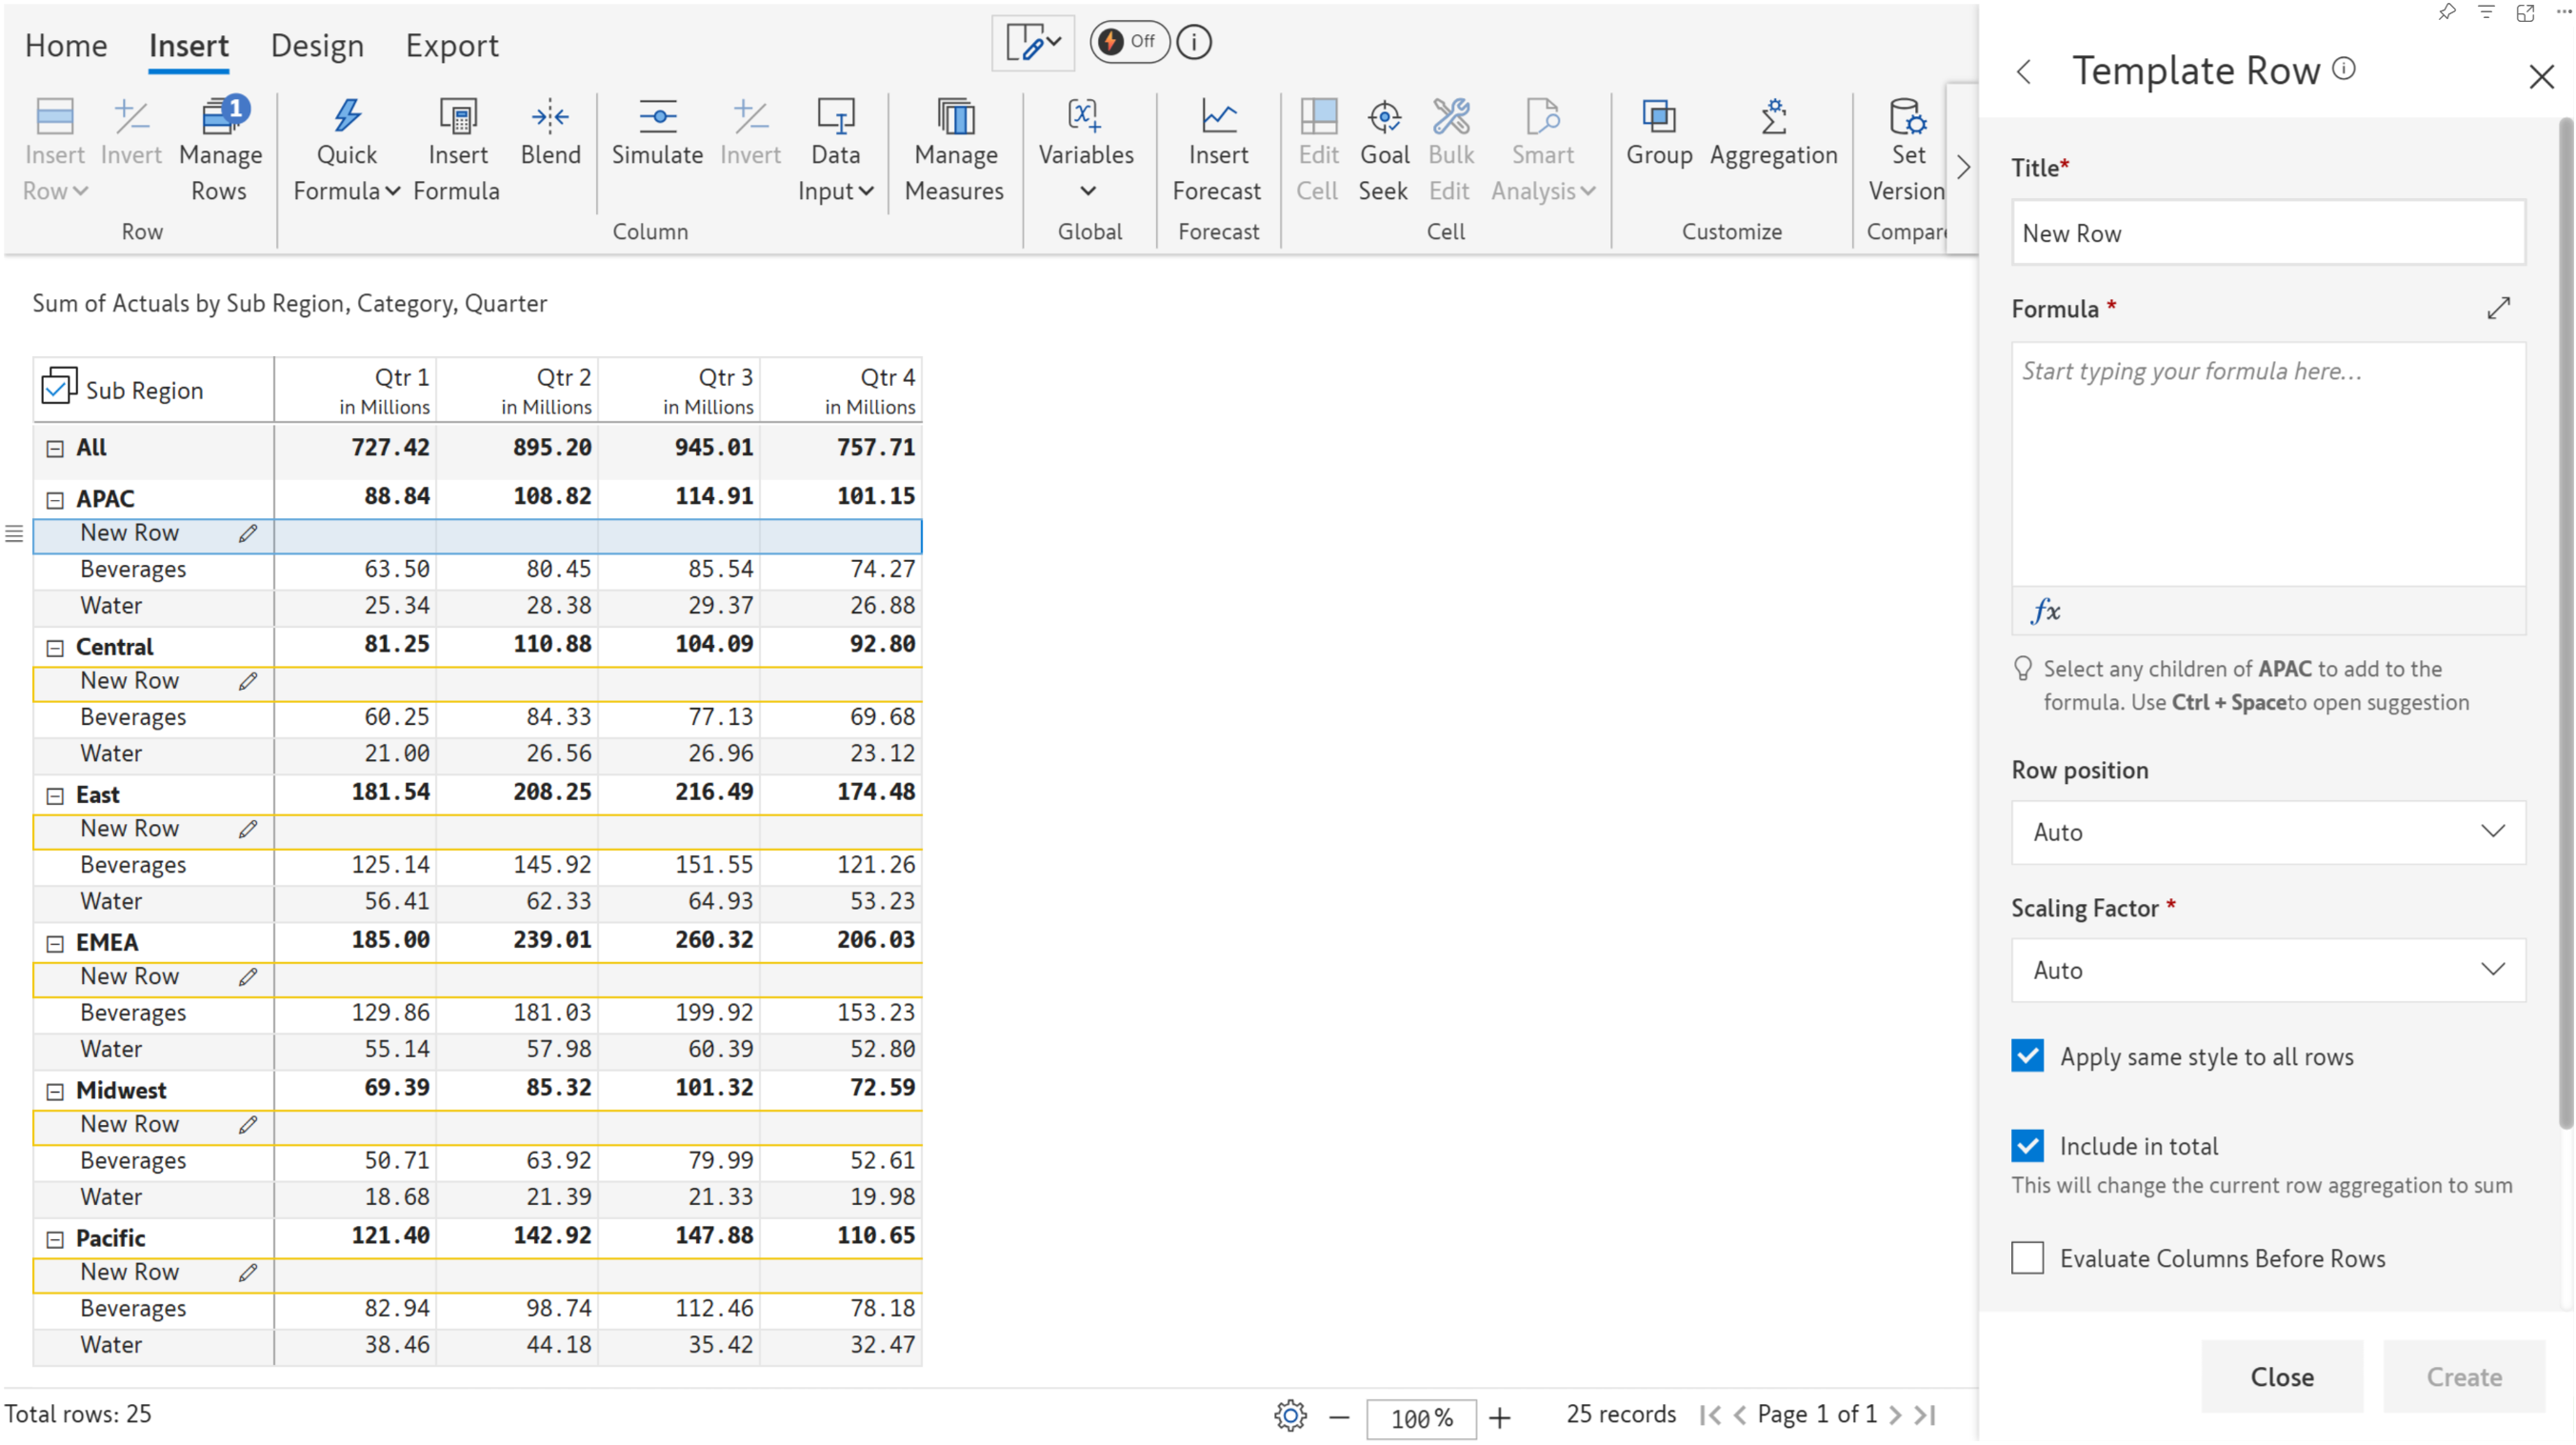
**STEP 1:** Create a template row by choosing the option from the Insert Row menu.
**STEP 2:** Enter the title and the desired formula in the editor. When you click Create, the row gets created across all levels of the hierarchy.
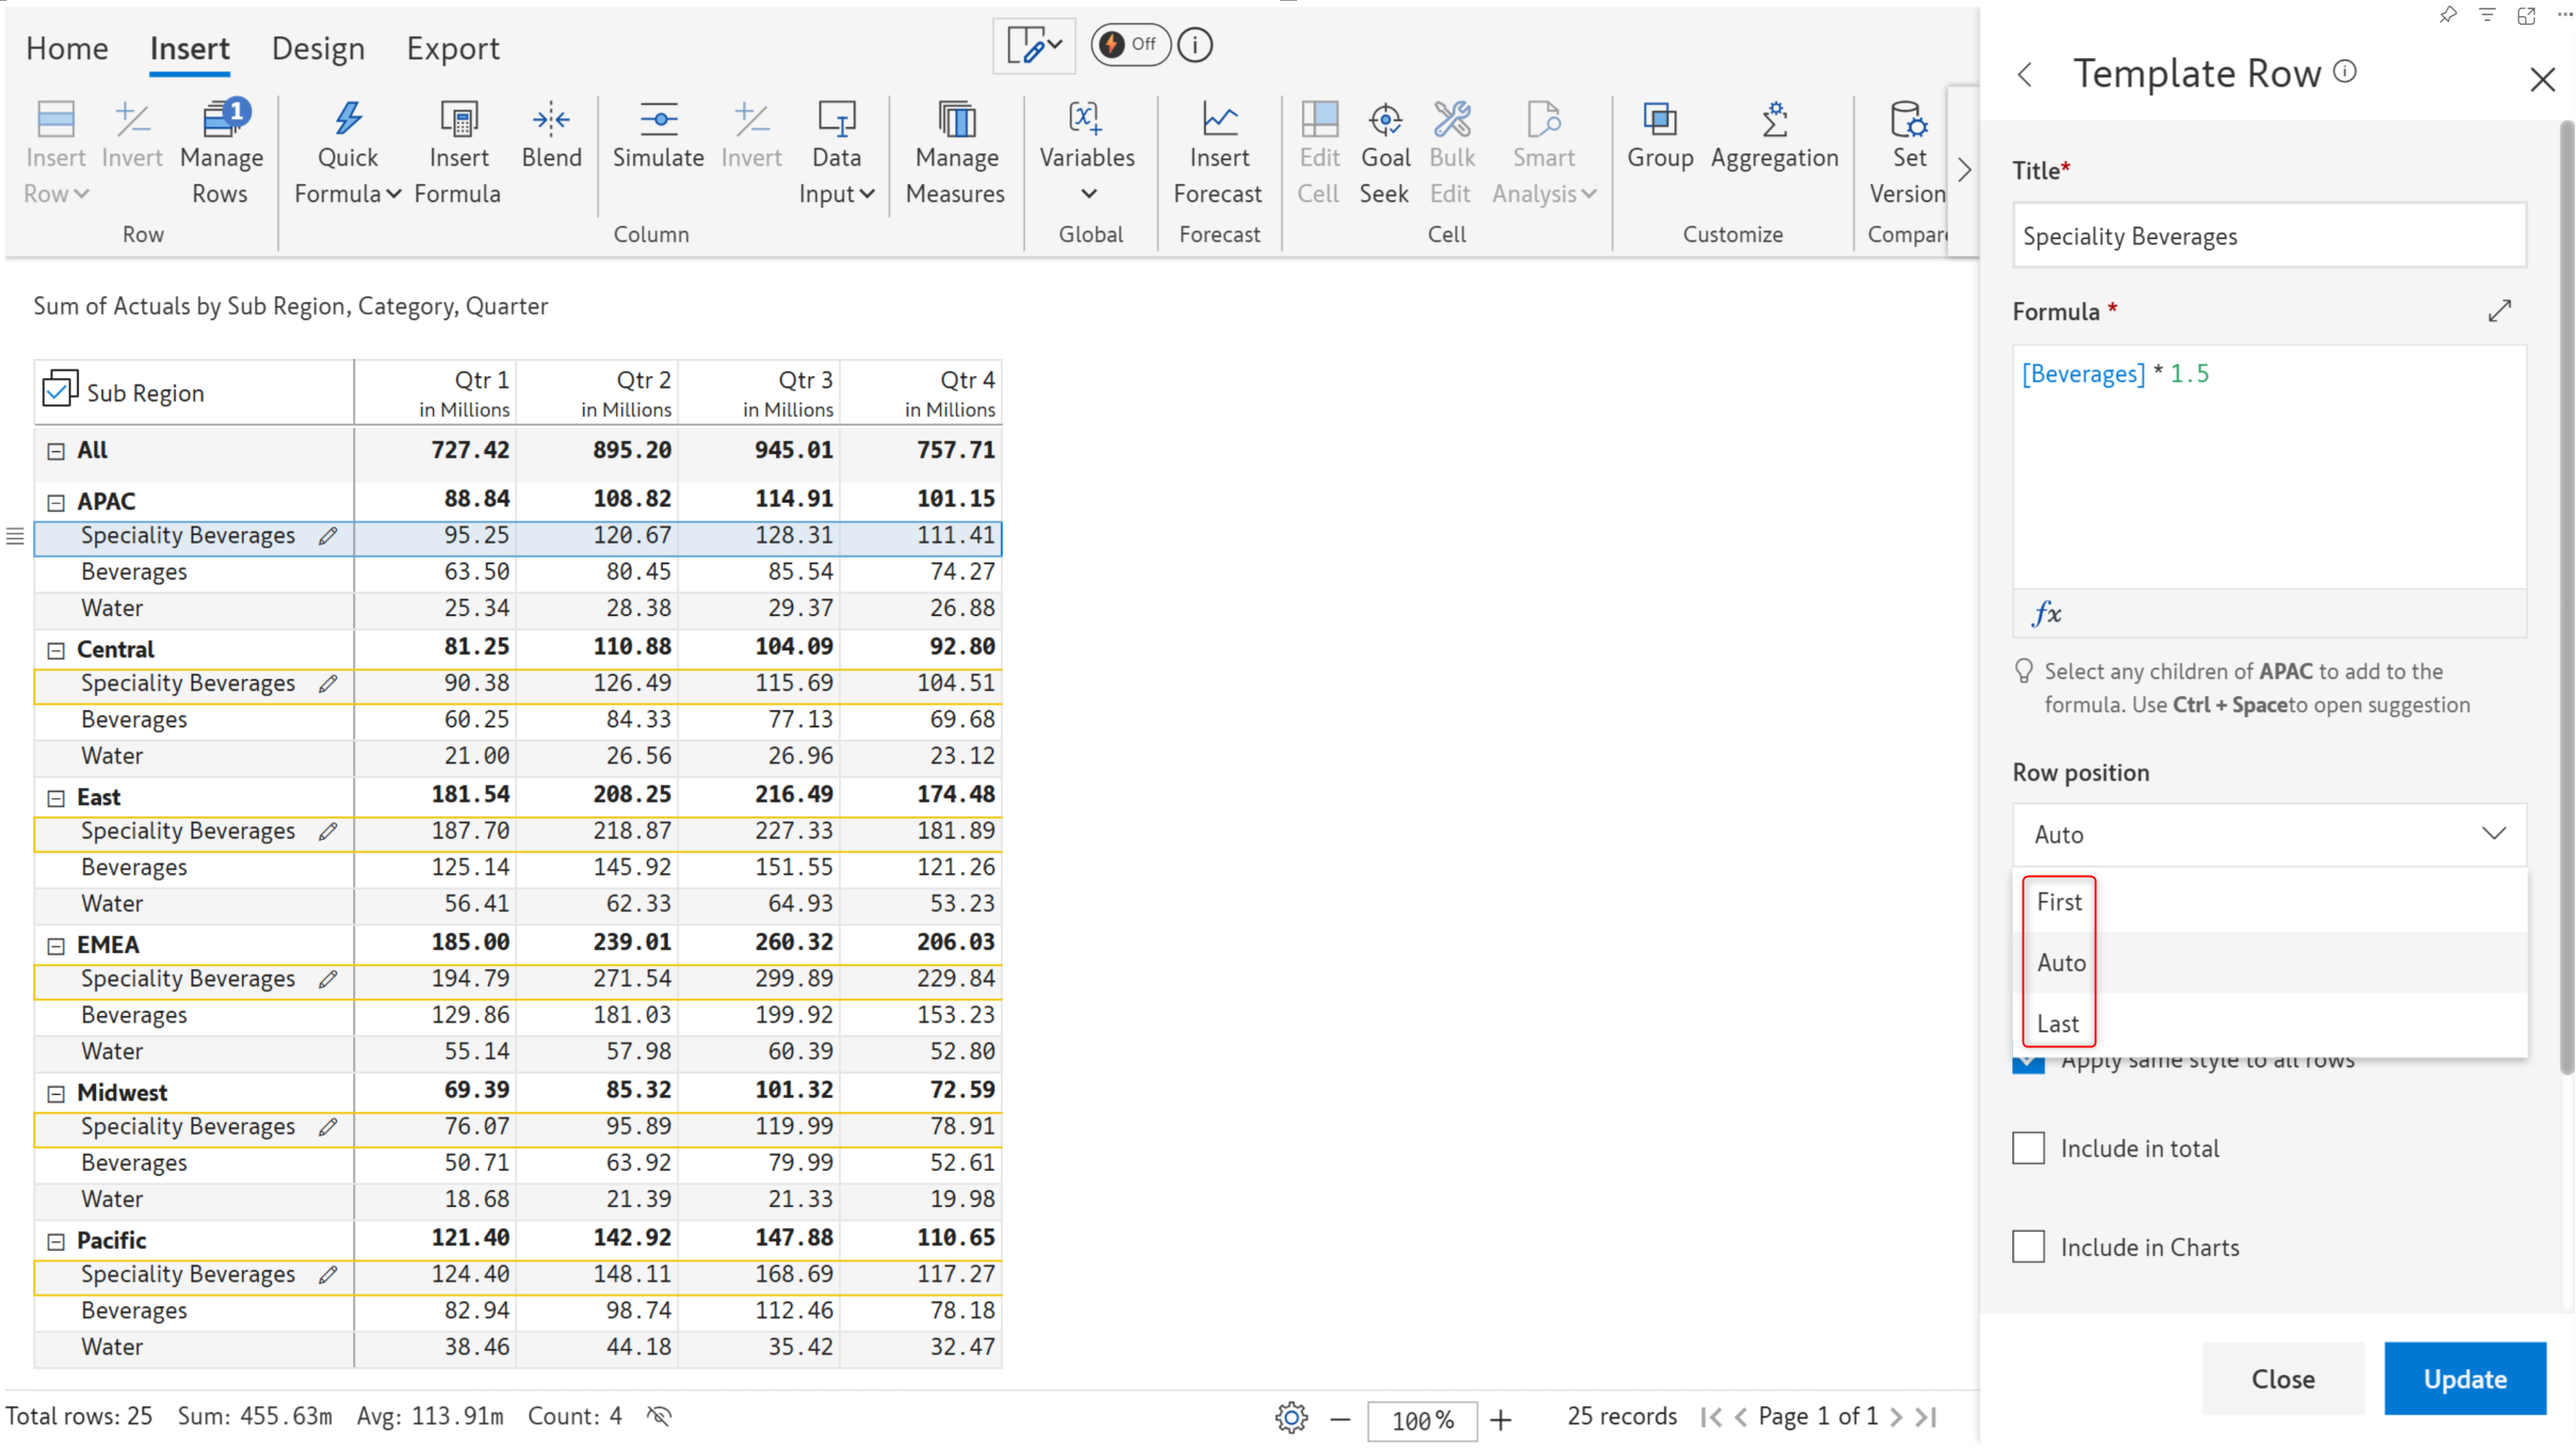
**STEP 3:** Set the row position to ‘First’, ‘Auto’, or ‘Last’ from the drop-down.
* First - the template row will be placed first at the category level, irrespective of where it is added
* Auto - the template row is placed above the selected row where it is added
* Last - the template row is placed last at the category level, irrespective of where it is added
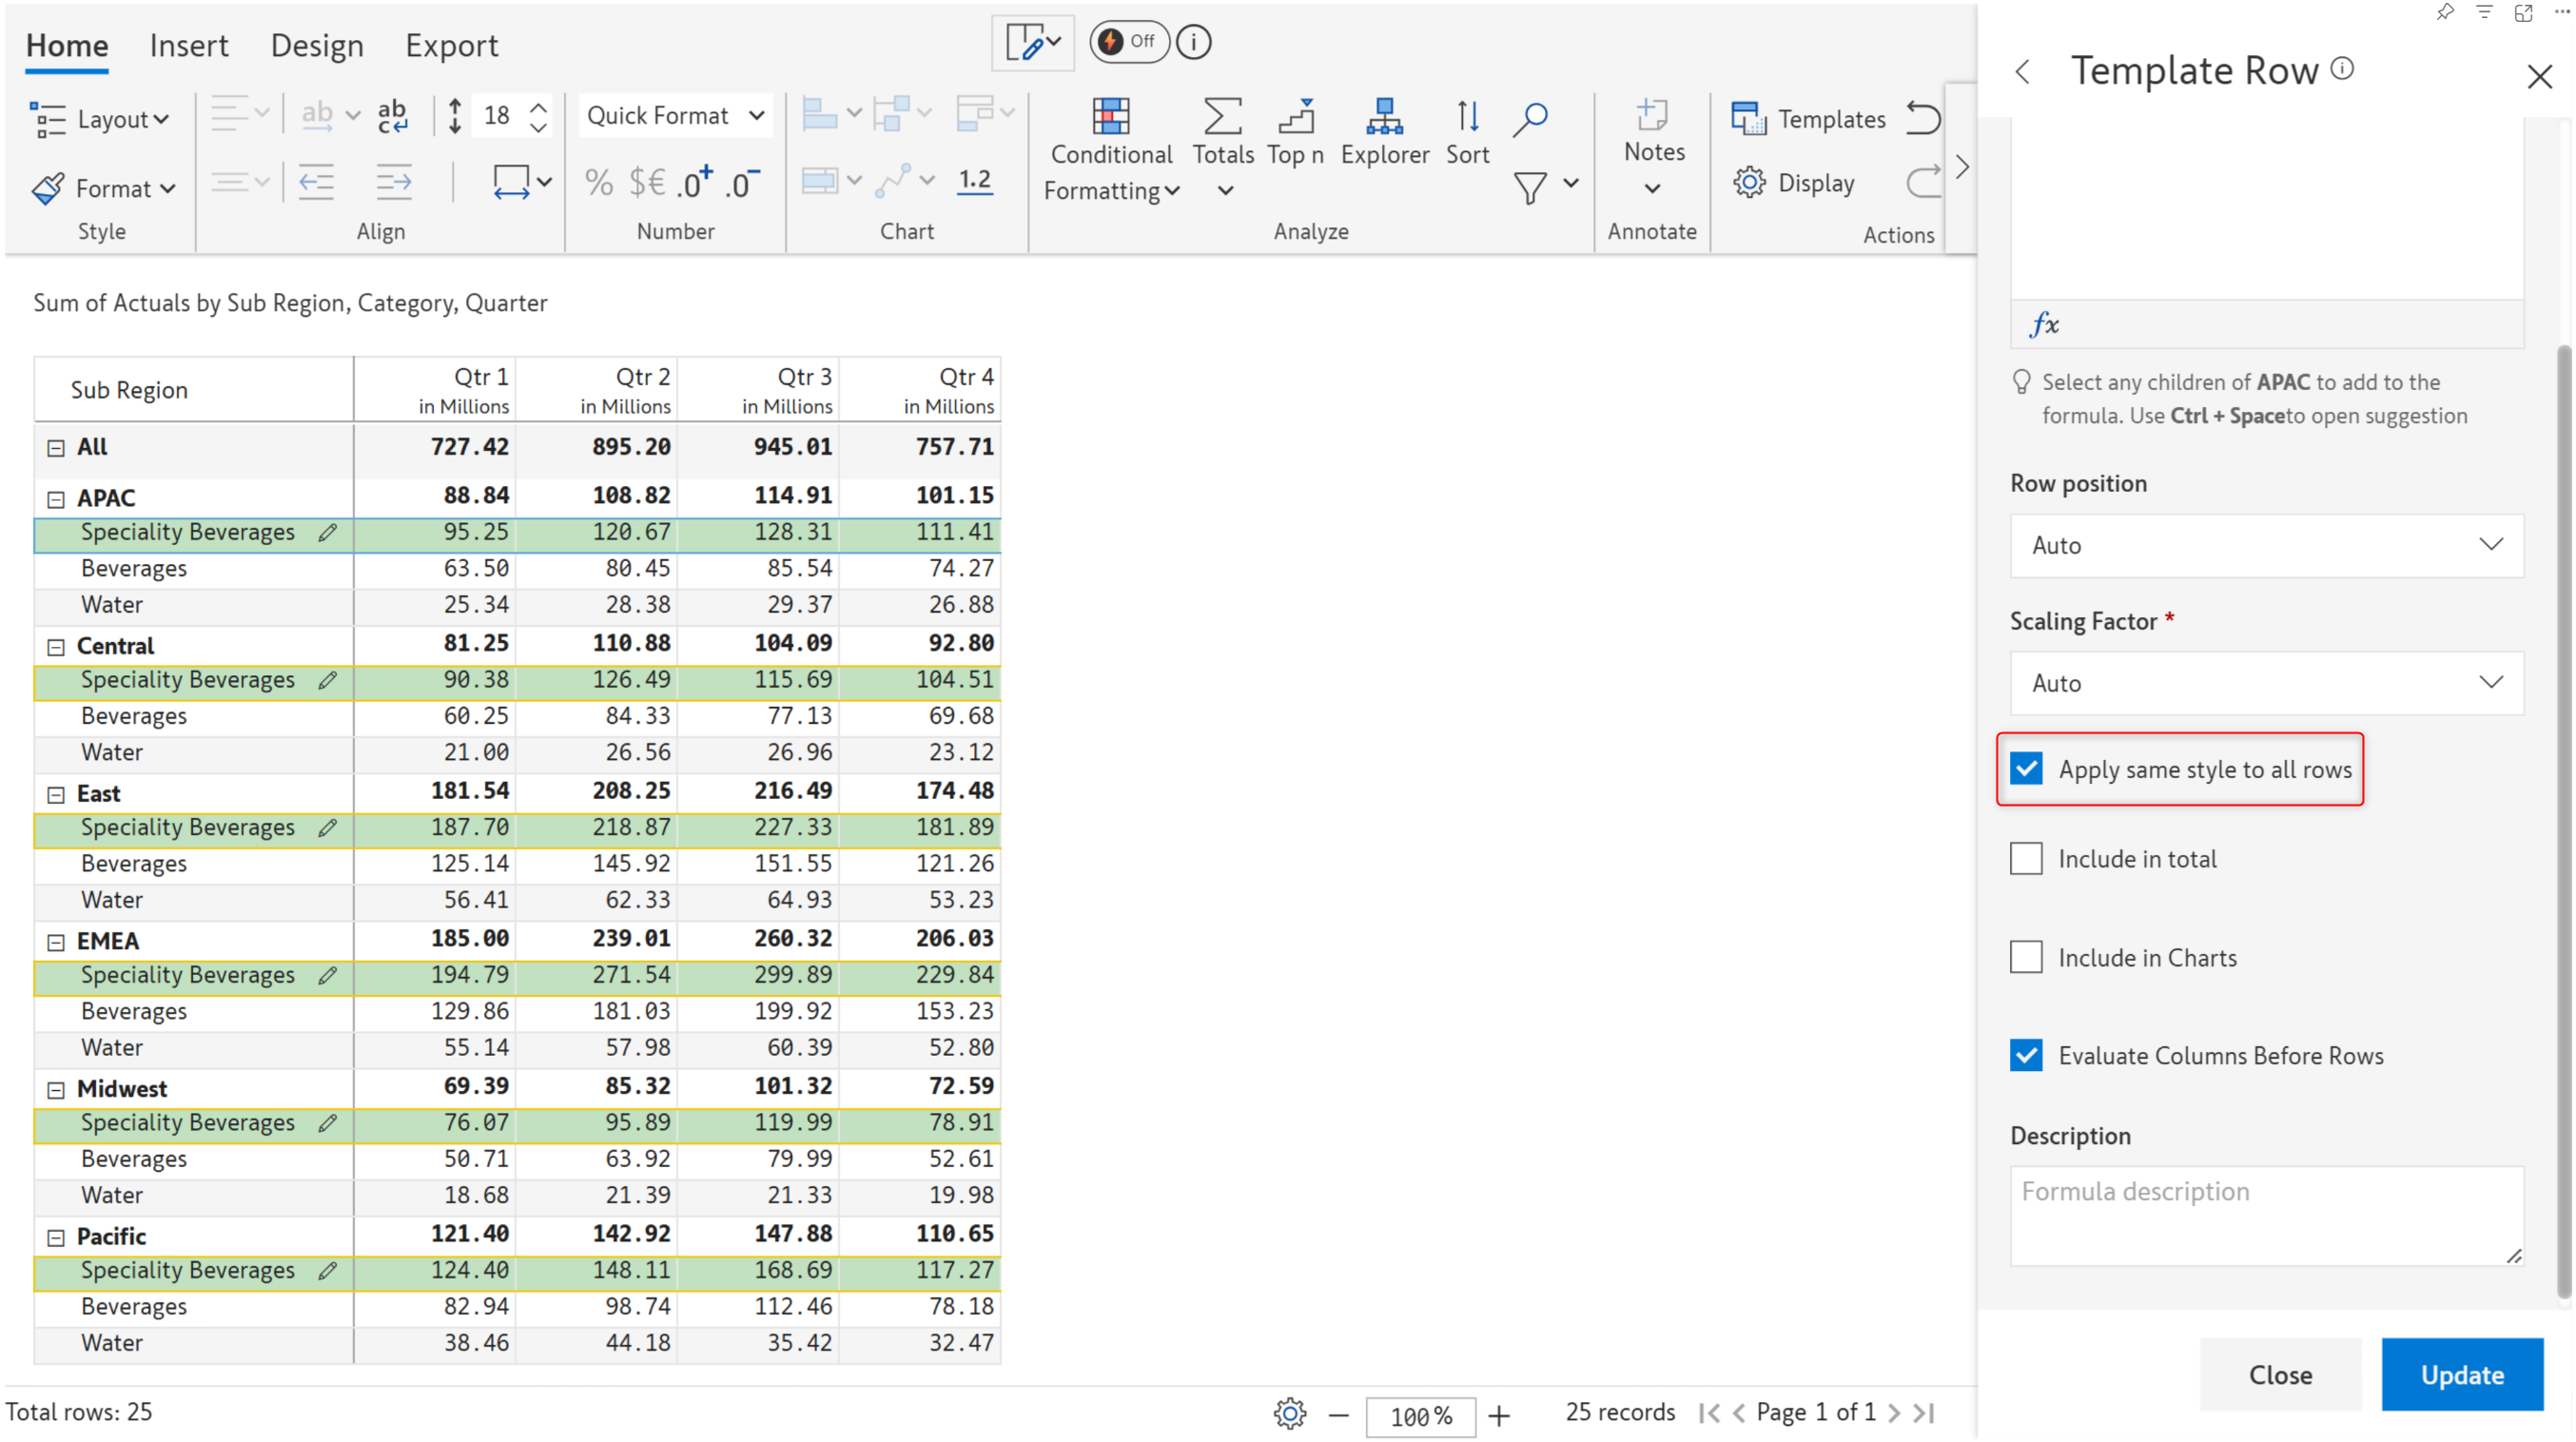
**STEP 4:** Select the **Apply the same style to all rows** checkbox if you want to replicate the same formatting to all the template rows. For example, let's apply a background color to the row.
**STEP 5:** To include the row value in subtotals and totals, check the 'Include in total' check box.
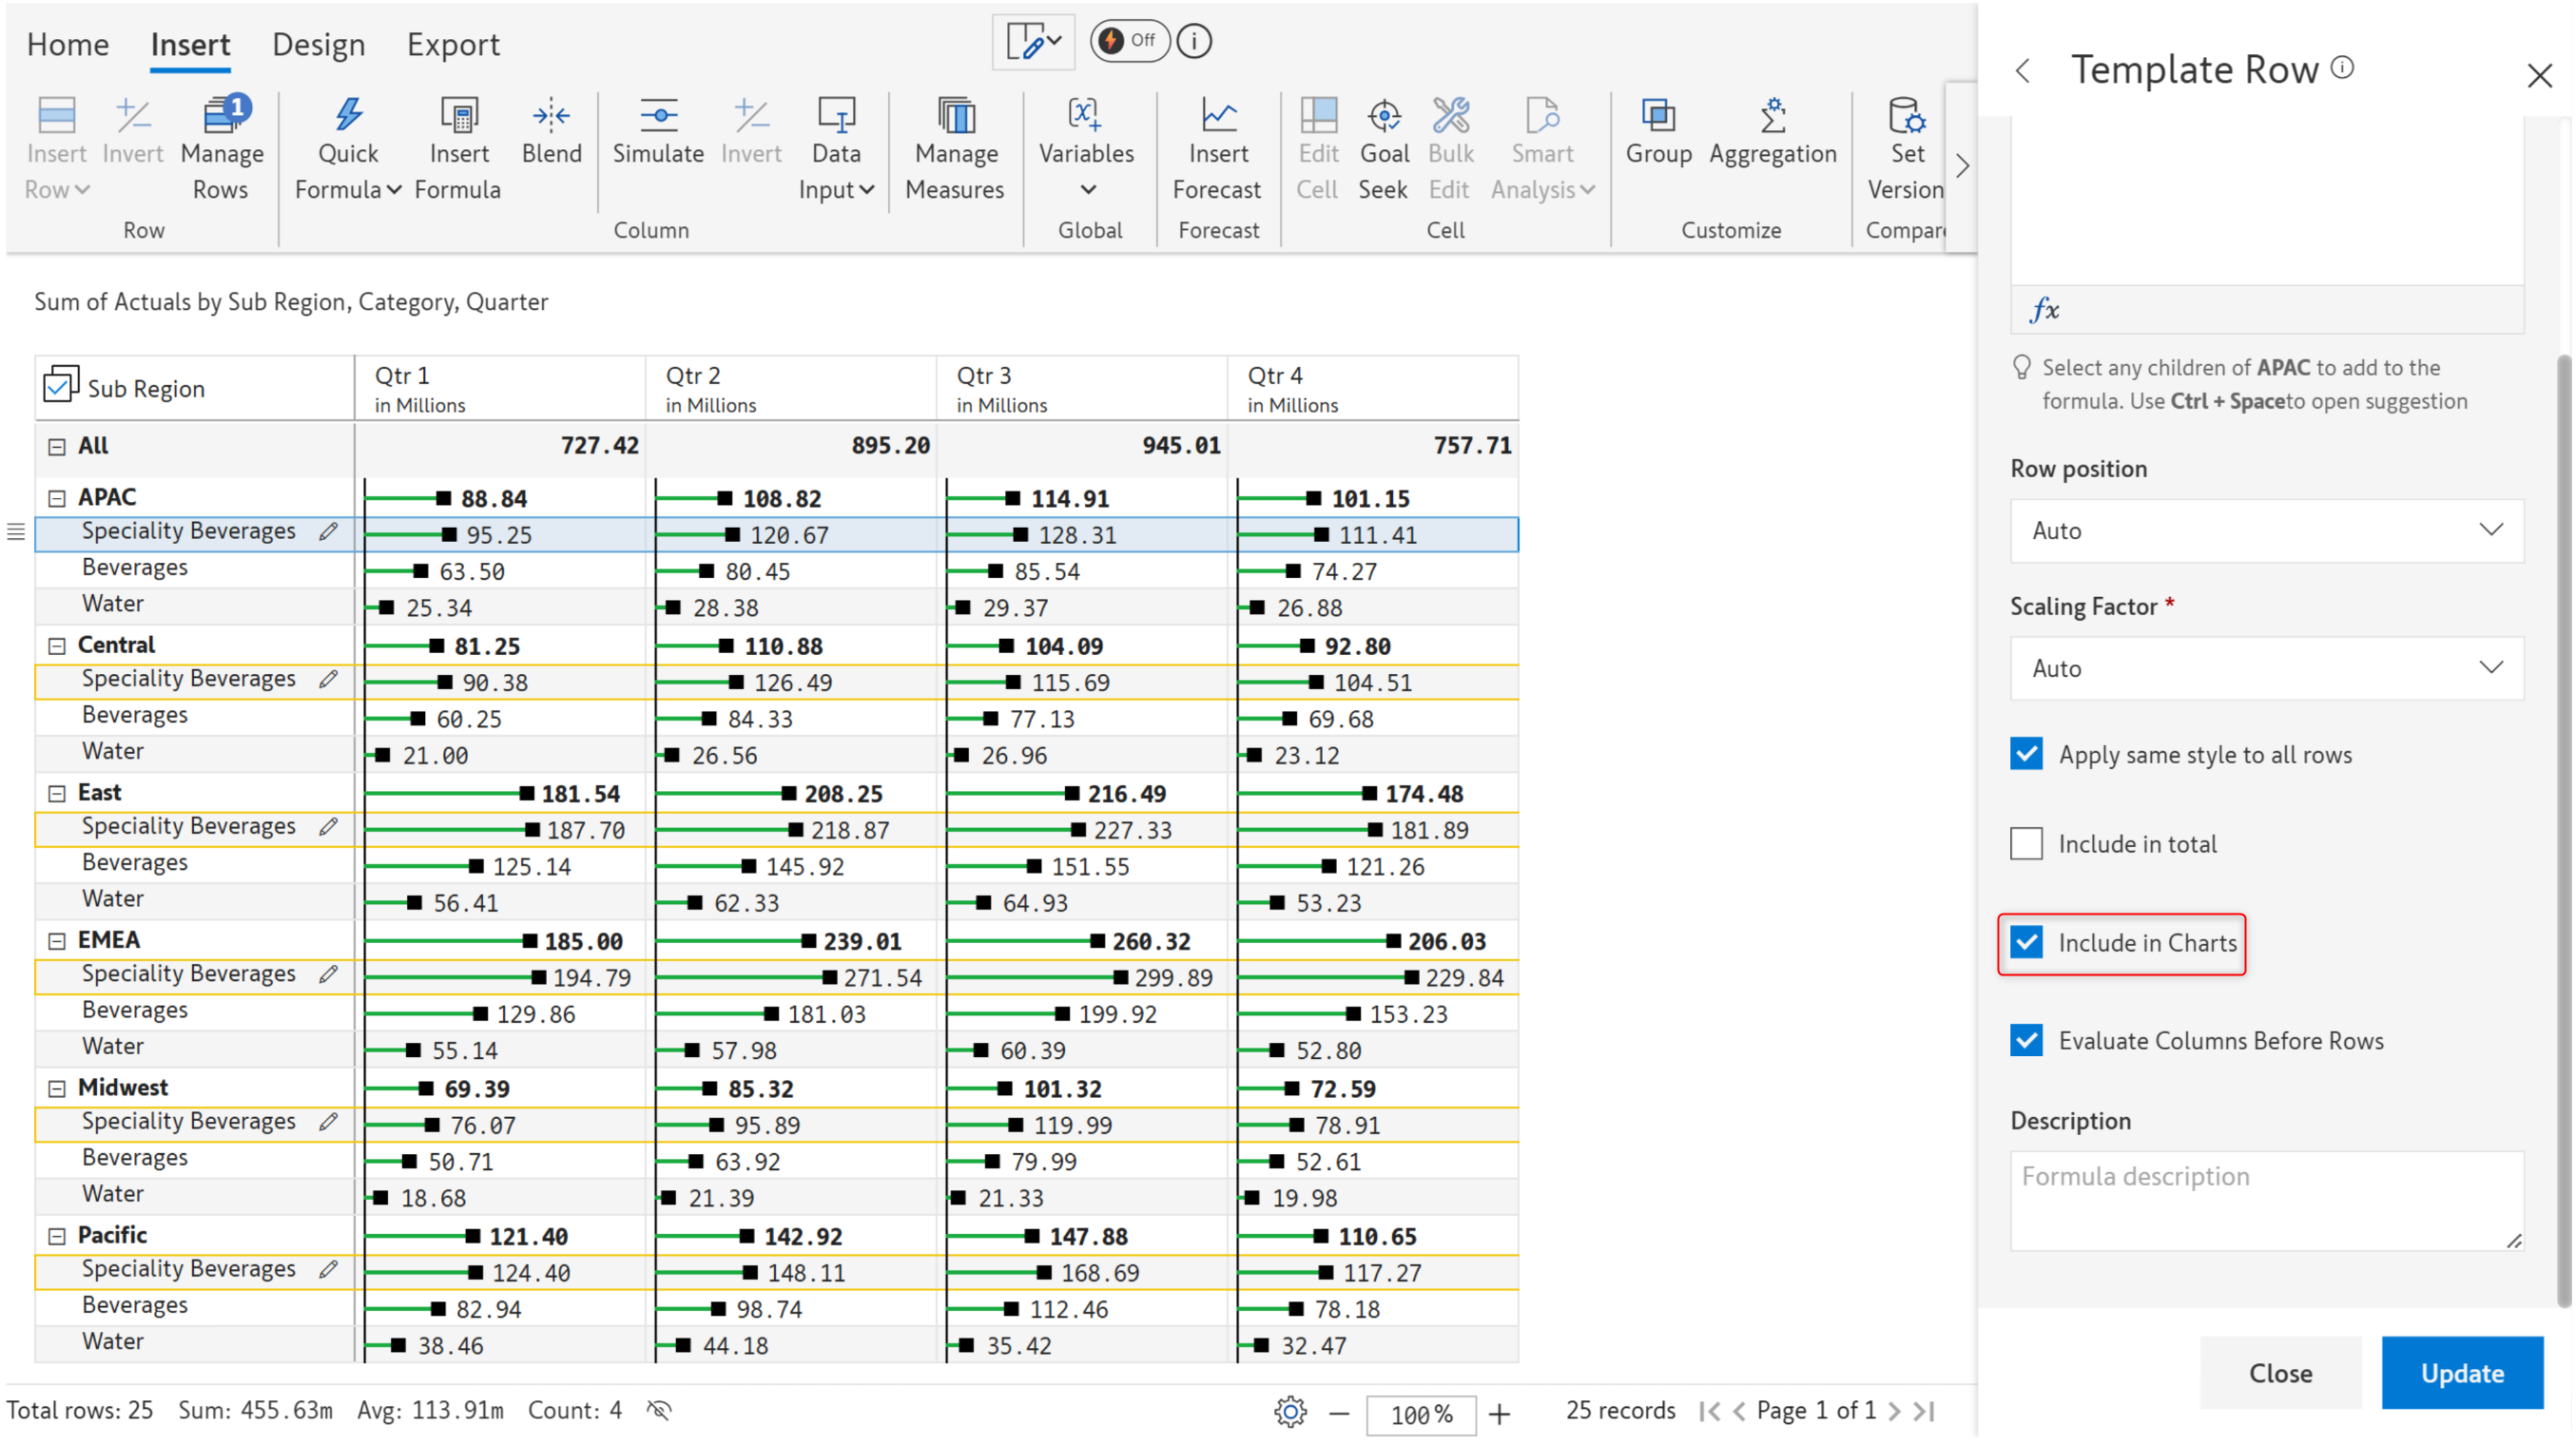
**STEP 6:** If charts are added to the table, the **Include in charts** option allows you to visualize the calculated rows as well using charts.
{% hint style="info" %}
The 'Include in charts' checkbox is enabled only when the 'Include in total' option is unchecked.
{% endhint %}
**STEP 7:** If the 'Evaluate columns before rows' checkbox is enabled, the defined formula is used for calculating the column totals. If this check box is disabled, then sum aggregation is followed for the column totals. To learn more, refer [Evaluate columns before rows](https://inforiver.gitbook.io/inforiver/working-with-inforiver/4.-adding-business-logic-and-formulae/insert-calculated-rows#4.-evaluate-column-before-rows)
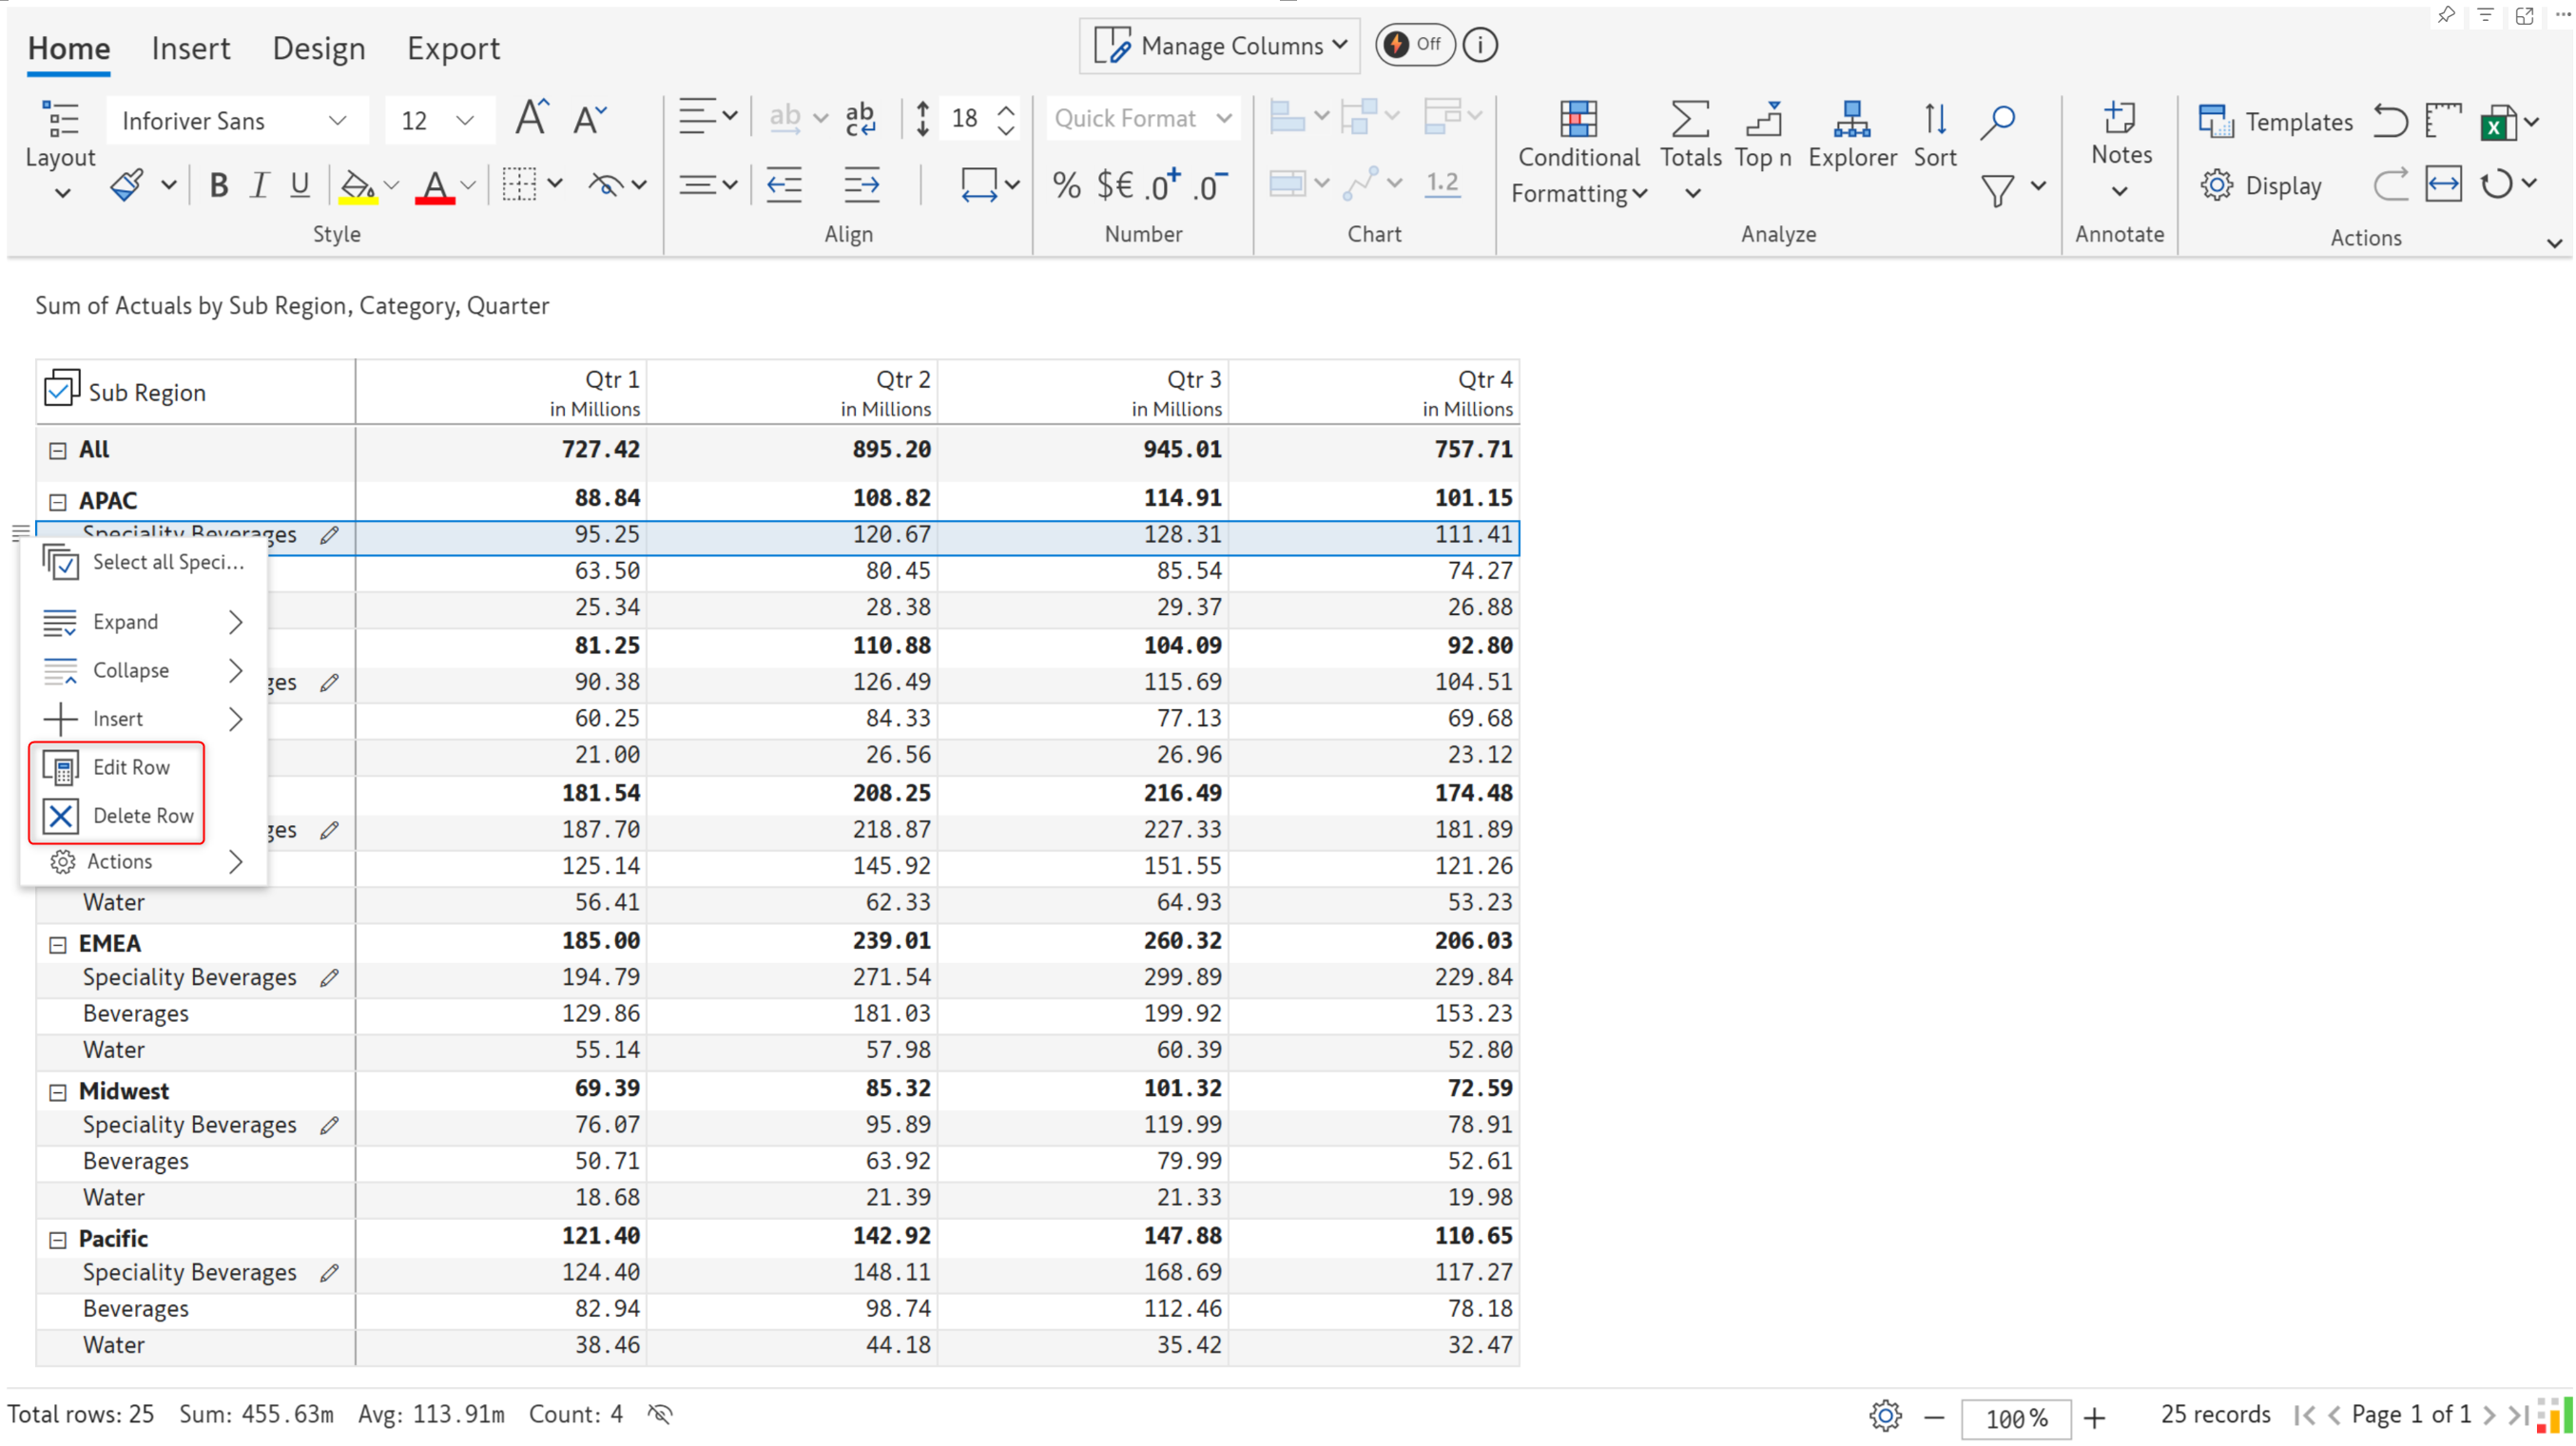
**STEP 8:** Edit/delete the inserted template row by clicking on the row gripper of the selected template row and choosing the respective option from the drop-down.
---
# Agent Instructions
This documentation is published with GitBook. GitBook is the documentation platform designed so that both humans and AI agents can read, navigate, and reason over technical content effectively. Learn more at gitbook.com.
## Querying This Documentation
If you need additional information that is not directly available in this page, you can query the documentation by asking a question.
Perform an HTTP GET request on the following URL with the `ask` and `goal` query parameters:
```
GET https://docs.inforiver.com/working-with-inforiver/4.-adding-business-logic-and-formulae/template-rows/template-rows-1.md?ask=&goal=
```
`ask` is the immediate question: it should be specific, self-contained, and written in natural language.
`goal` is what the user is ultimately trying to achieve, the reason they need the answer. Sharing it helps GitBook give you a better, more relevant answer. A goal is most helpful when it describes the outcome the user wants rather than restating the question. For example, with `ask=how do I create an API token`, a goal like `automate deployments from our CI pipeline` lets GitBook tailor the answer to that use case.
The response will contain a direct answer to the question and relevant excerpts and sources from the documentation.
Use this mechanism when the answer is not explicitly present in the current page, you need clarification or additional context, or you want to retrieve related documentation sections.