
Classification
Inforiver provides data classification based on text, icons and ratings.
Refer to create rule to get started. Once the rule is created and you can see the Conditional Formatting side panel, follow the below steps.
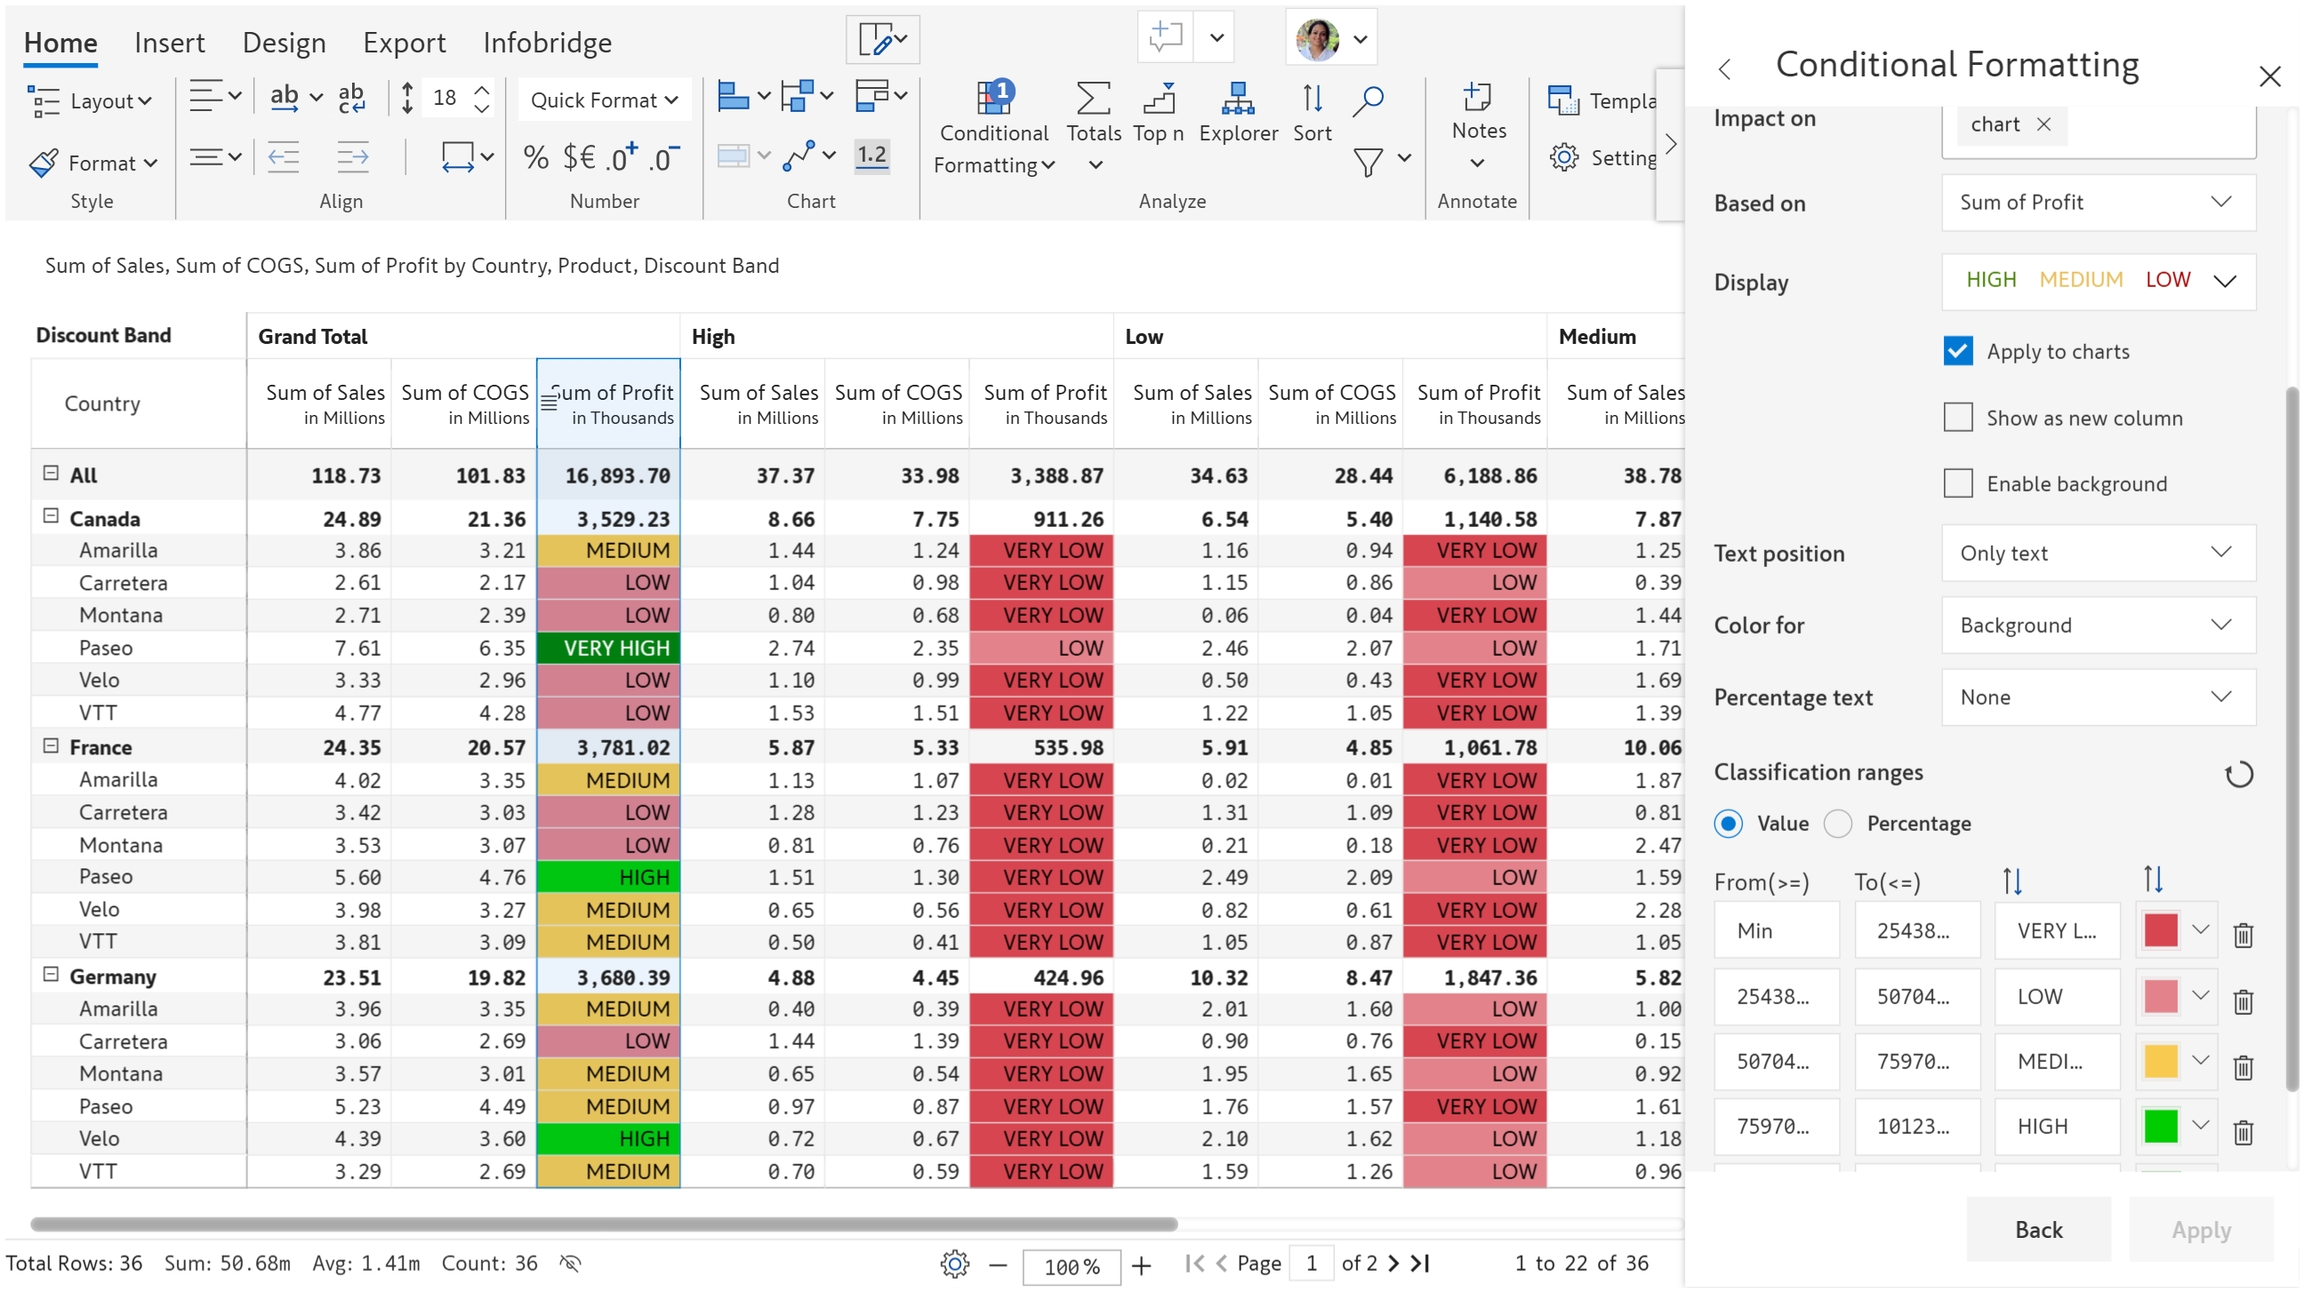
Choose 'Classification' in the 'Format by' dropdown. There are several options enabled as shown in the below image.
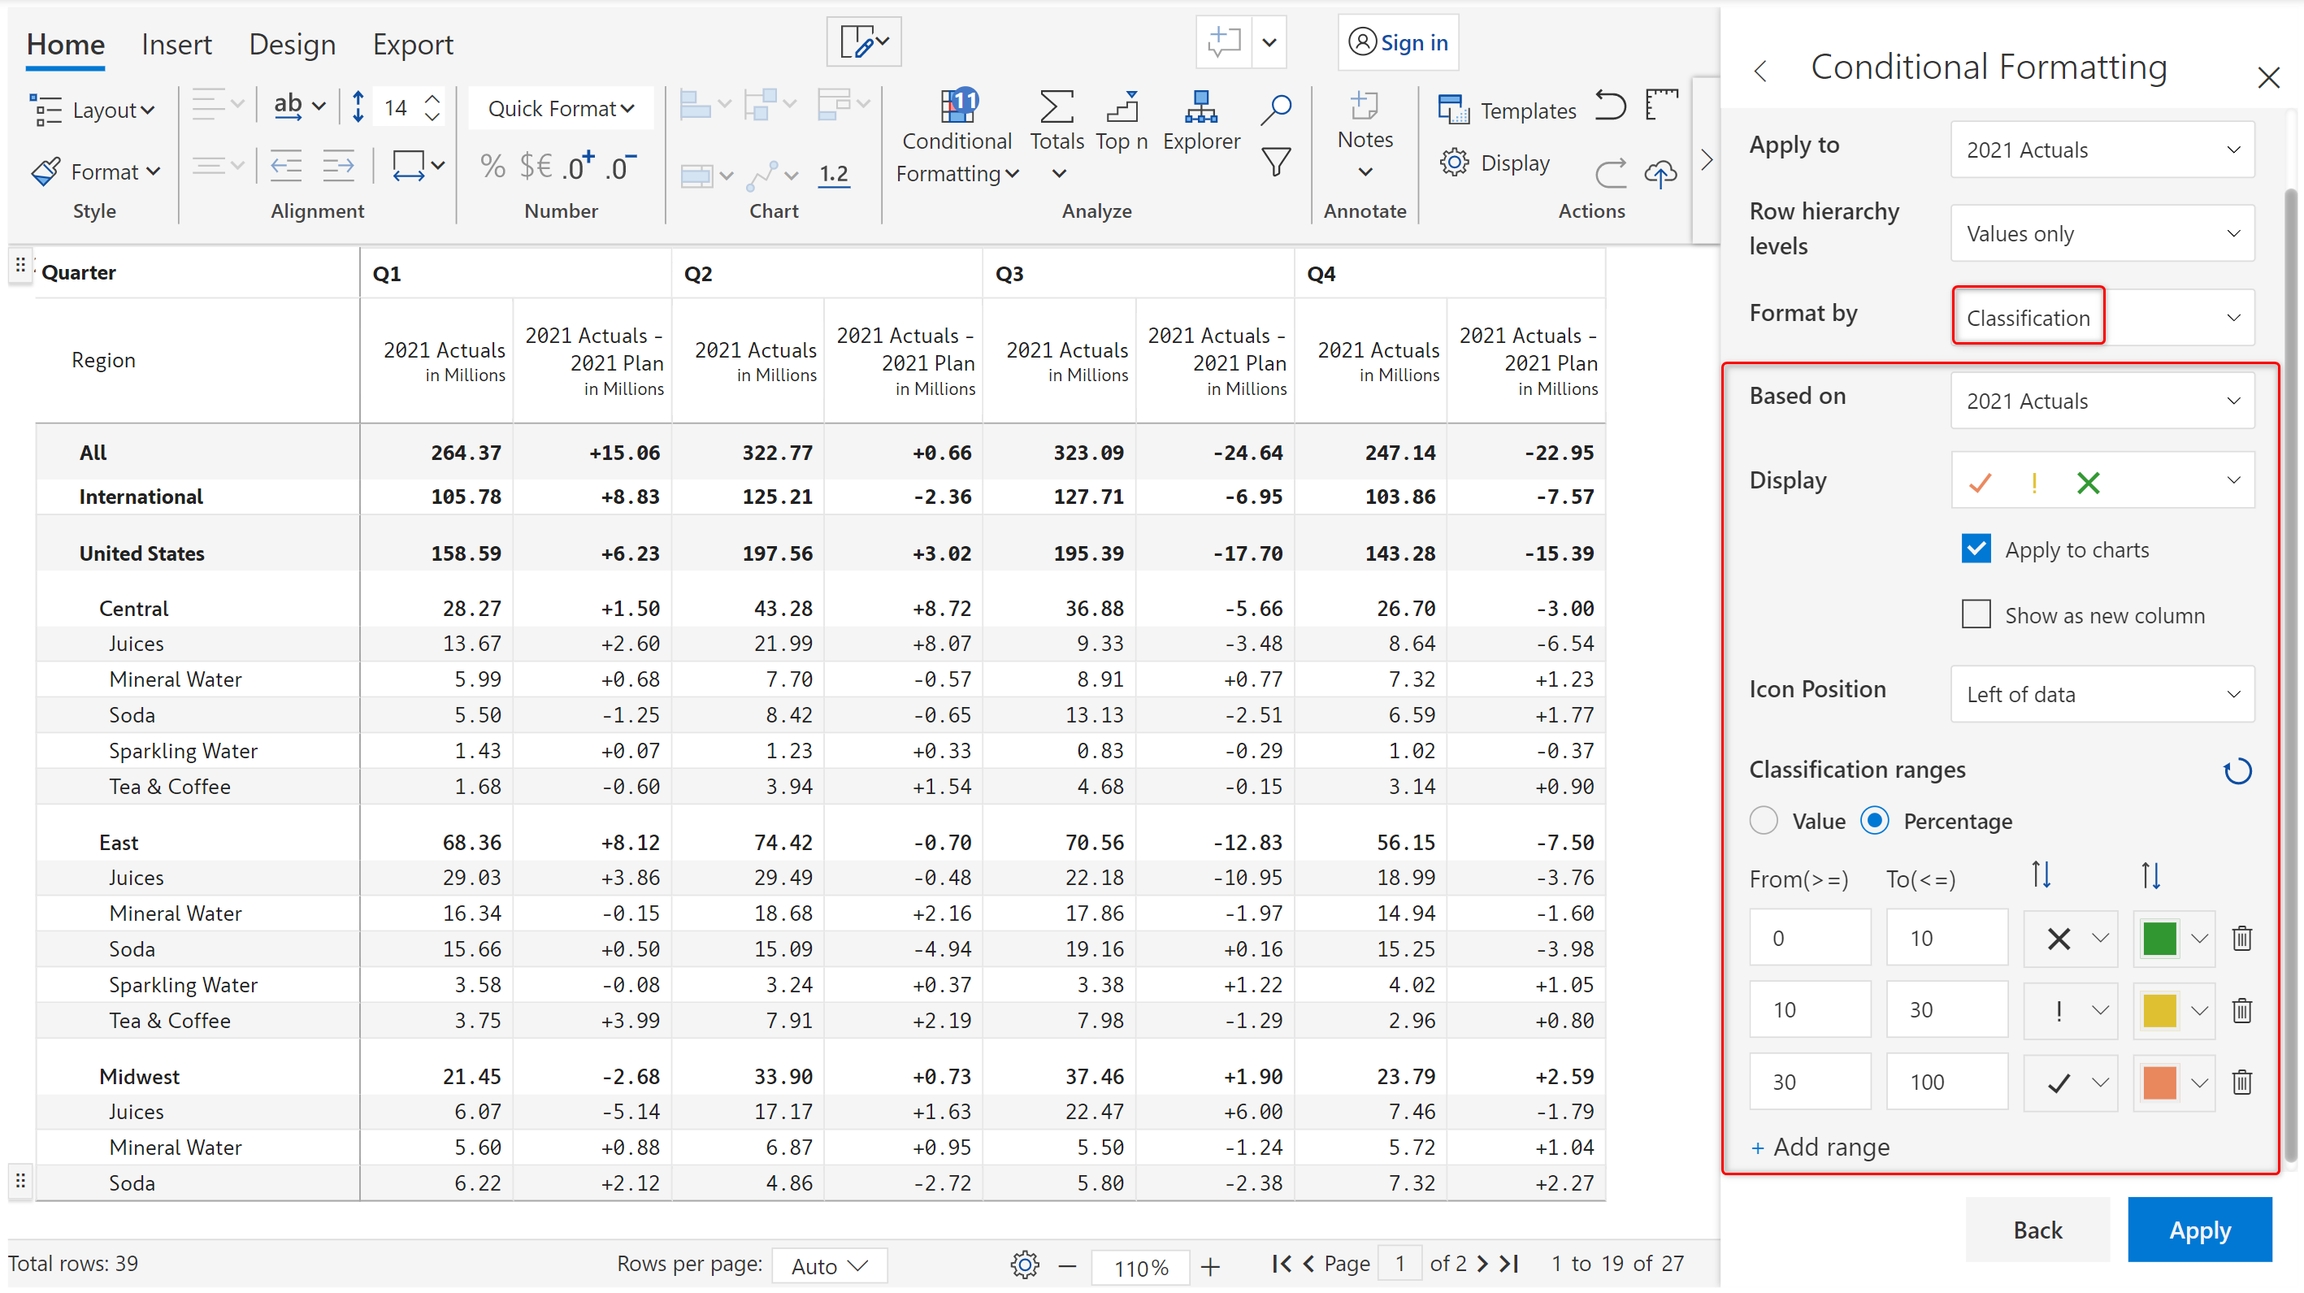
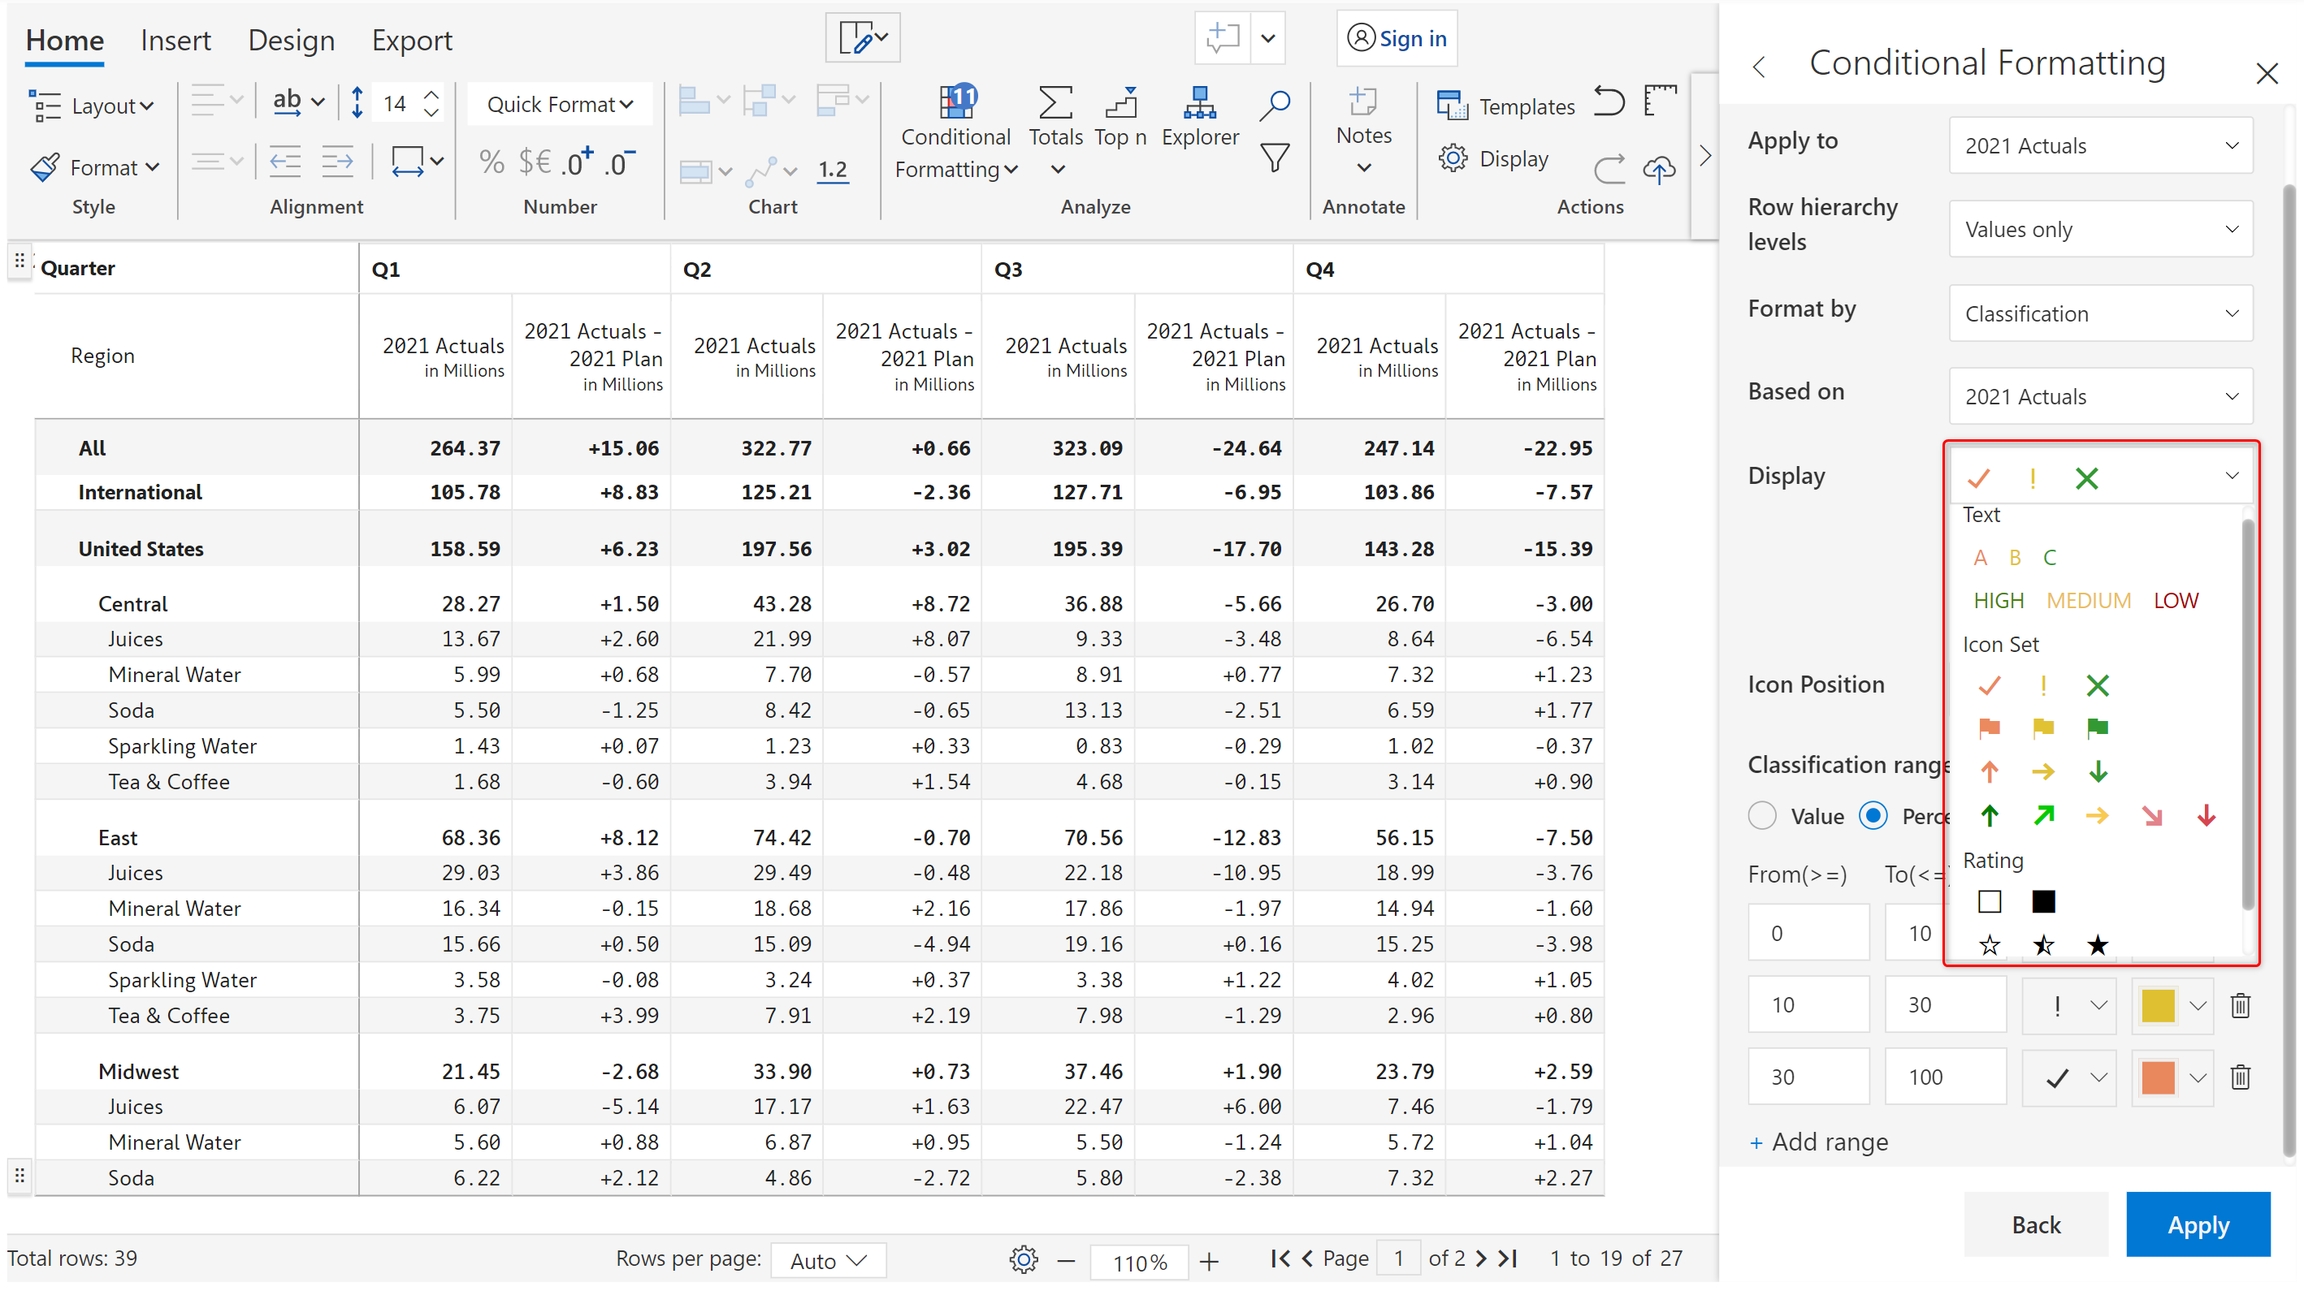
Click on the 'Display' dropdown. You can see the three types of classifications already mentioned. Let's look at them one by one.
1. Text
Many times, it may become essential to categorize performance. A common technique used by enterprises to categorize inventory, vendors or materials is ABC analysis. Inforiver delivers this capability right out of the box.
1.1. Select 'ABC' from the Display dropdown. Let's go with the default settings. Click Apply.
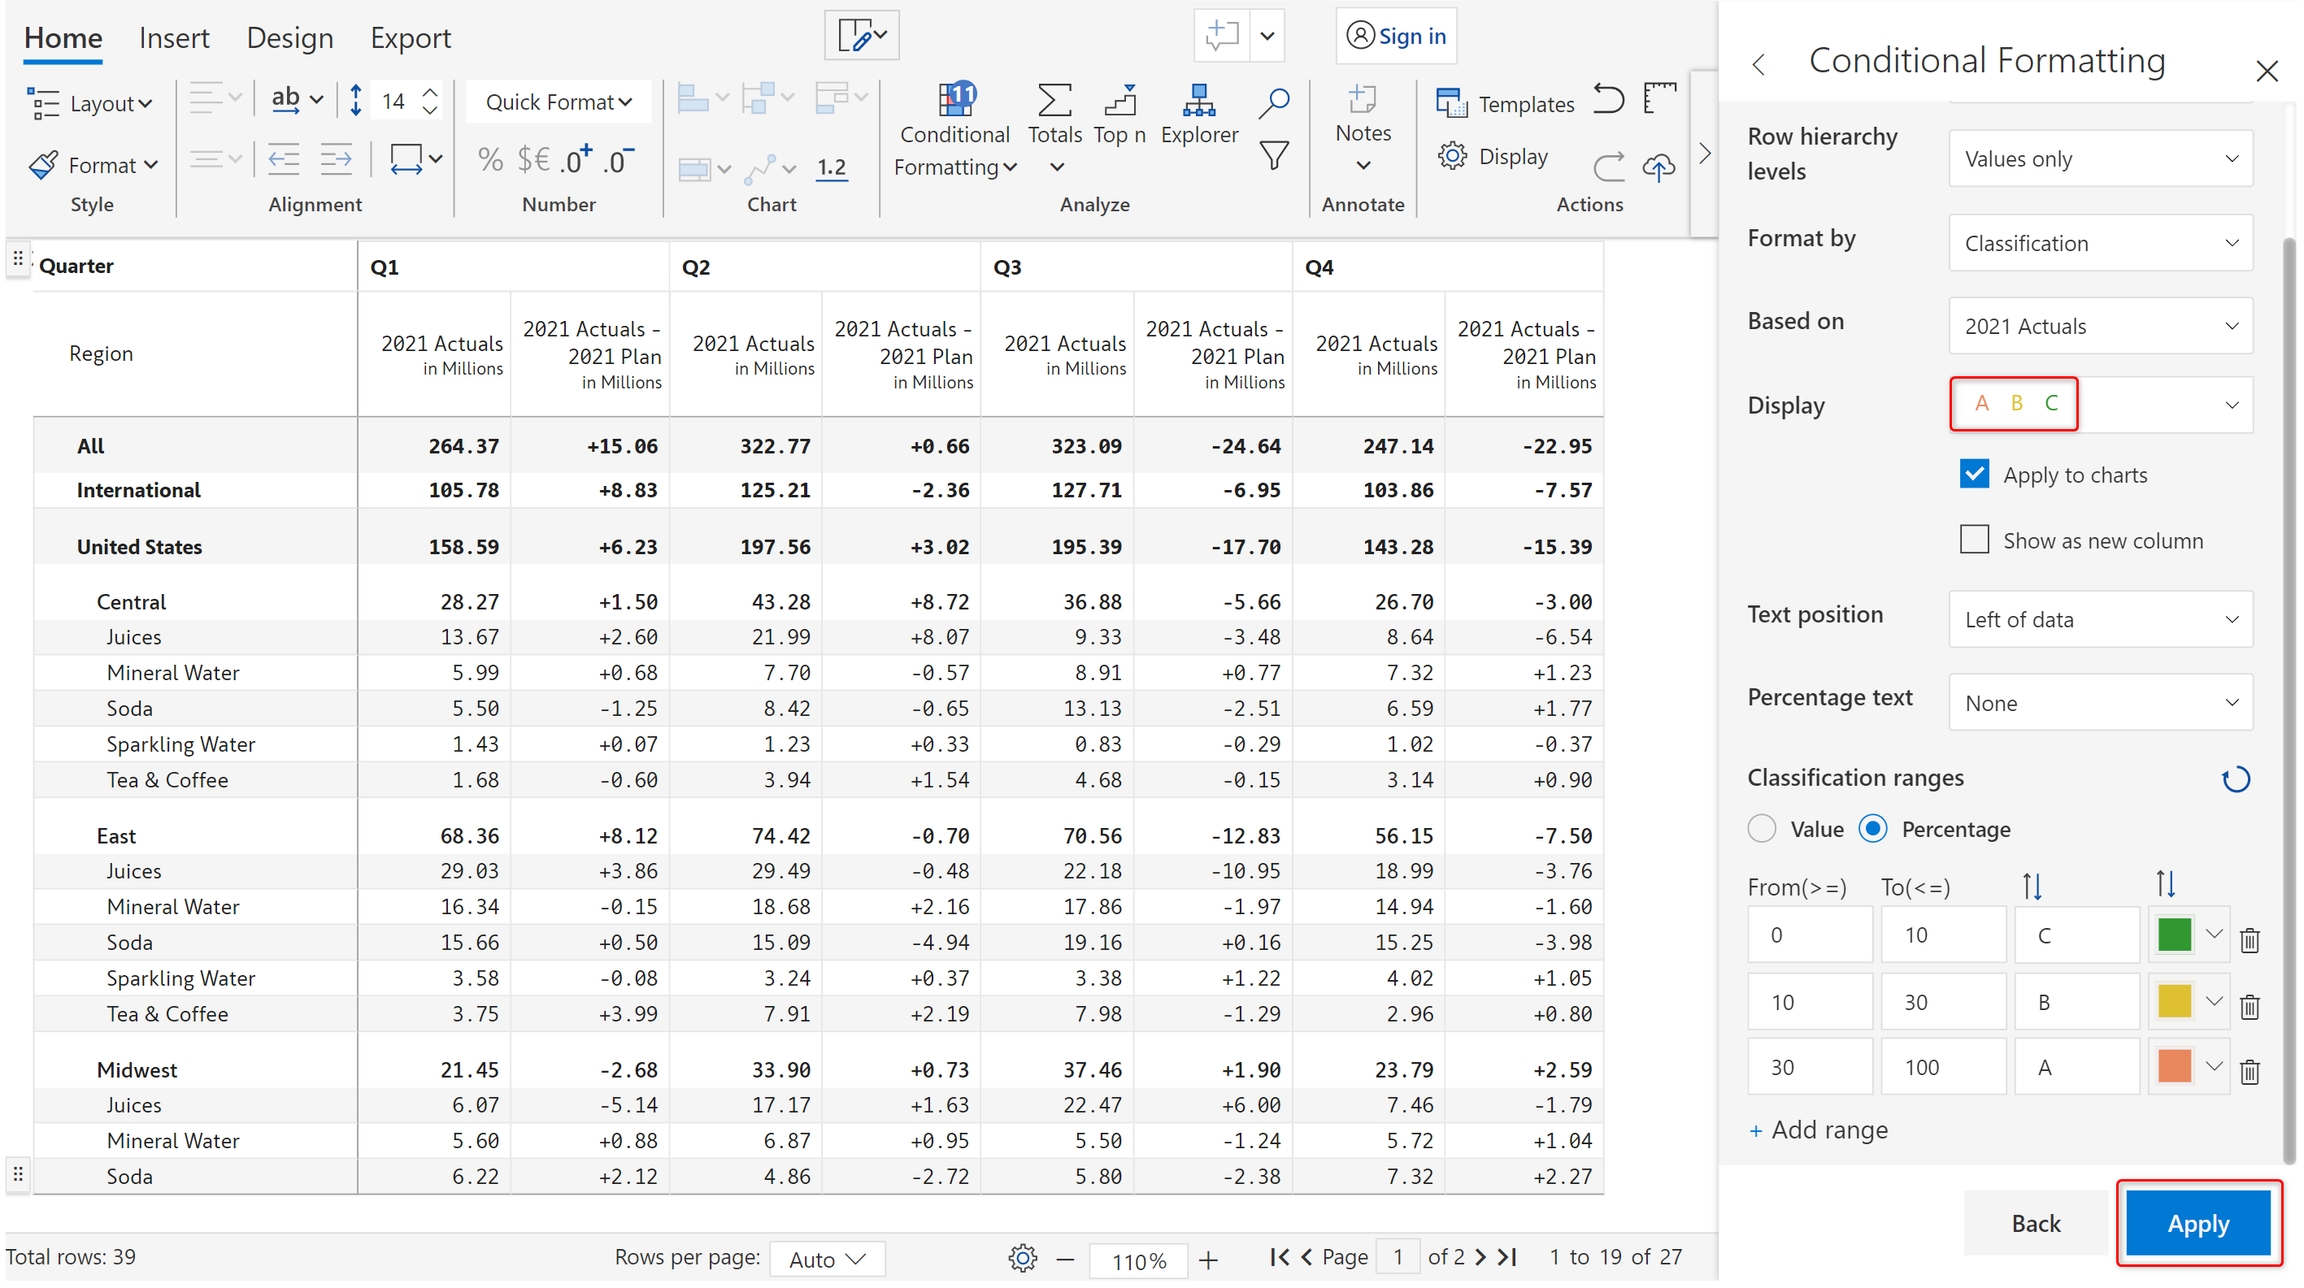
1.2. The rows are classified and the text is displayed on the left of the data.

1.3. You can also have the classifications appear in a separate column if required. Check the Show as new column checkbox.
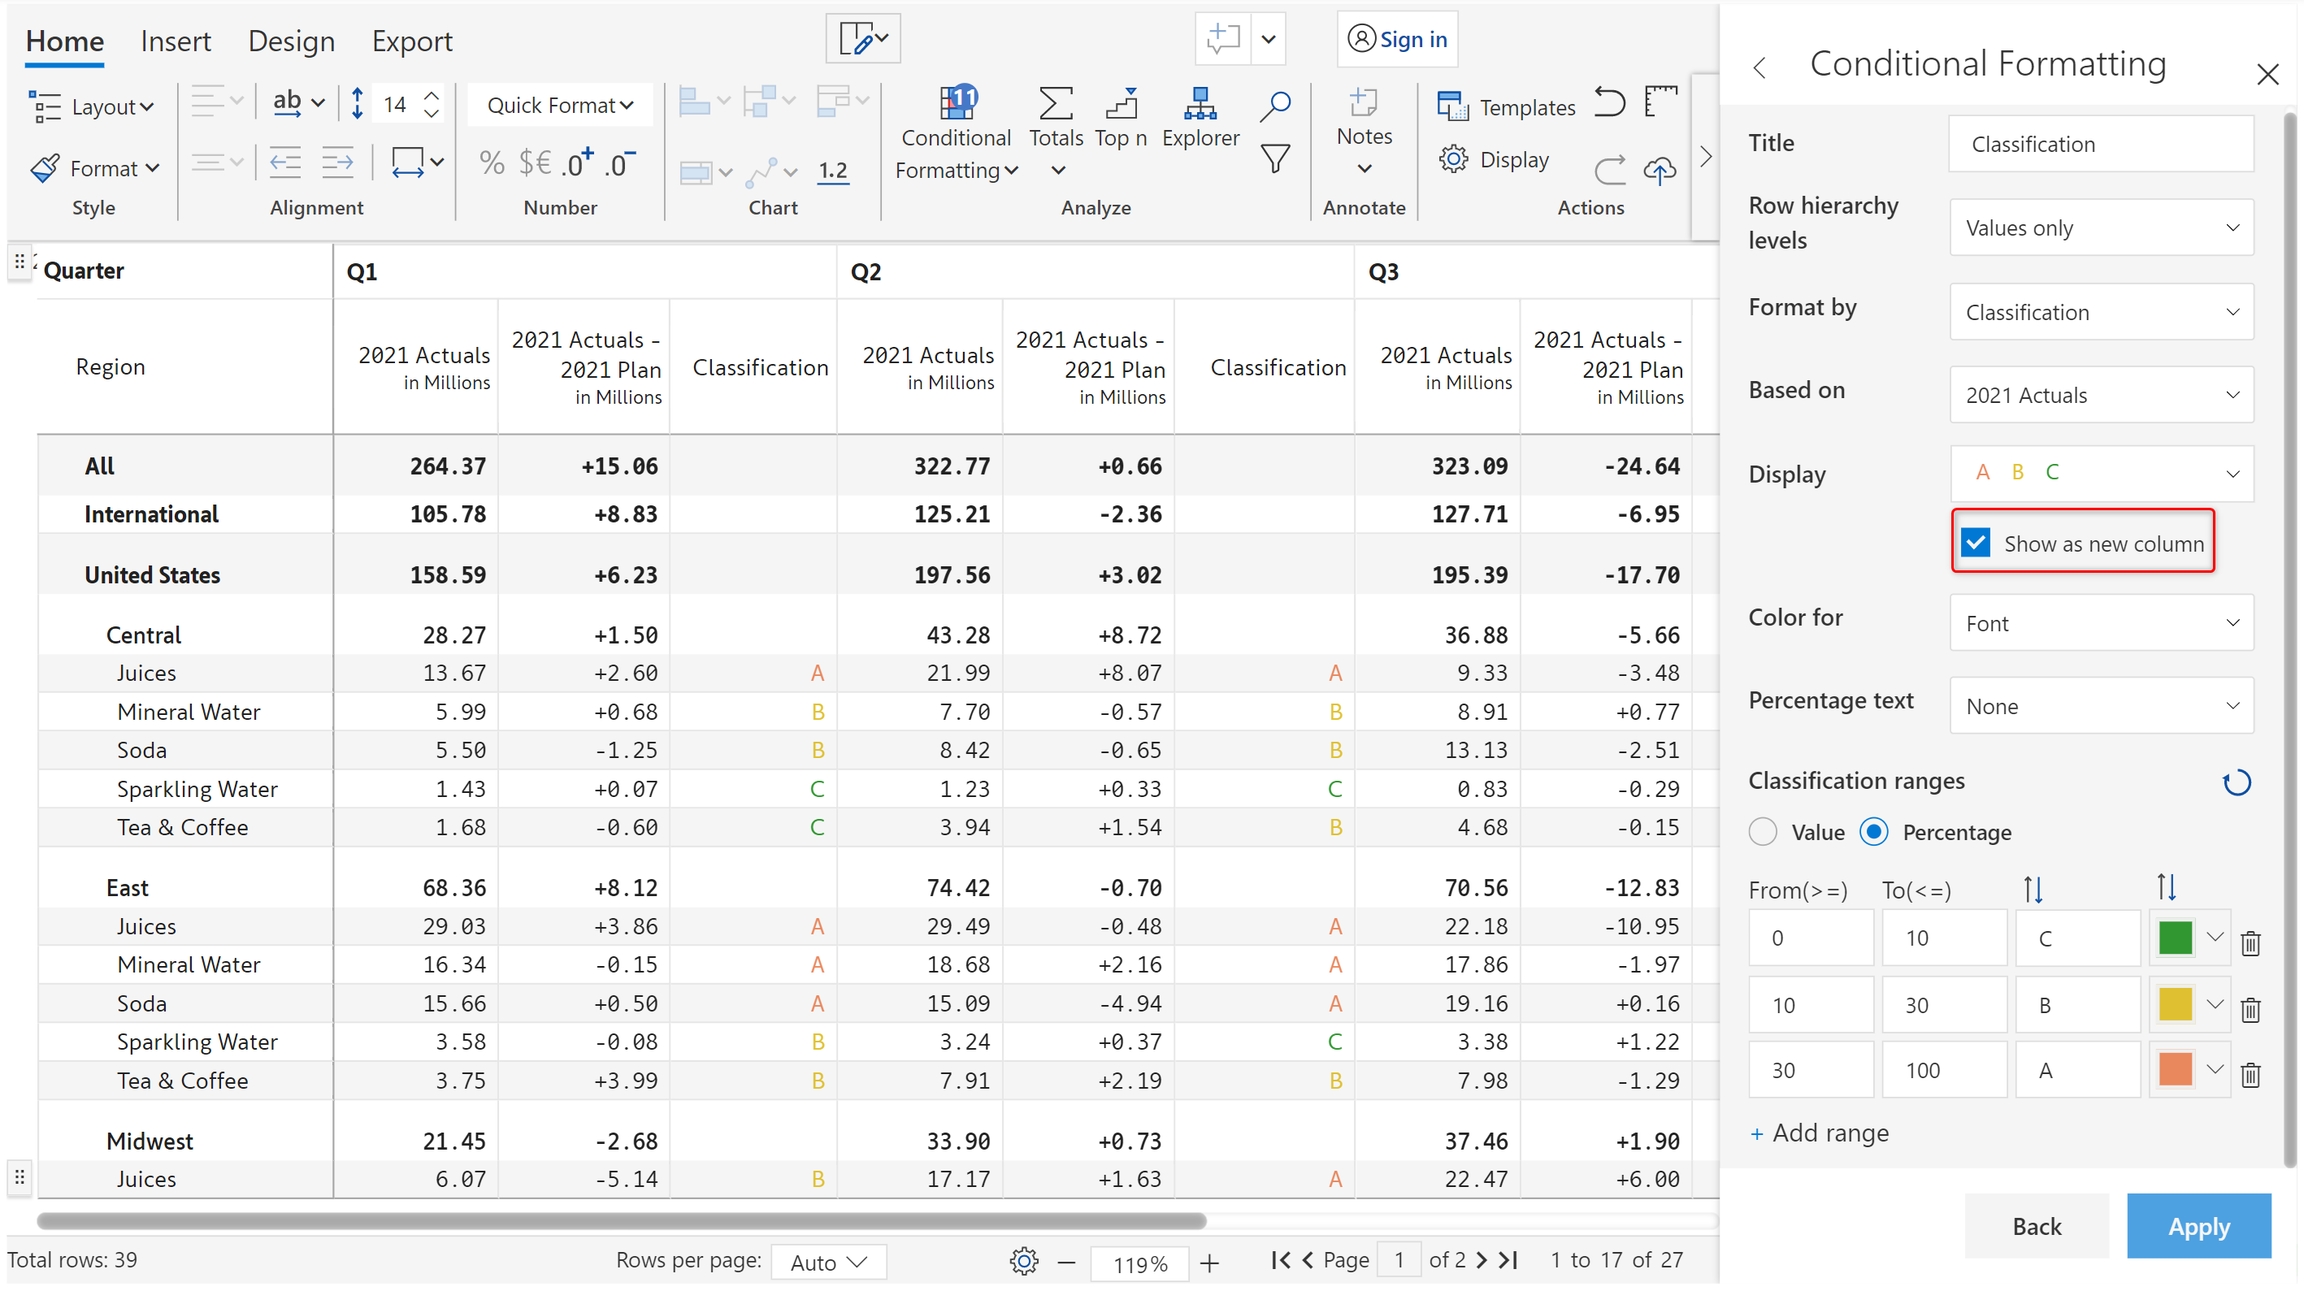
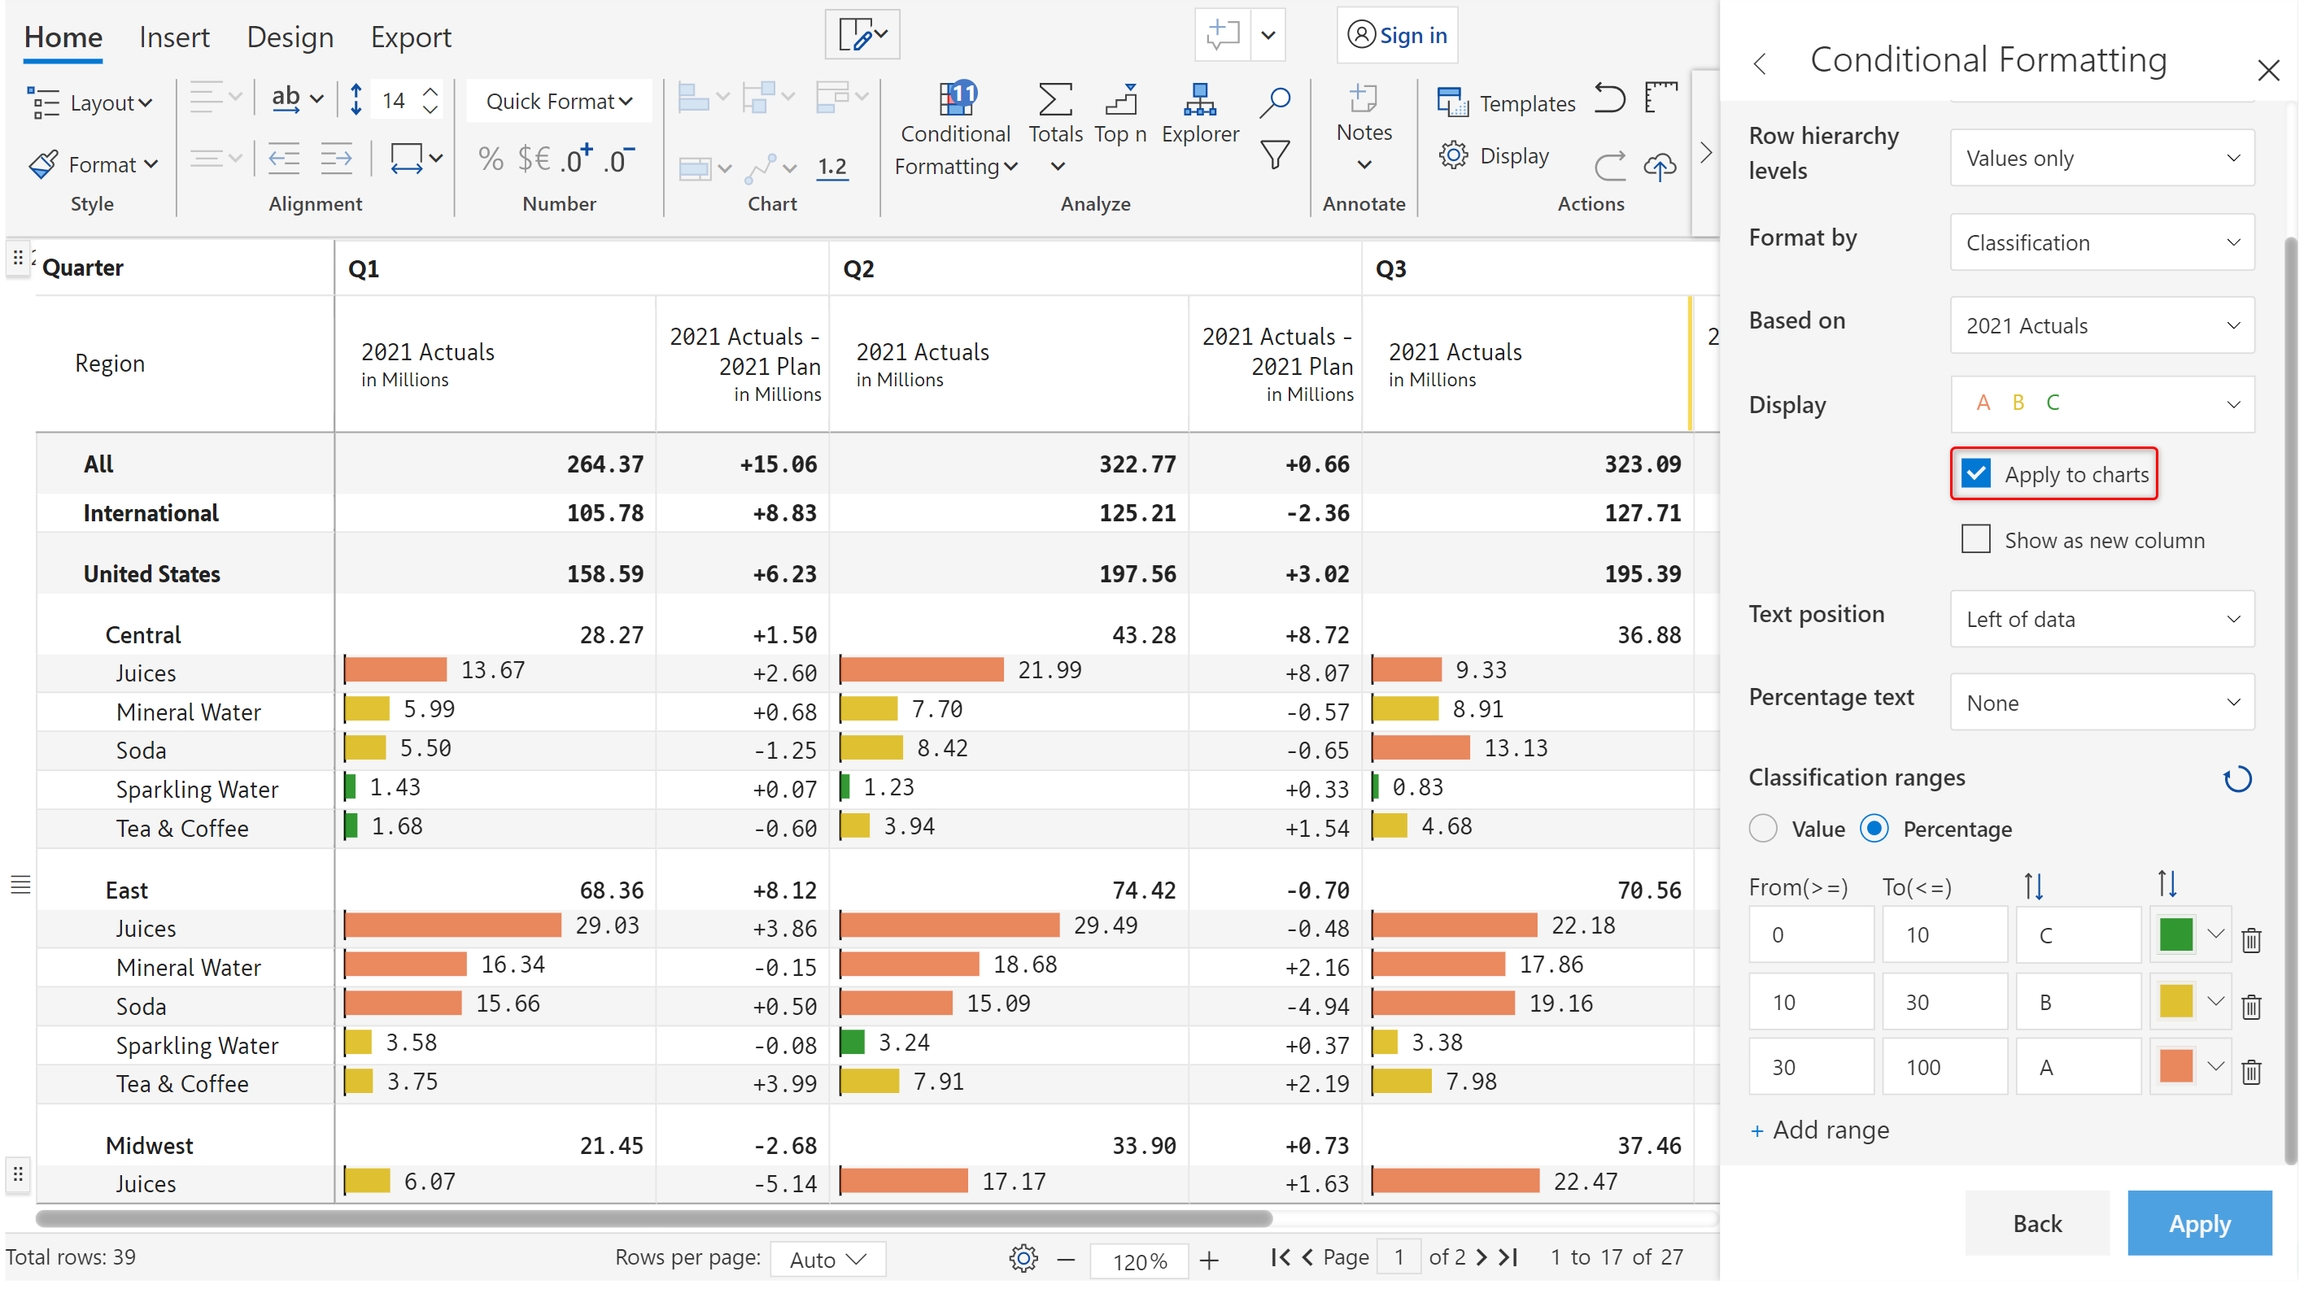
1.4. When there are charts in the column where classification is to be applied, check the Apply to charts checkbox. In the below image, 2021 Actuals are visualized using bar charts, and the colors defined for the ABC ranges are used for formatting.
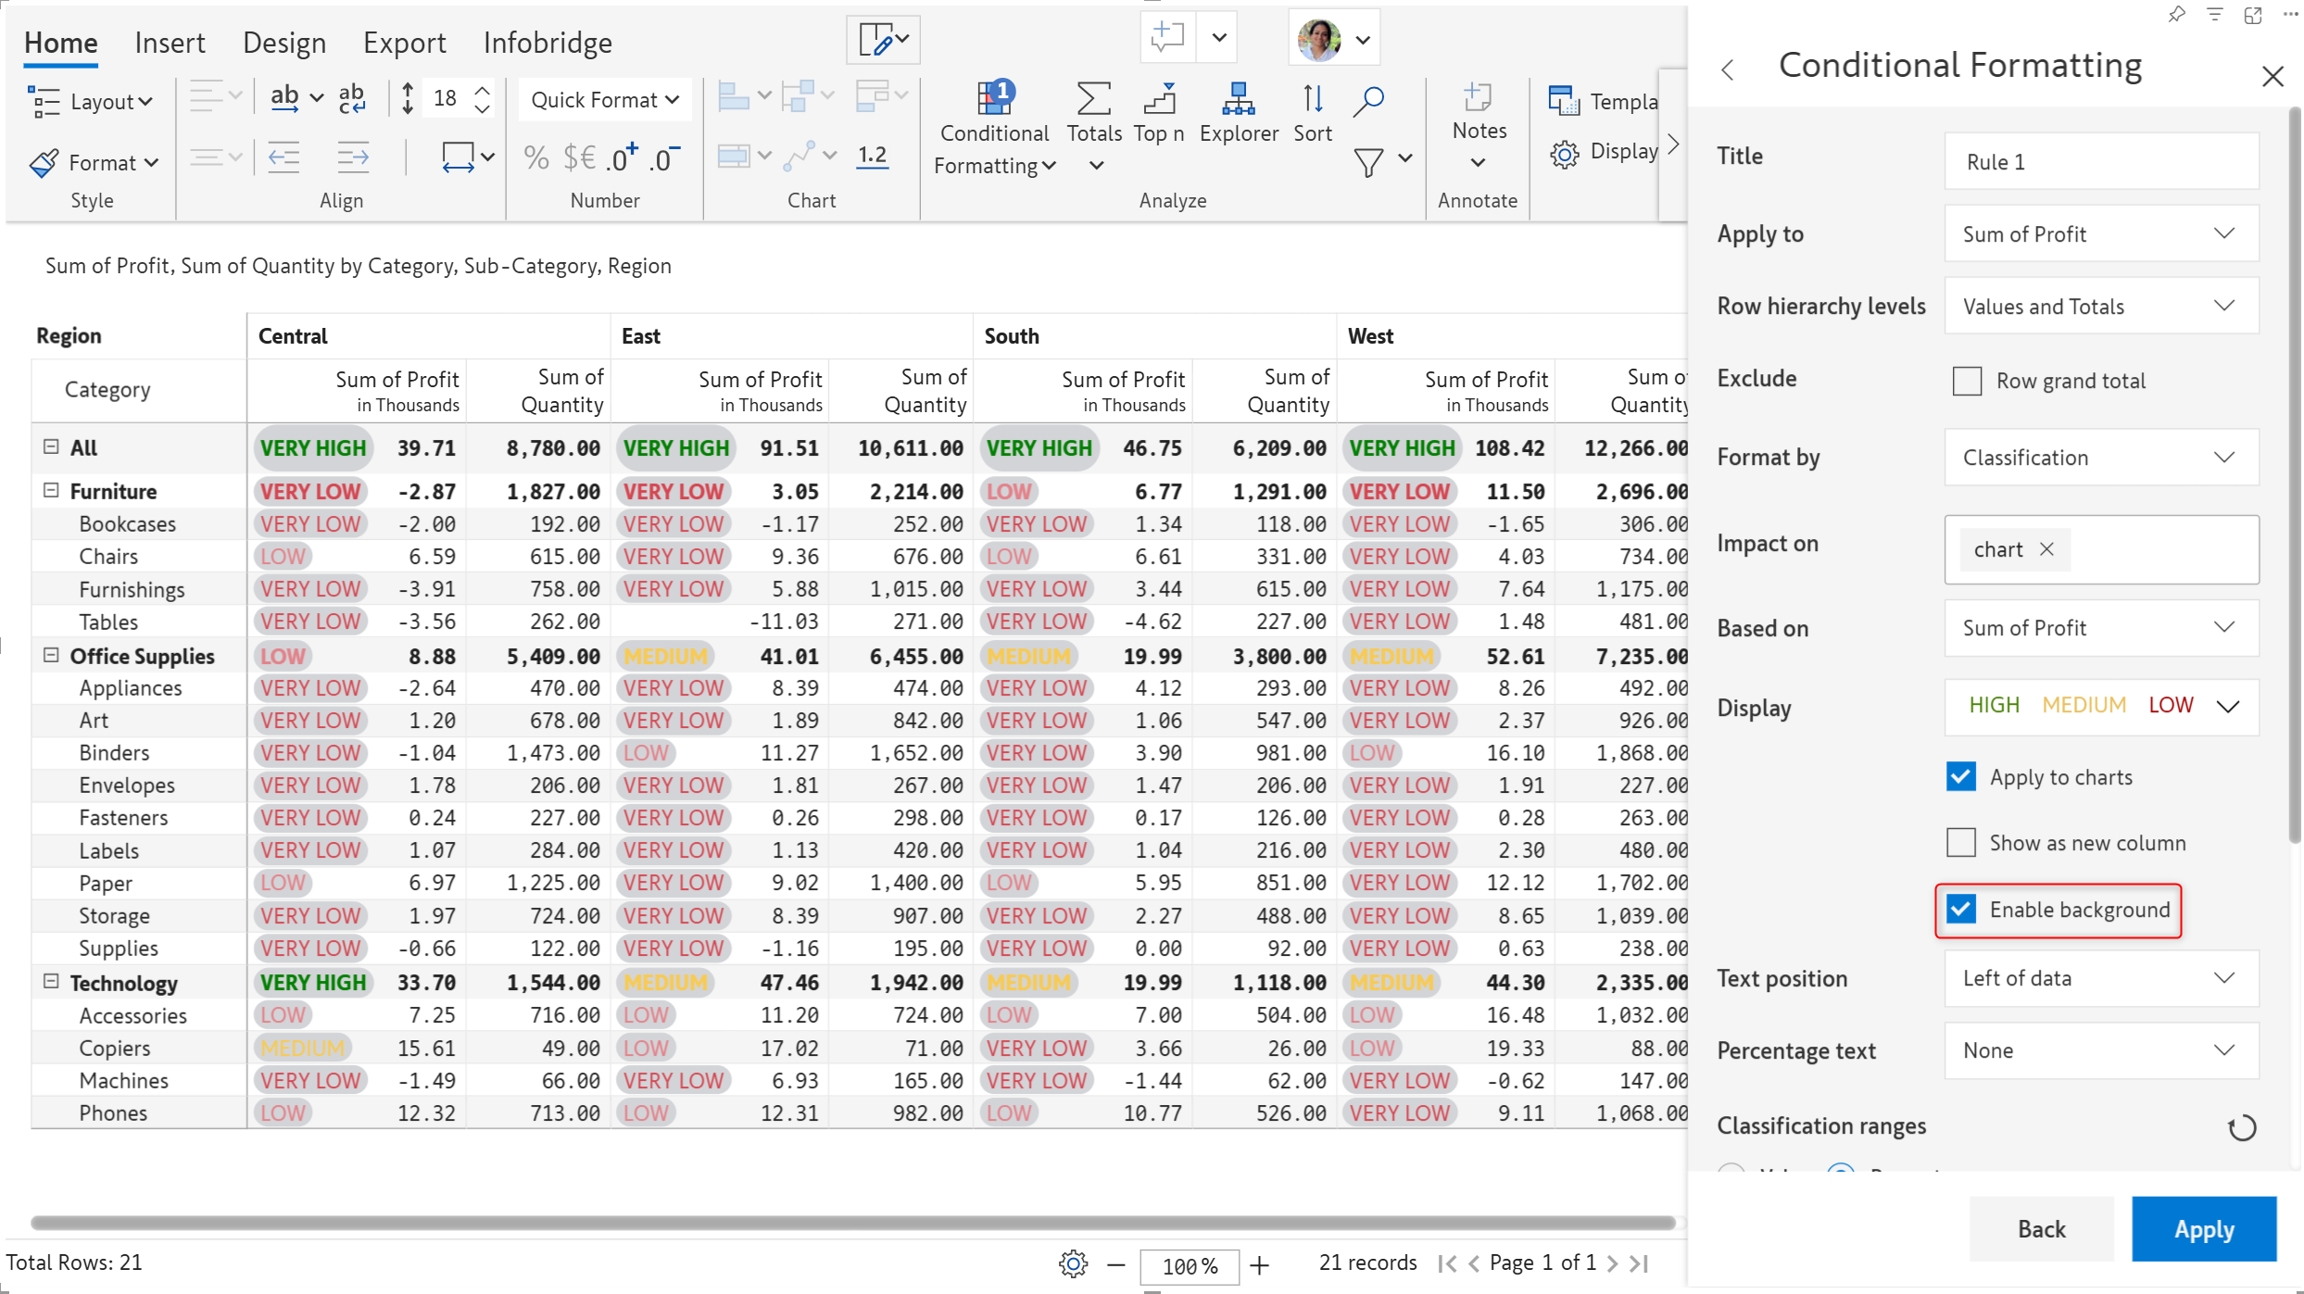
1.5. you can choose to enable a background for the text. The Enable background option is only available for text classification, not icons or ratings.
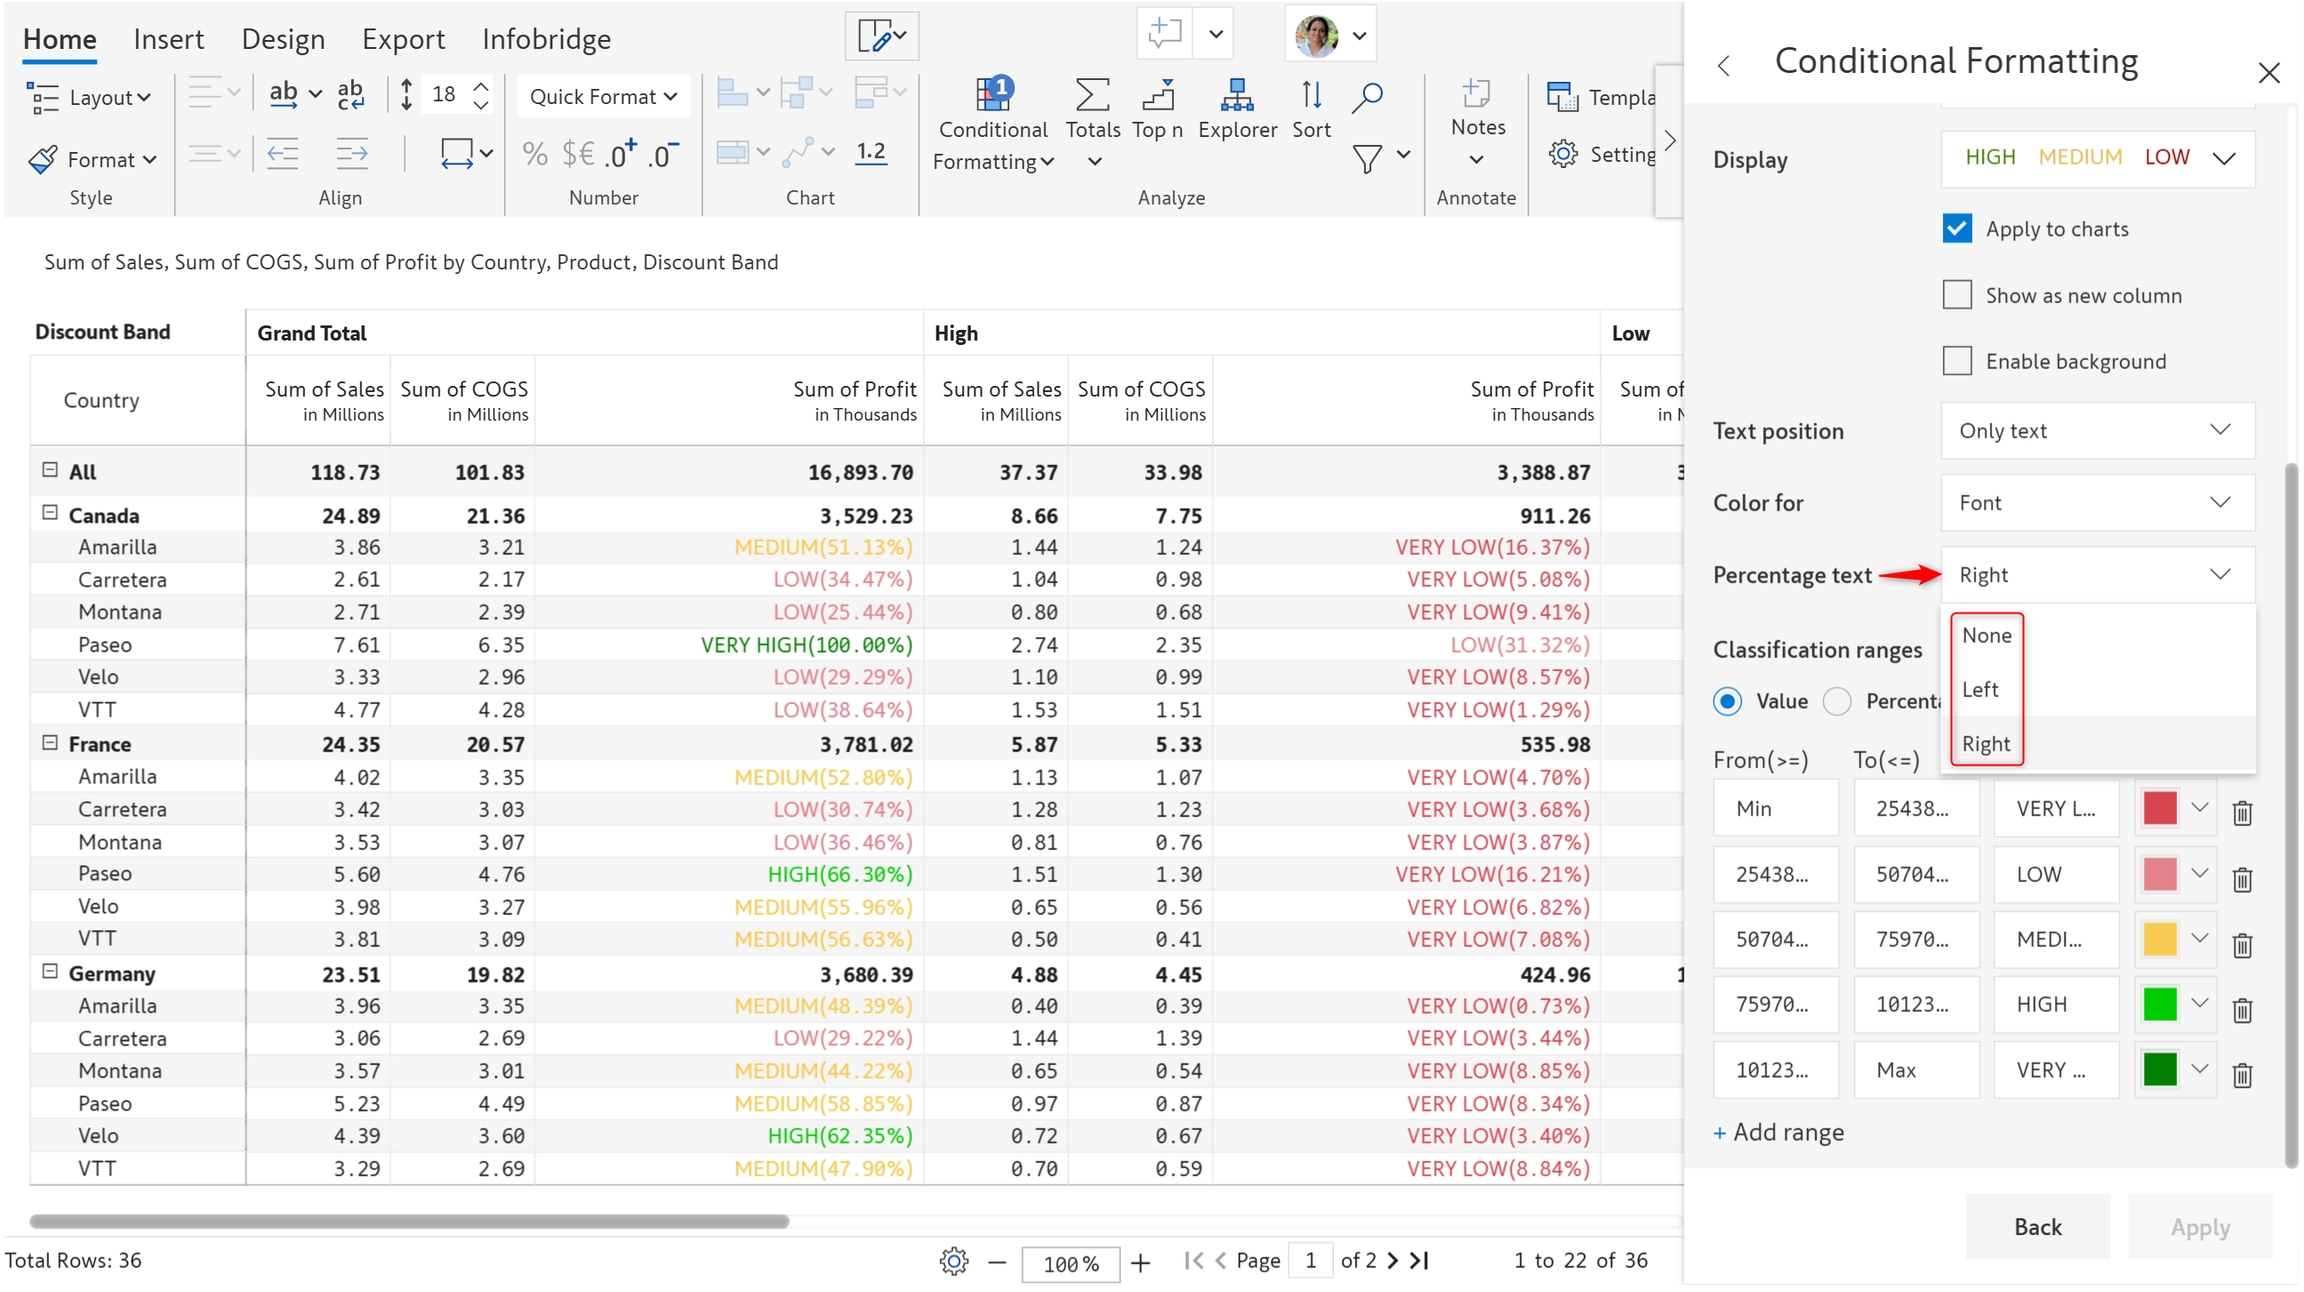
1.6. You can also choose to display only the classification text by selecting Only Text from the Text position dropdown.
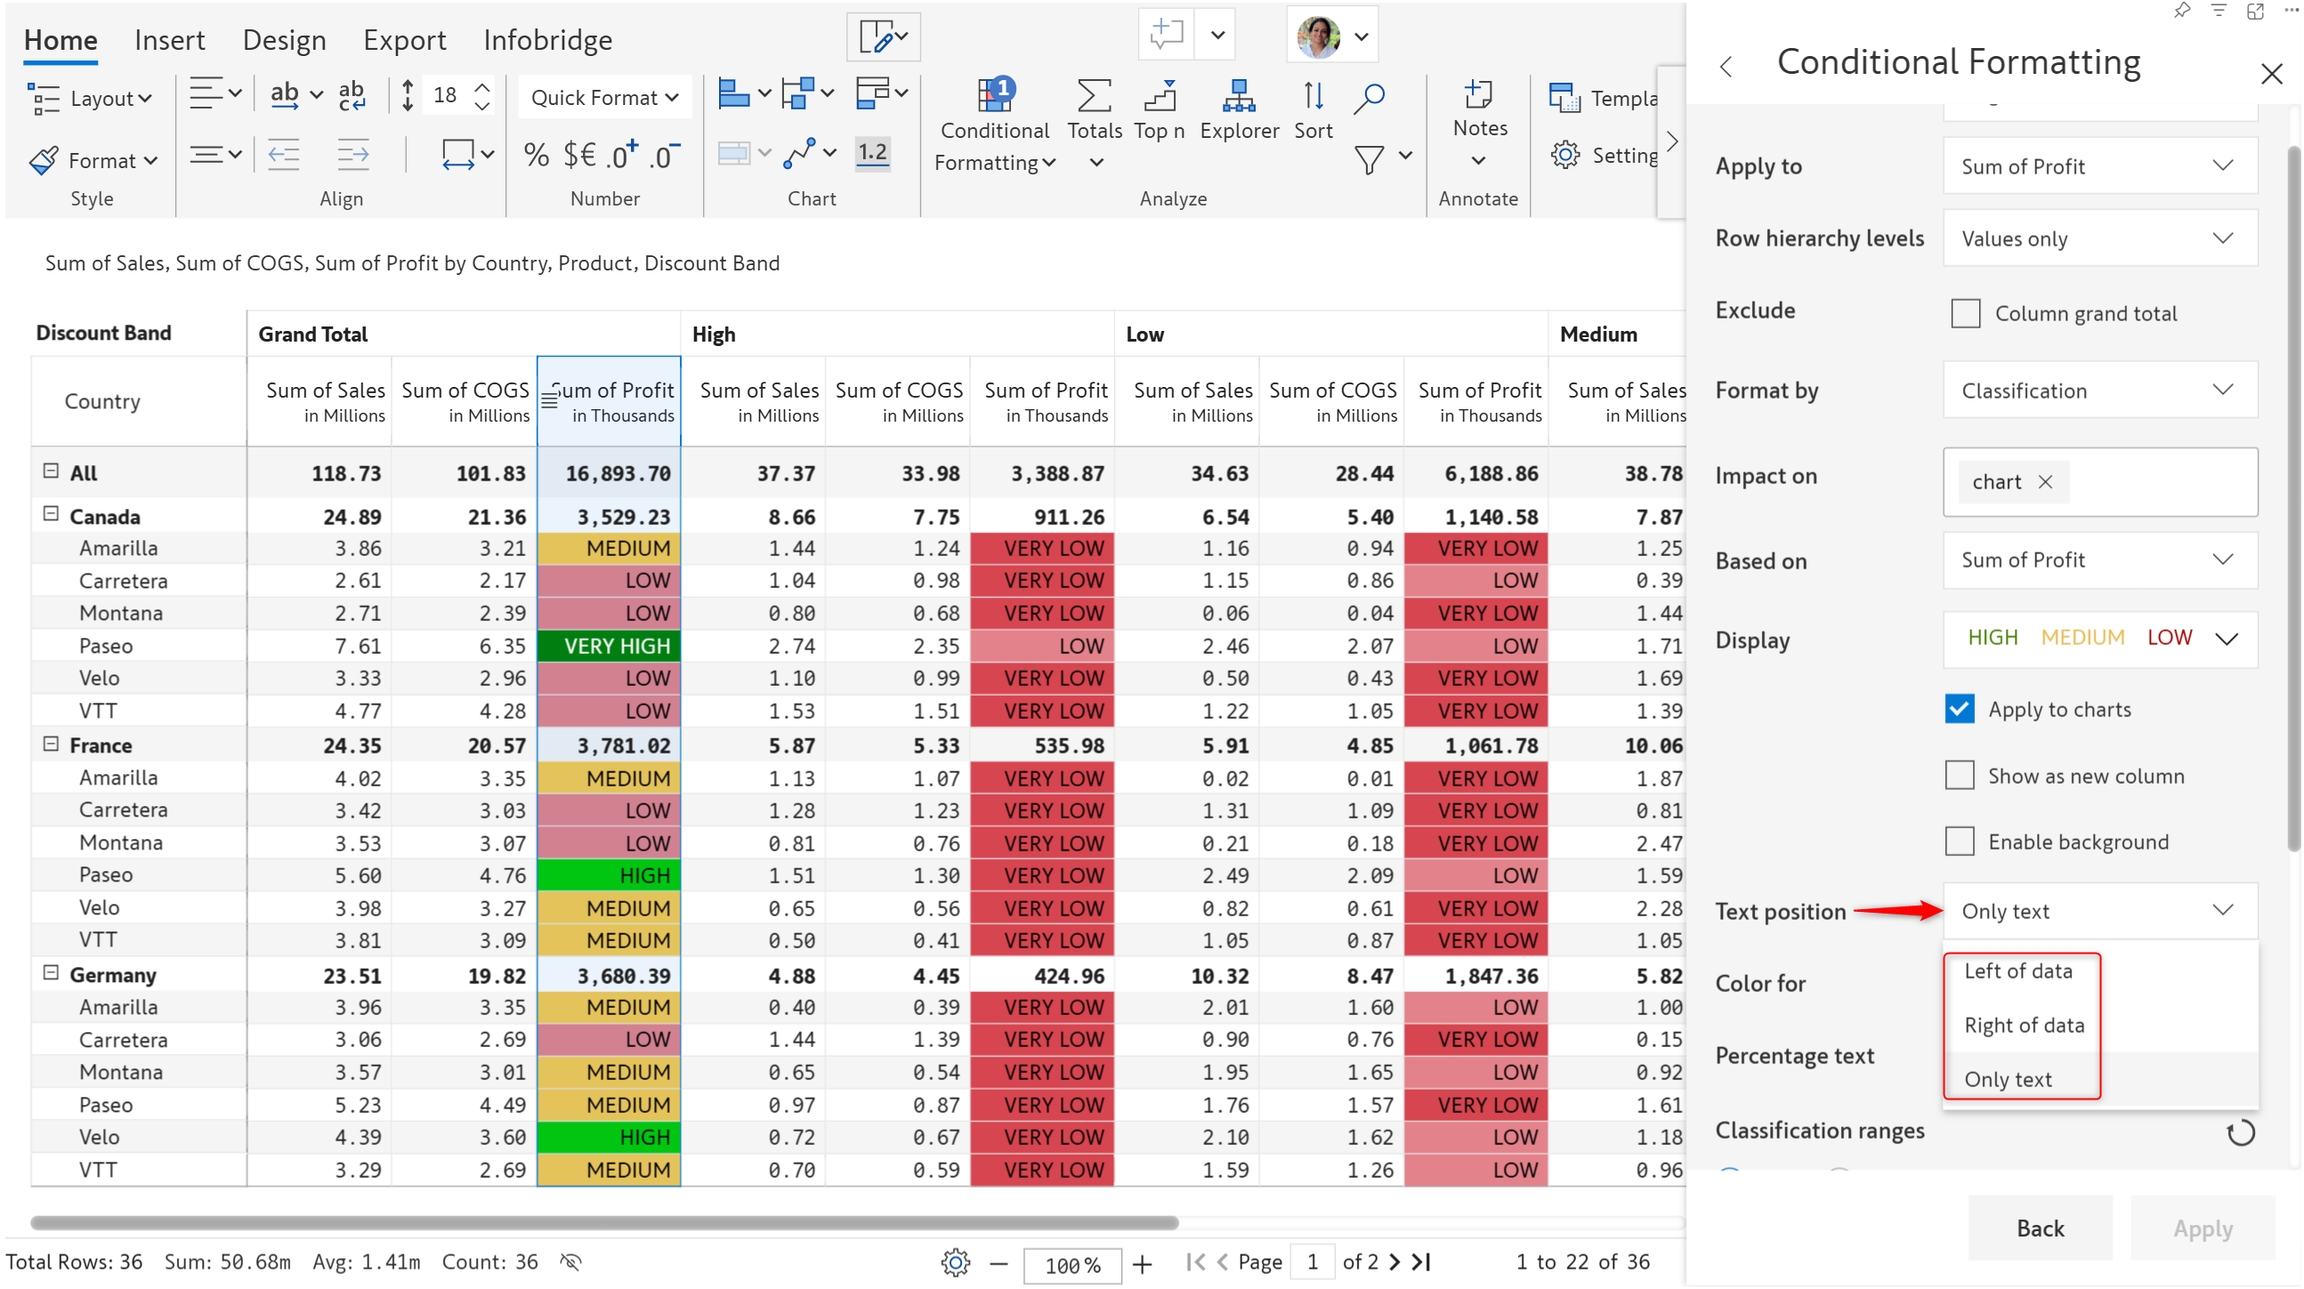
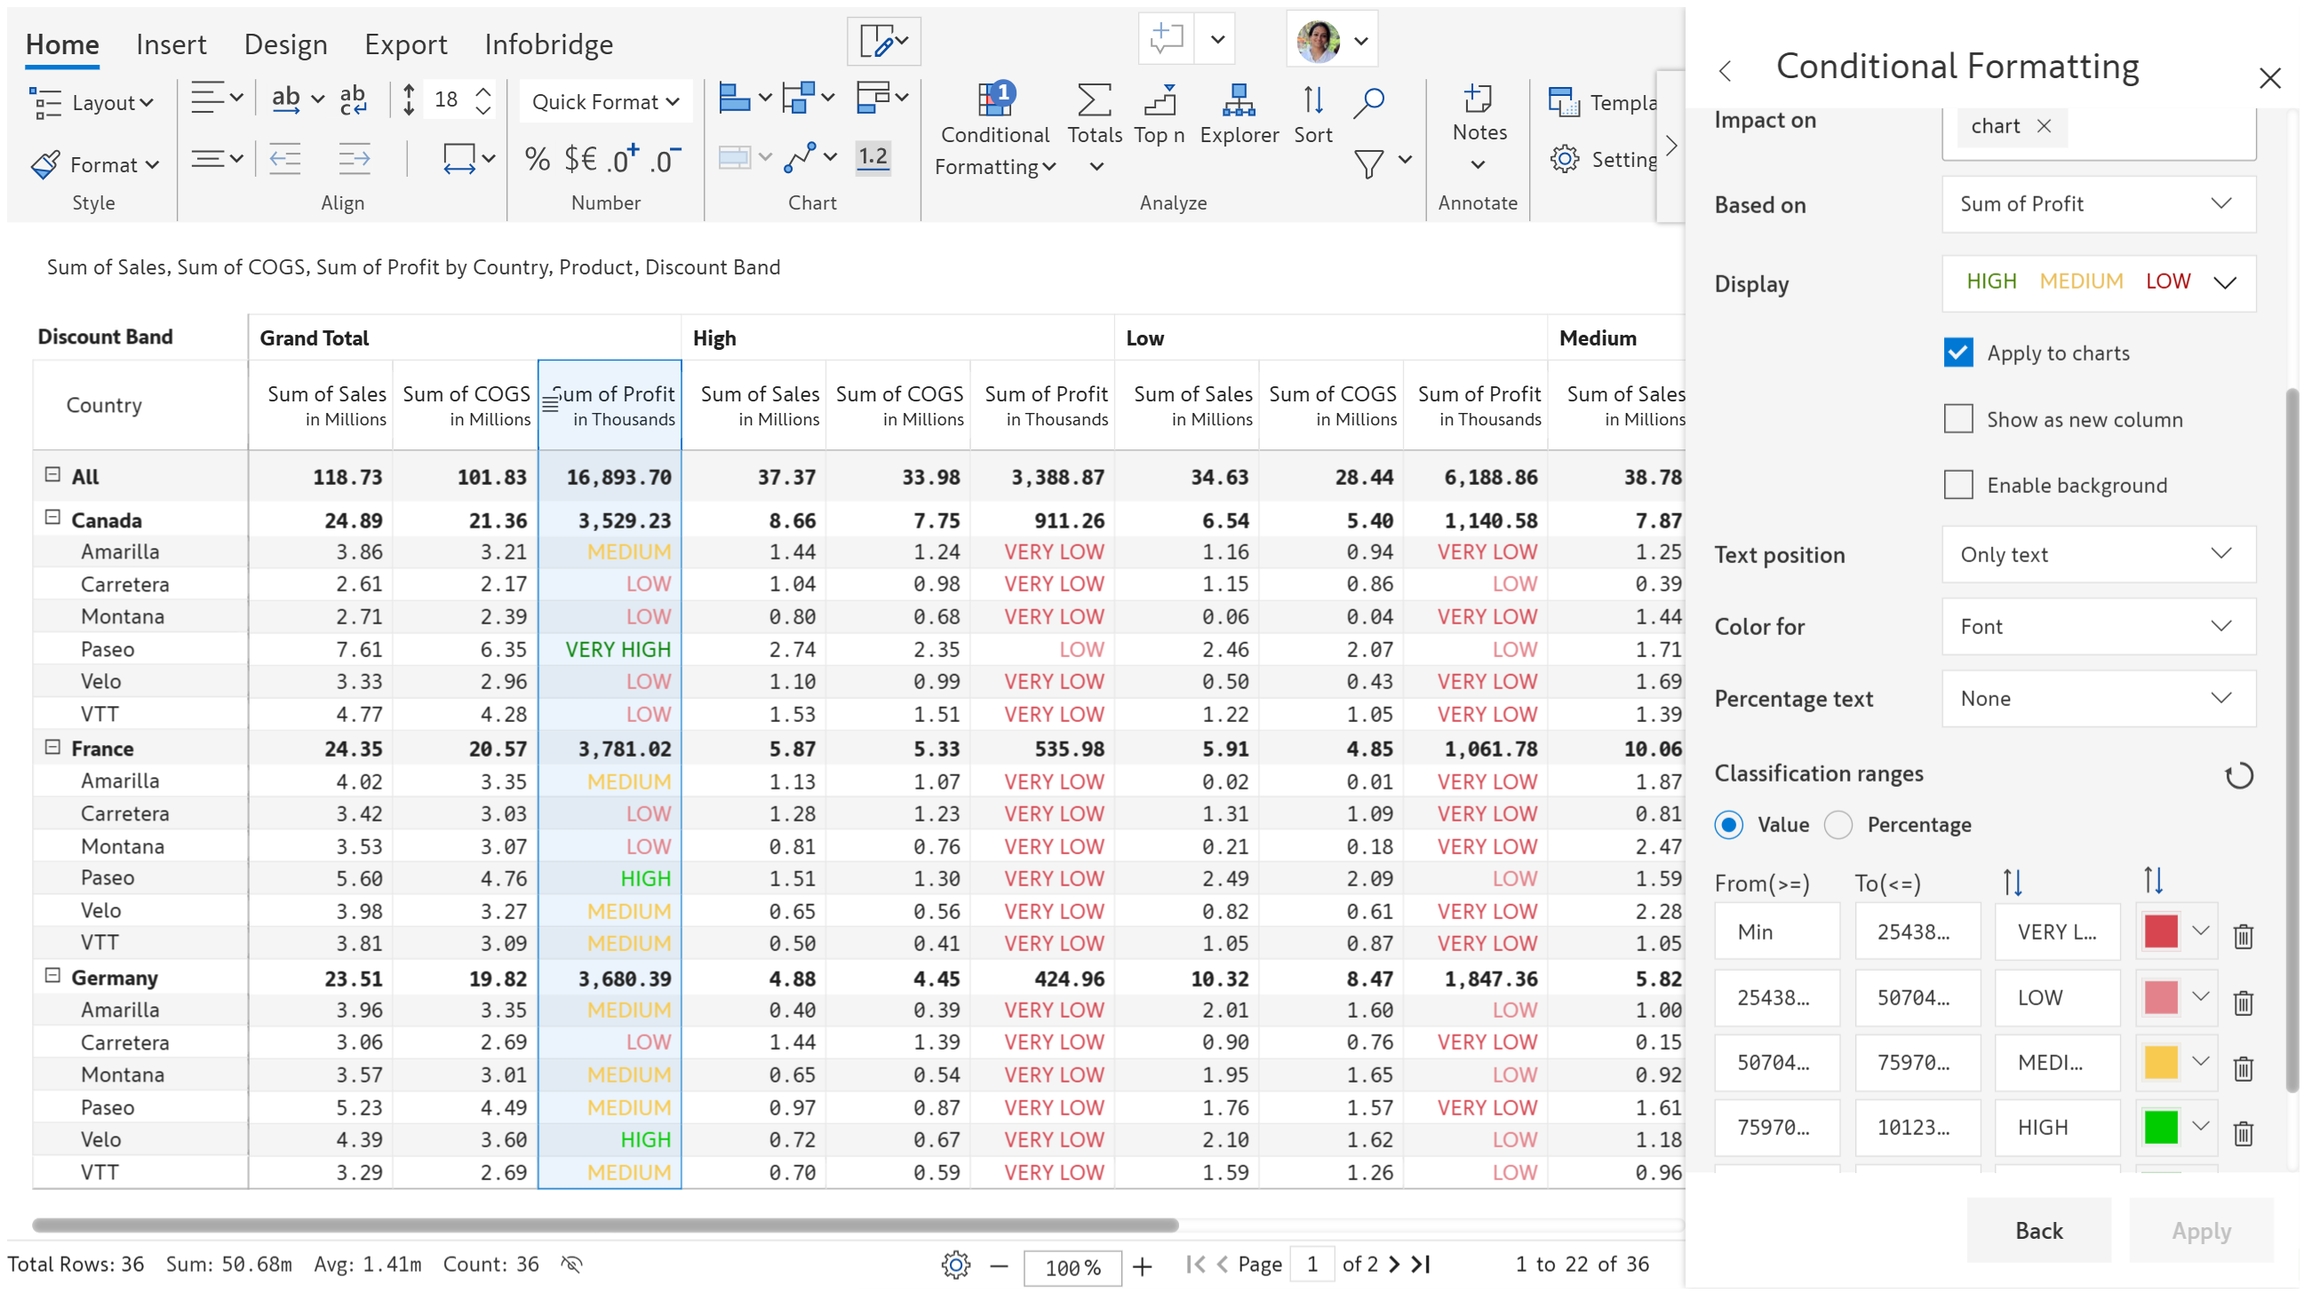
1.7. When you choose the Only Text option, you can choose to apply the color to the font, background, or both.
1.8. You can display the percentage contribution to the left or right of the text using the Percentage text dropdown.
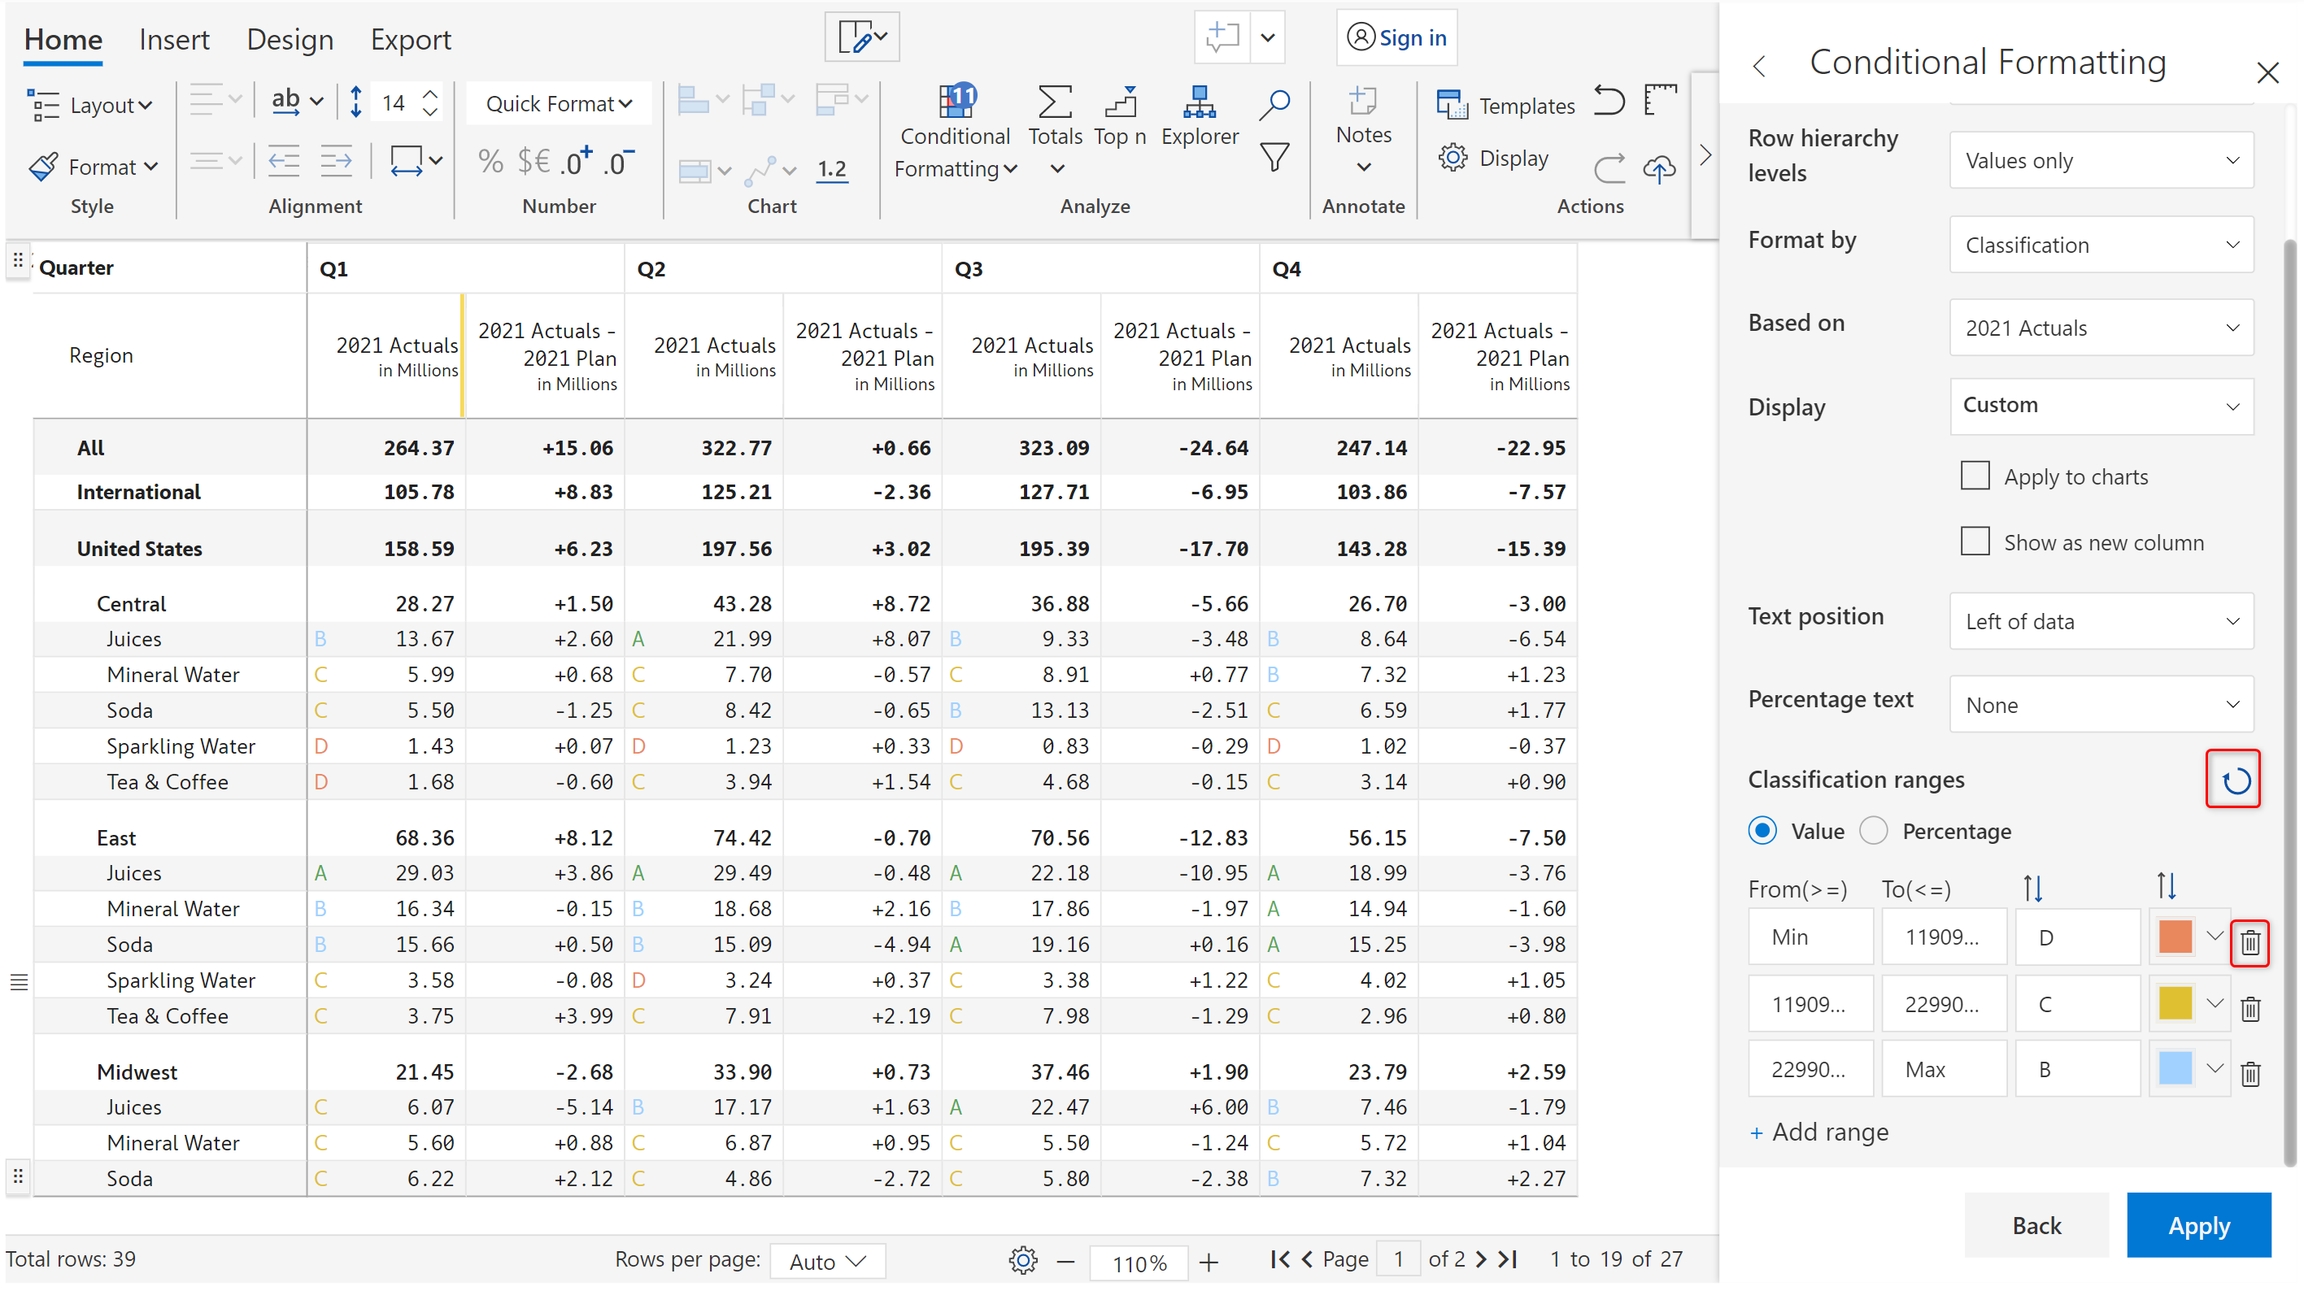
1.9. You can define custom ranges as shown below. Click the Add Range button to create an additional range of values.
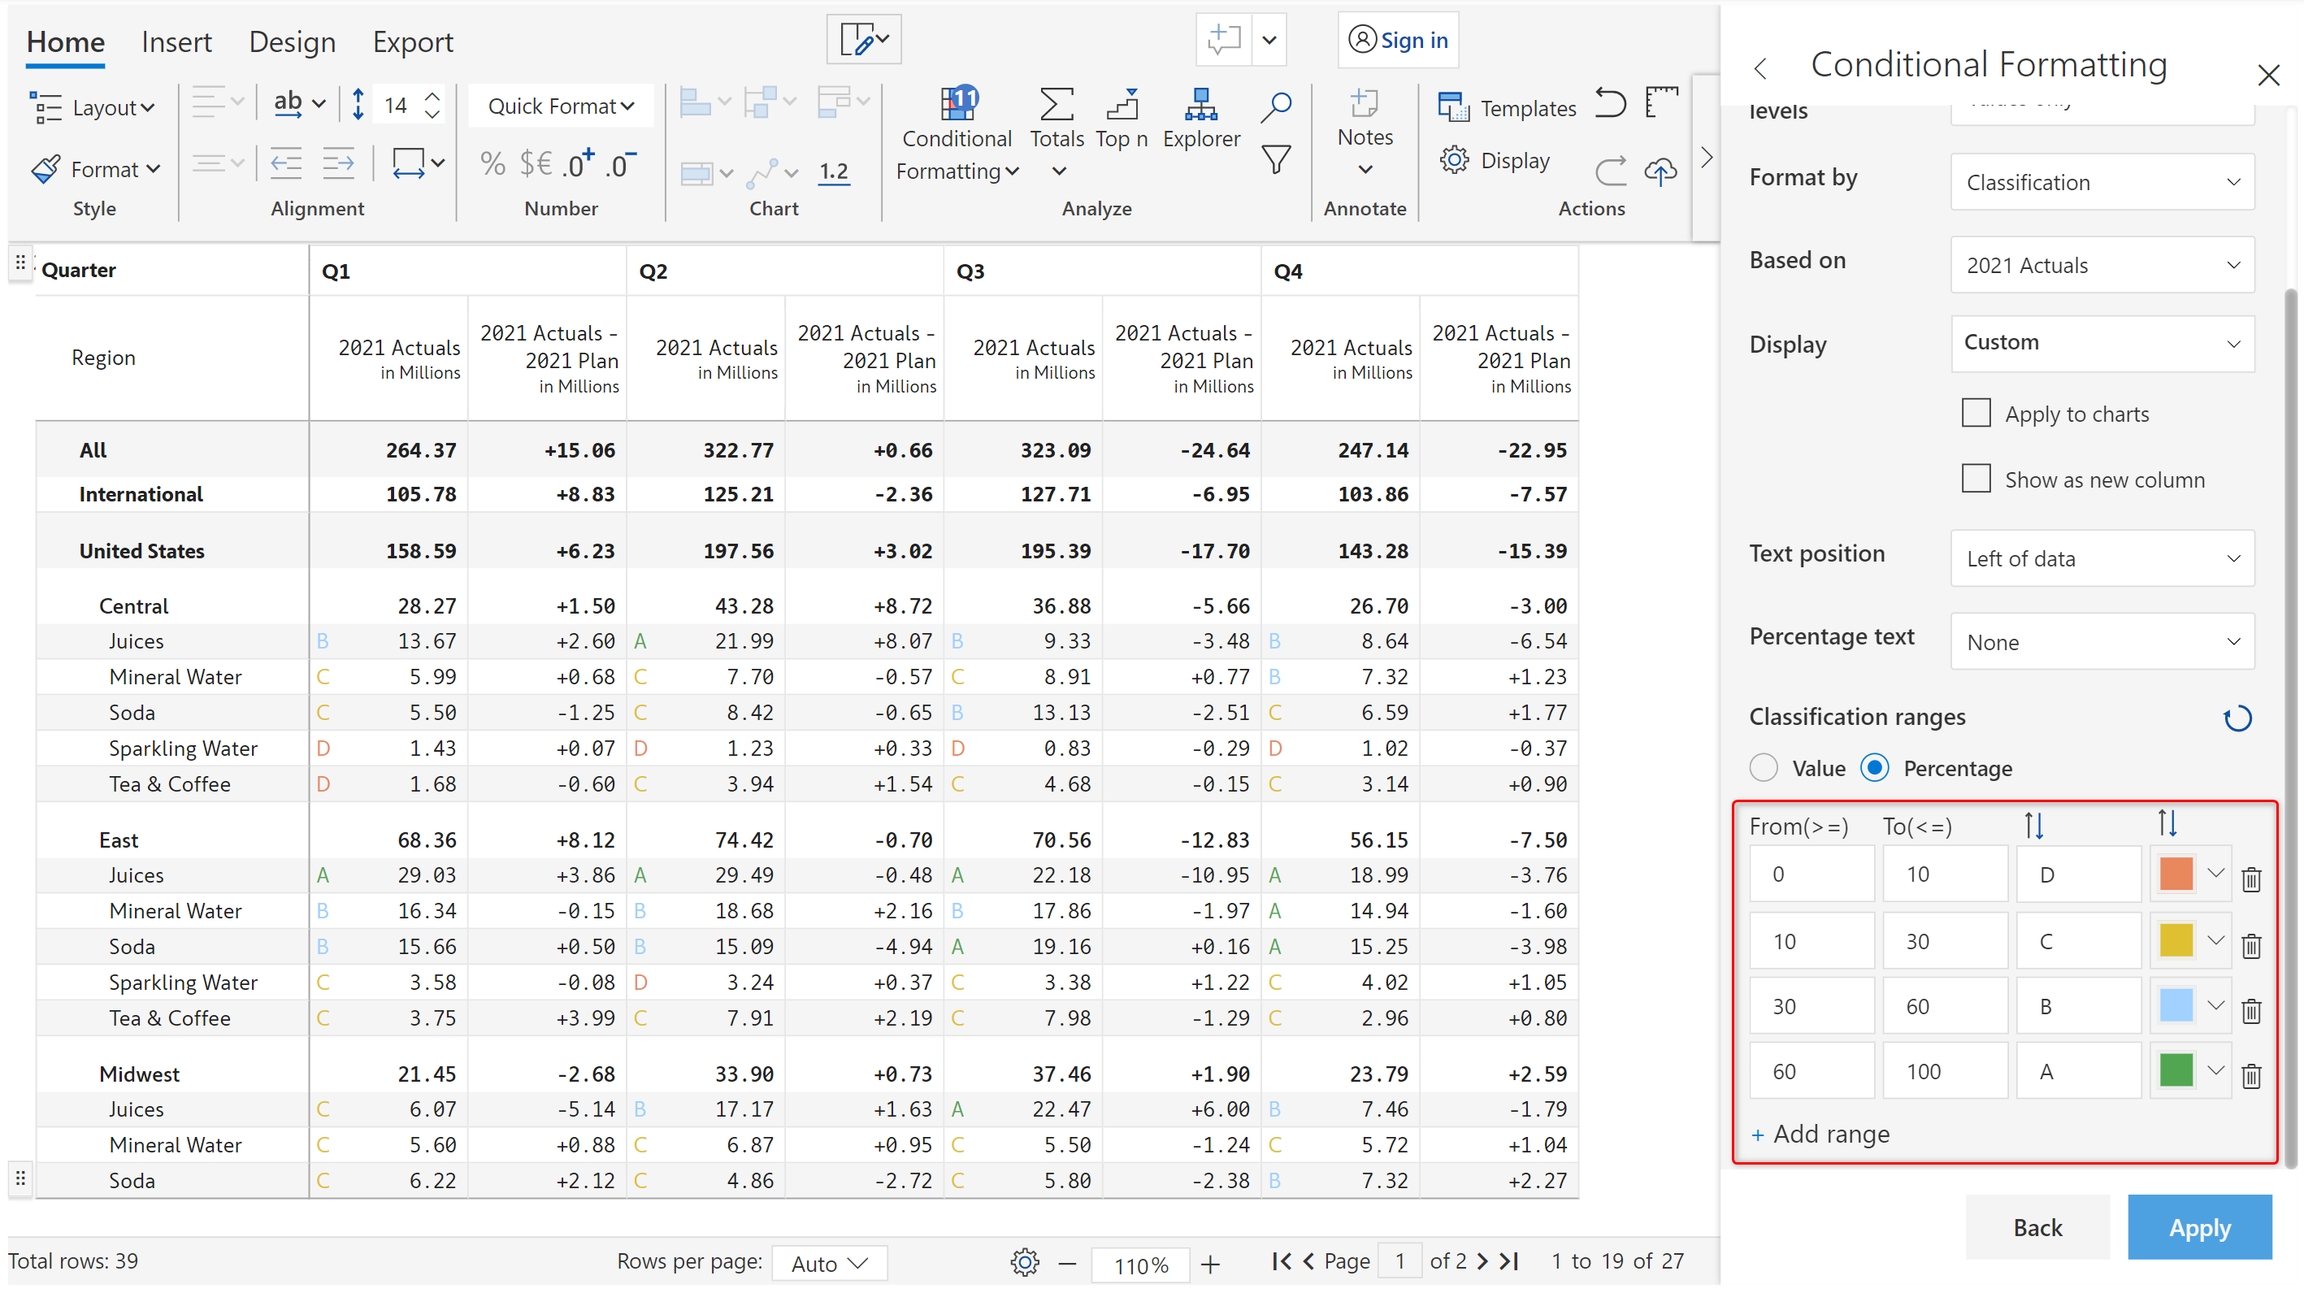
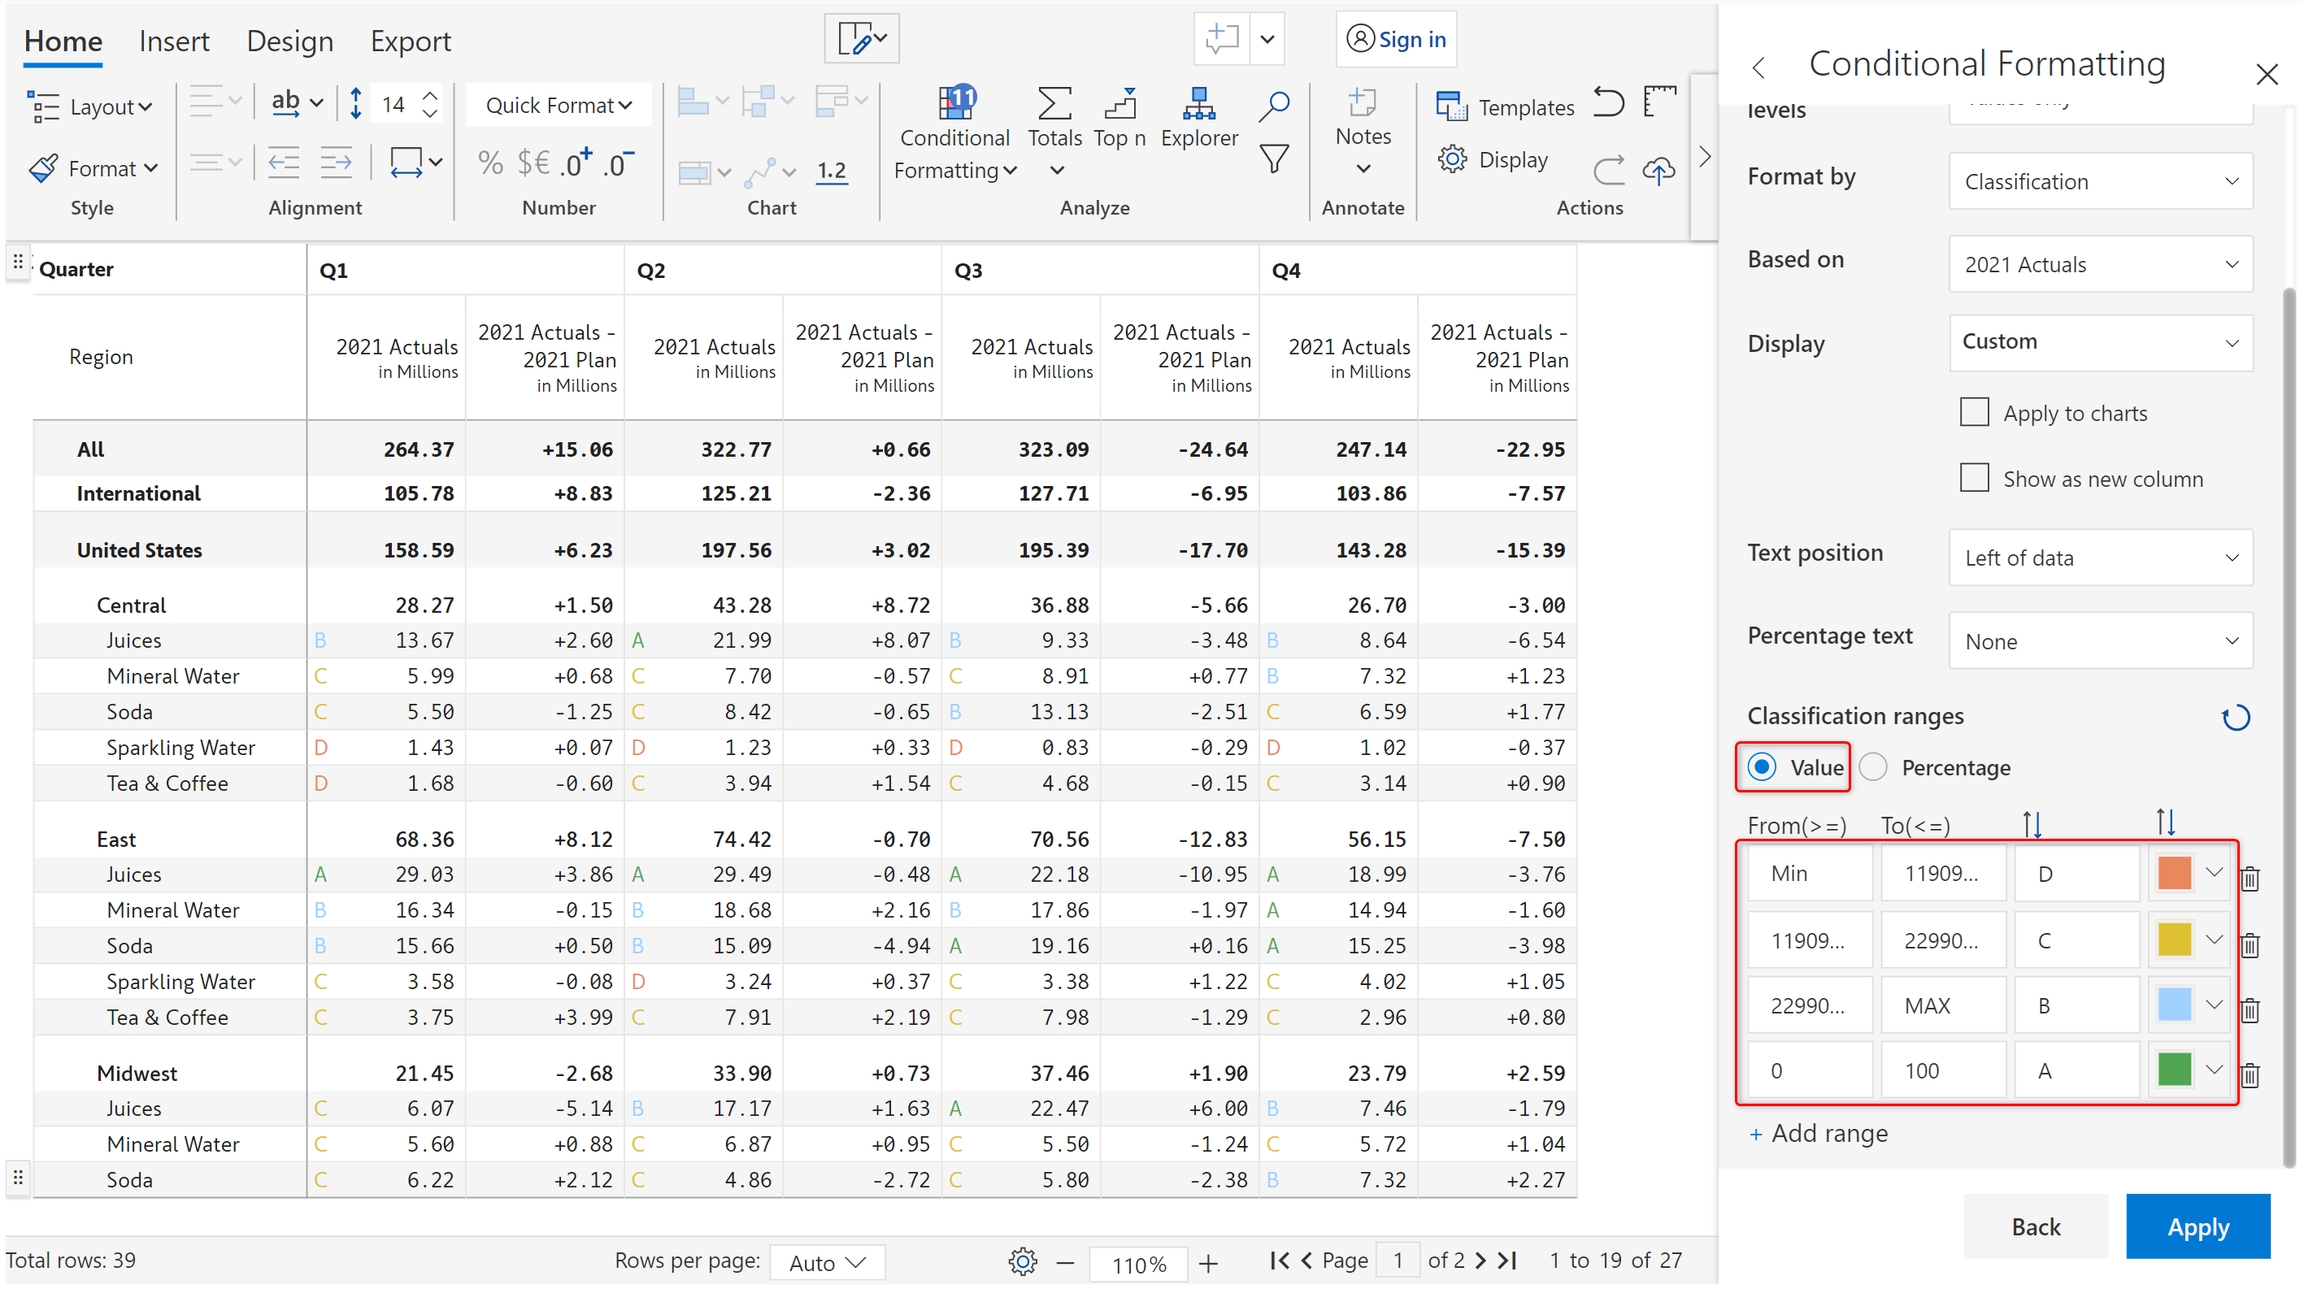
1.10. Ranges can also be defined using numeric values. Click on the 'Value' option. The values get populated automatically based on the defined percentages, but they can be further edited.
1.11. You can delete specific ranges or reset all changes using the icons highlighted in the below image.
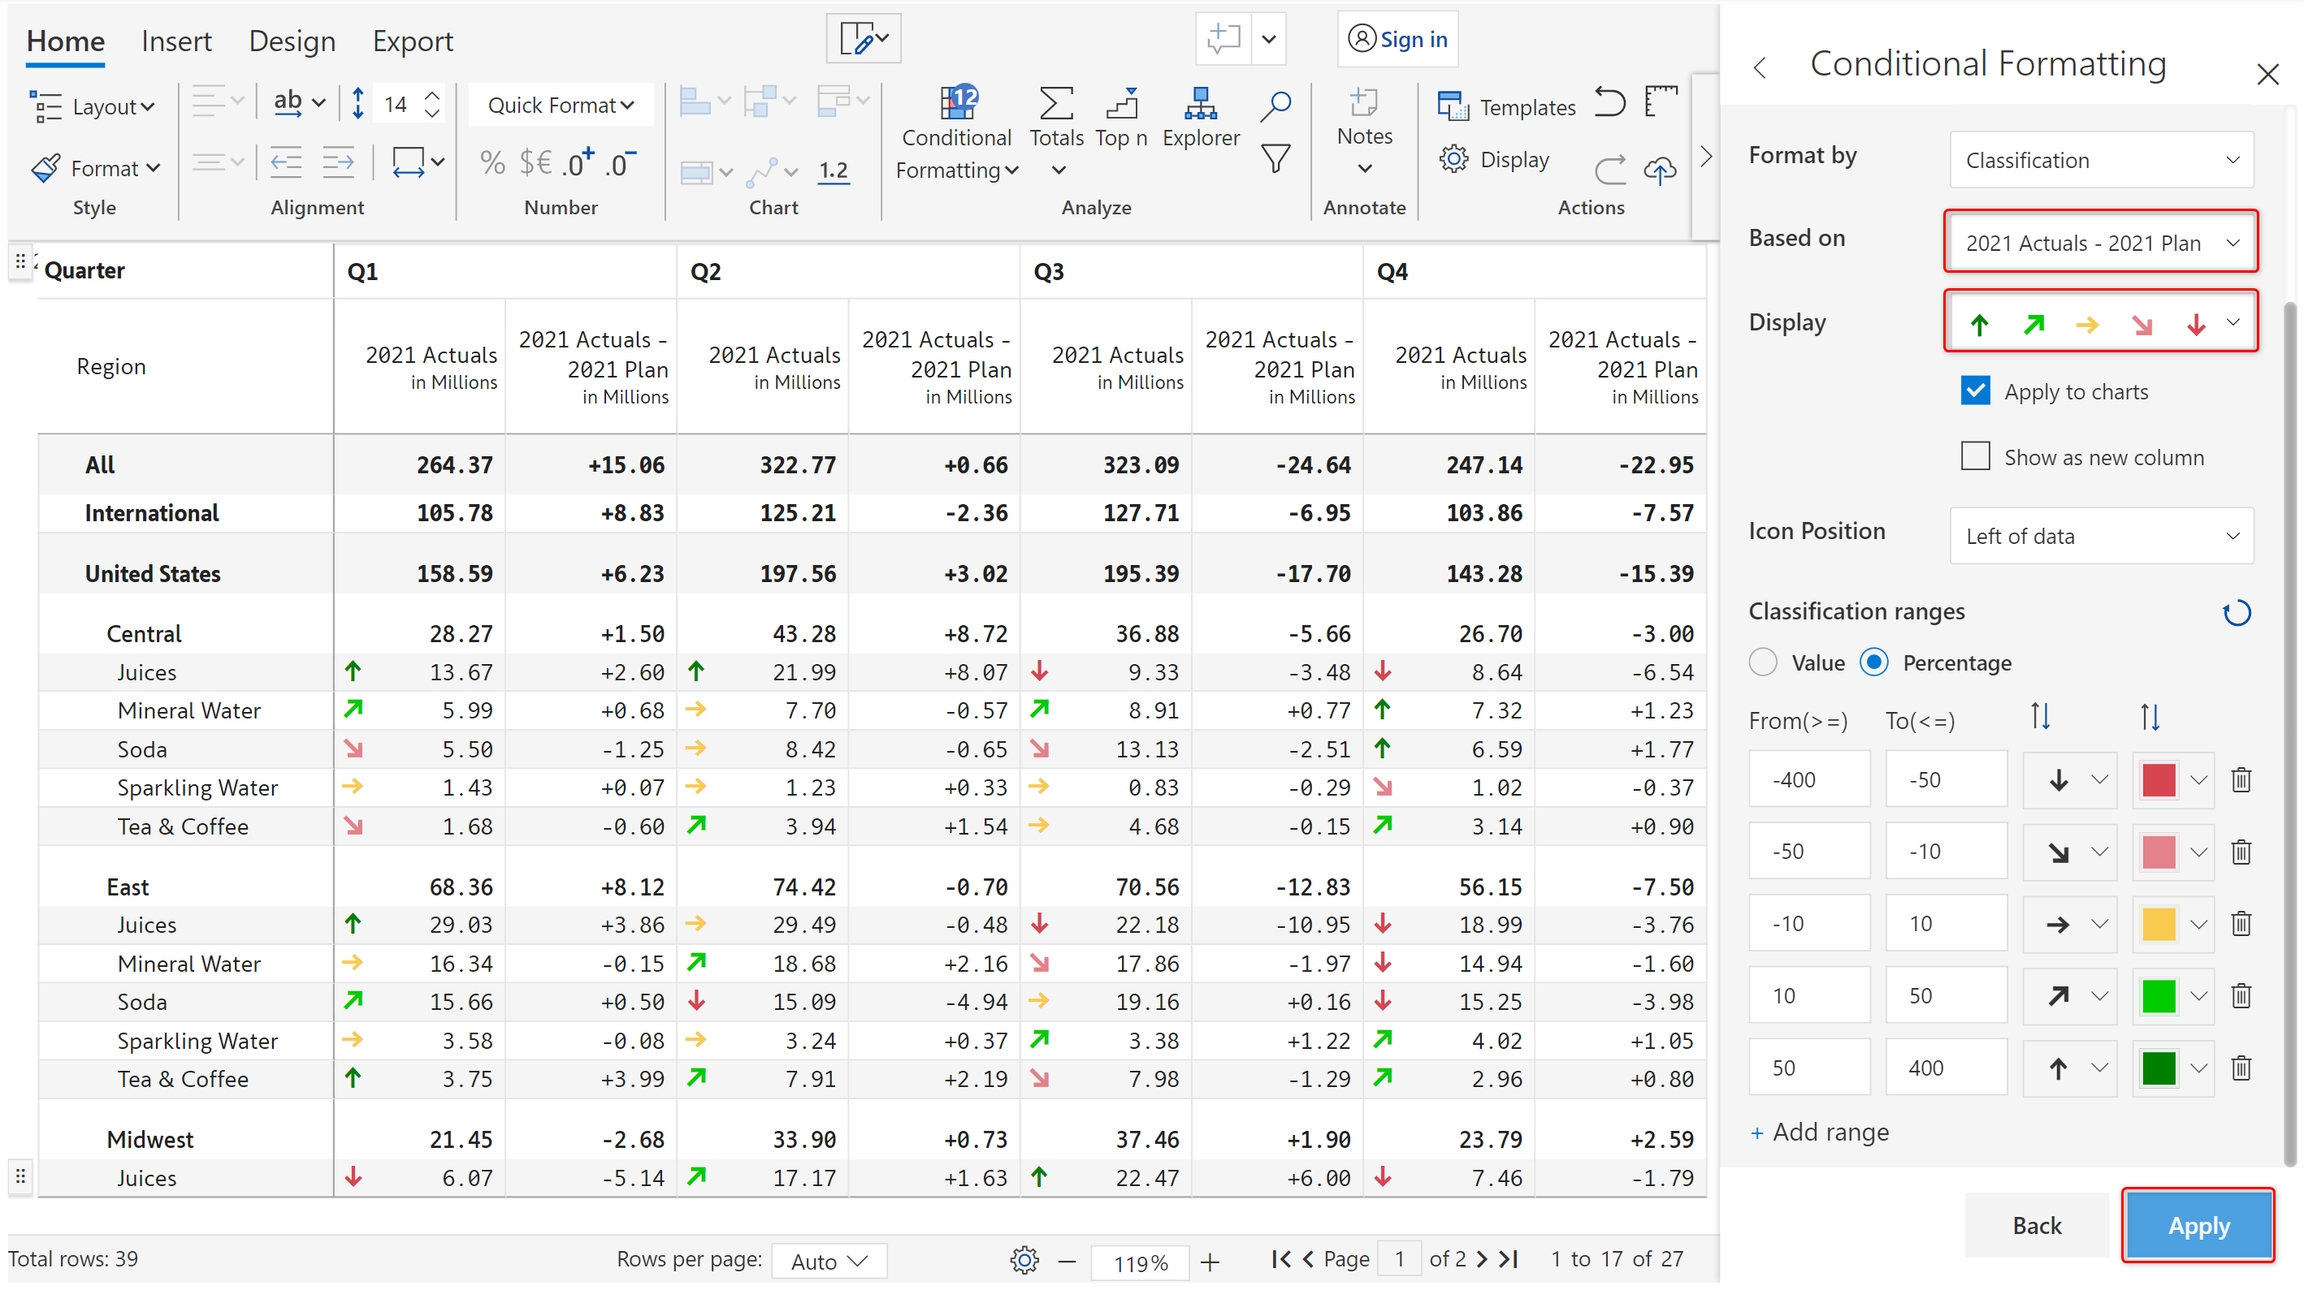
2. Icon set
Icon-based formatting provides the same properties as text-based formatting. Refer to Text for more details. We'll only at a simple example for icon sets.
In the 'Display' dropdown, choose the 'Five arrows' option. Click 'Apply'. Note that we have applied formatting to 2021 Actuals based on 2021 Actuals - 2021 Plan. Hence, we can see which categories have done worse/better than the plan.
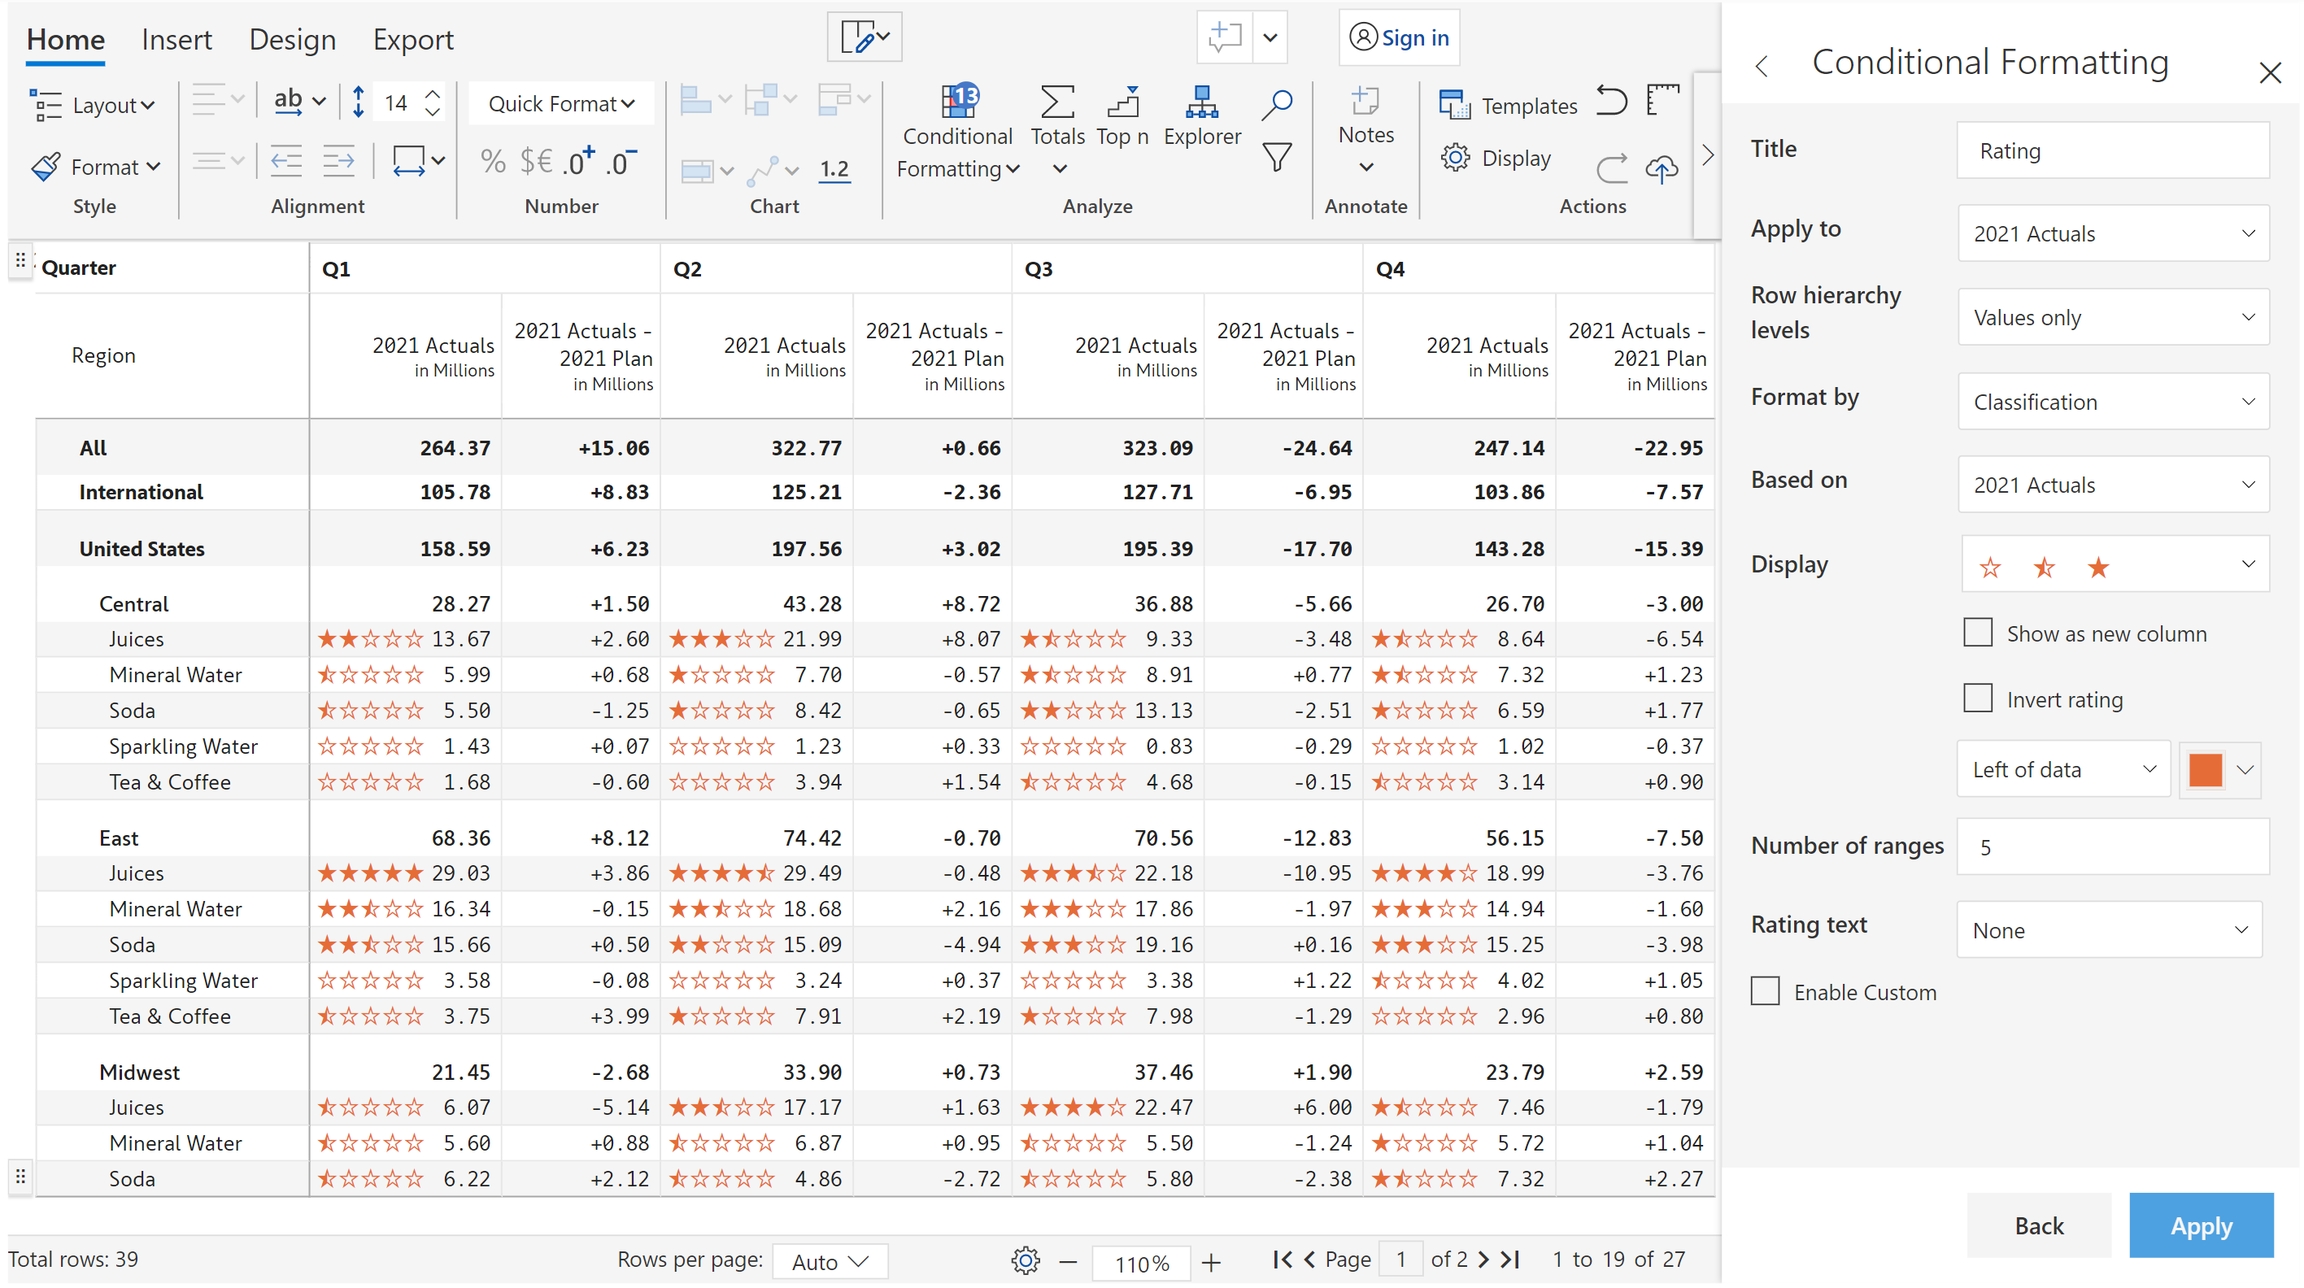
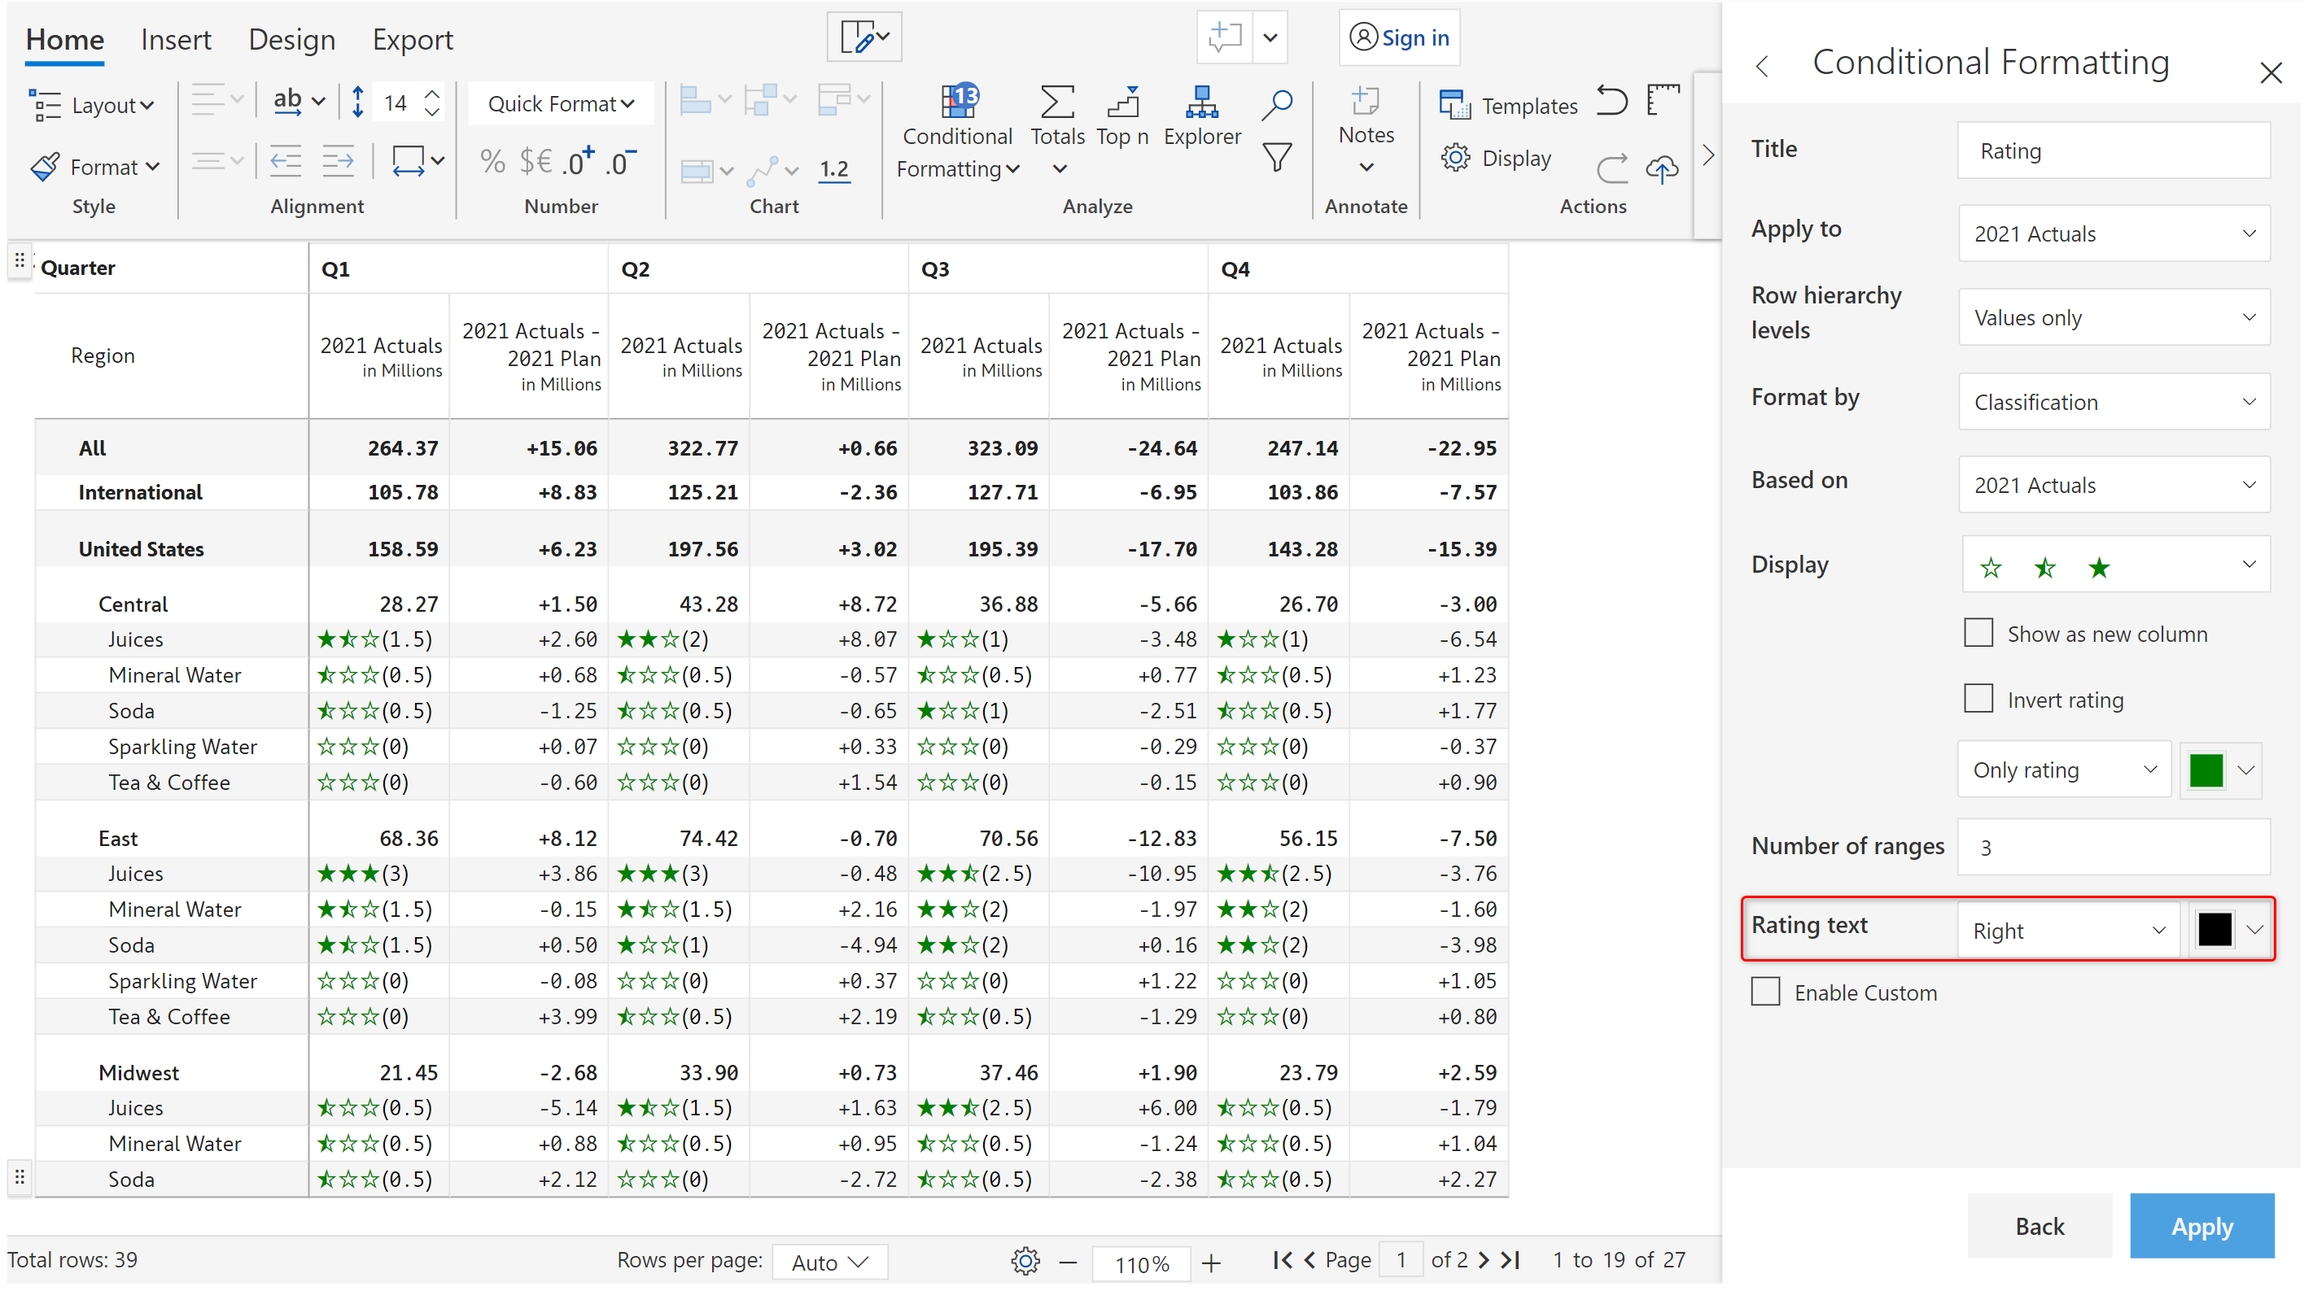
3. Rating
You can also use star-based ratings as seen in e-commerce sites in the product feedback section.
a) Select the '3 stars' option from the 'Display' dropdown and click 'Apply'.
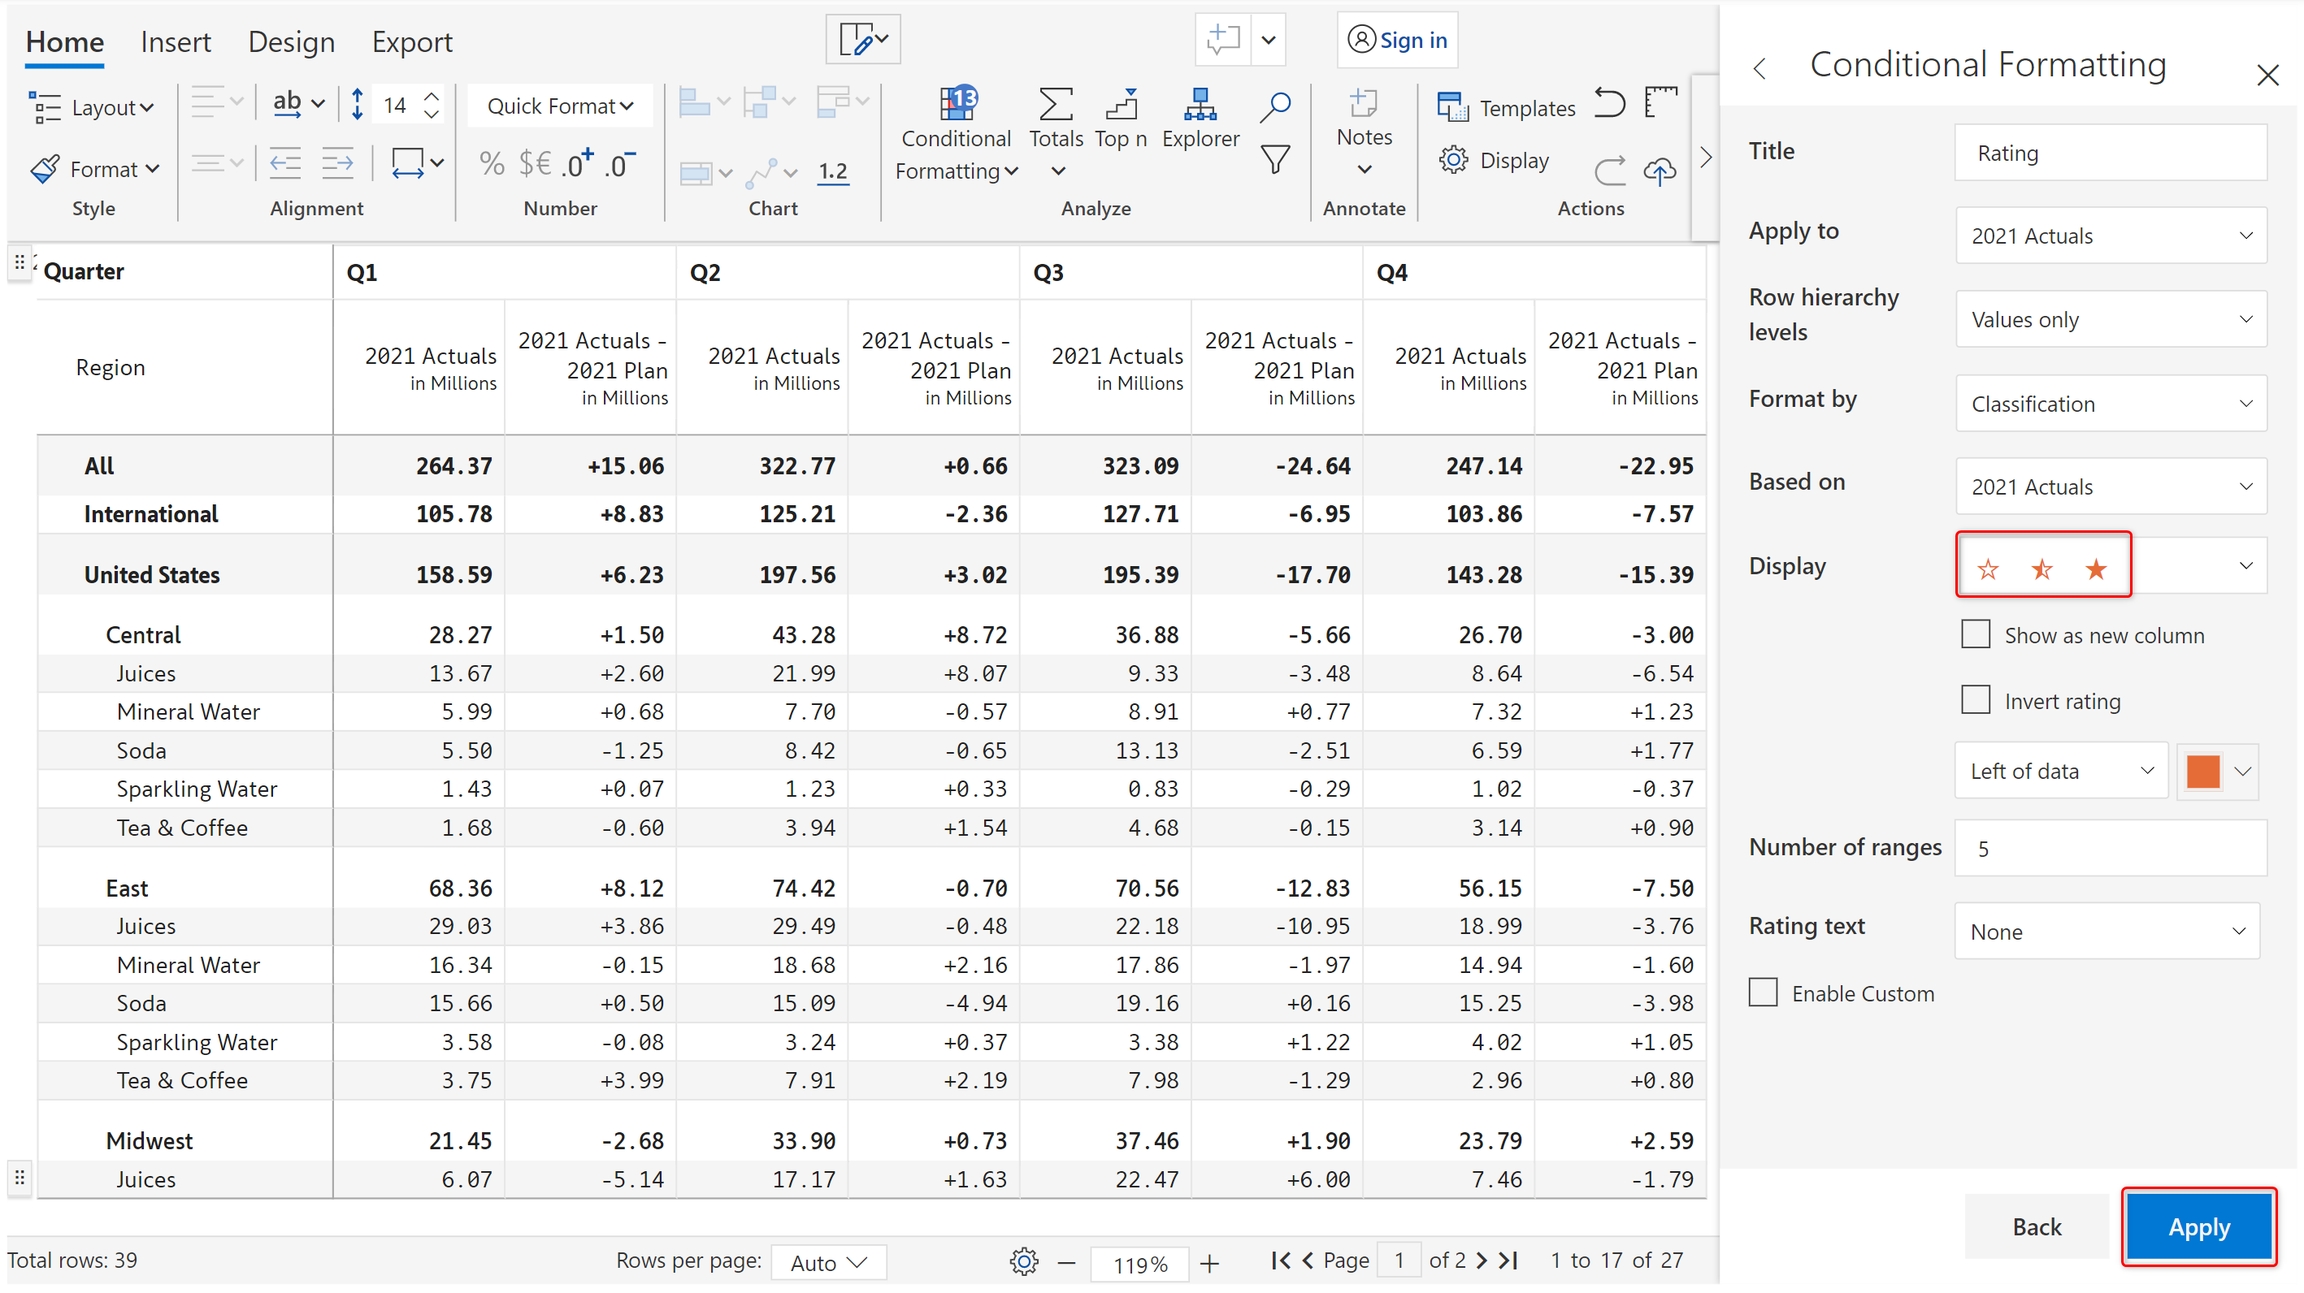
b) You can see the 1-5 rating icons on the left of the data. By default, the number of ranges has been set to 5.
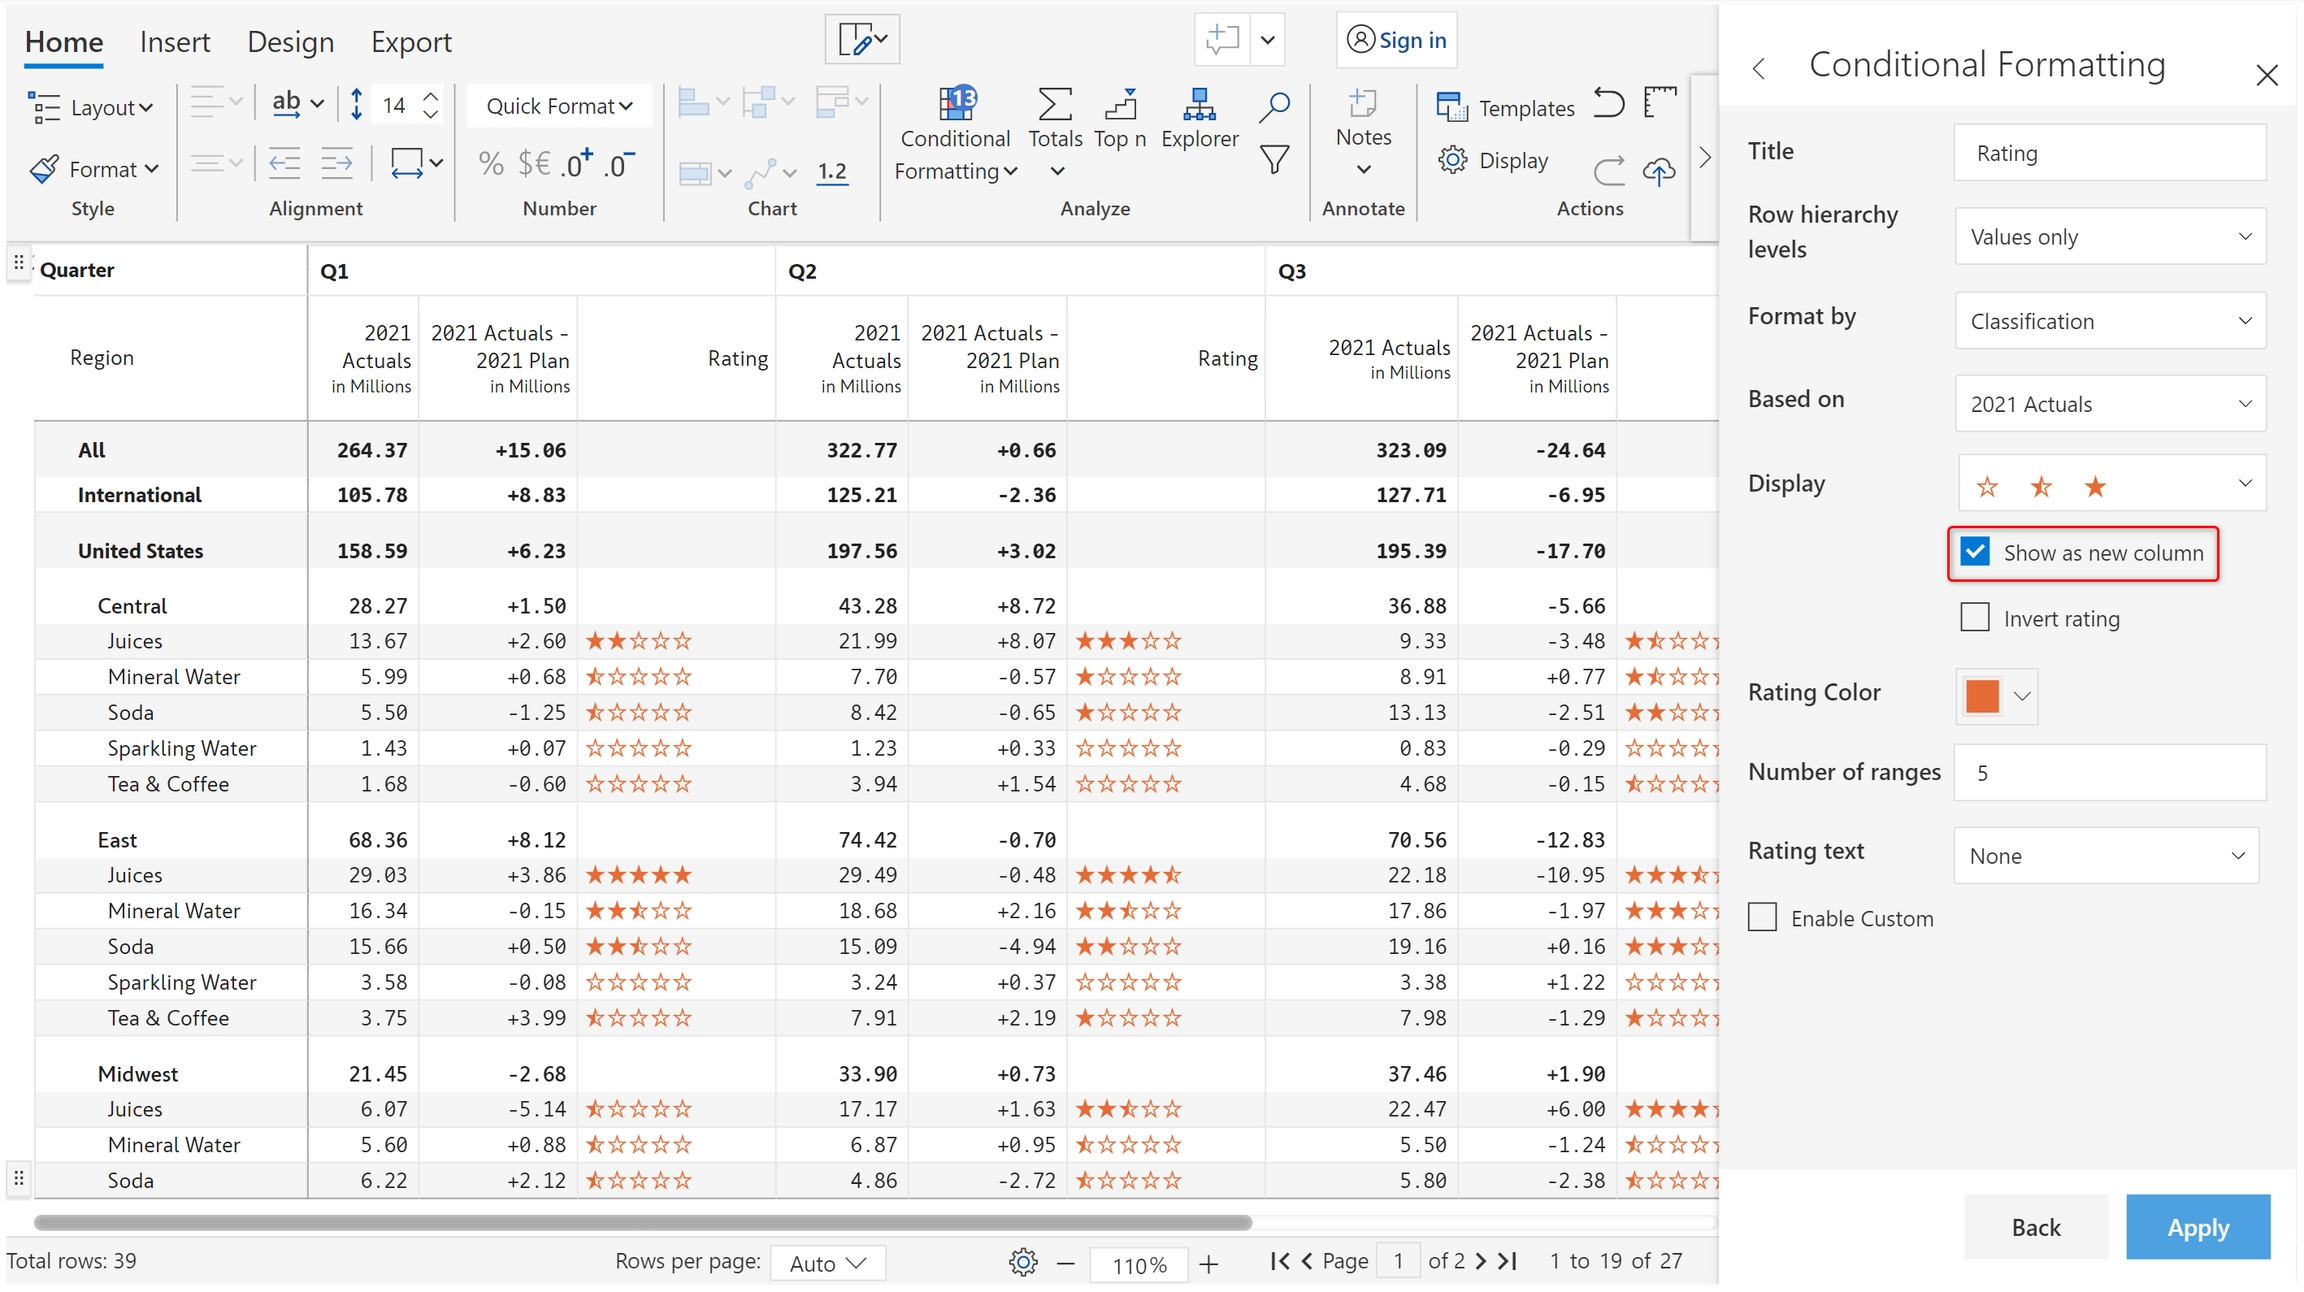
c) You can move the ratings to a separate column by clicking on the 'Show as new column' checkbox.
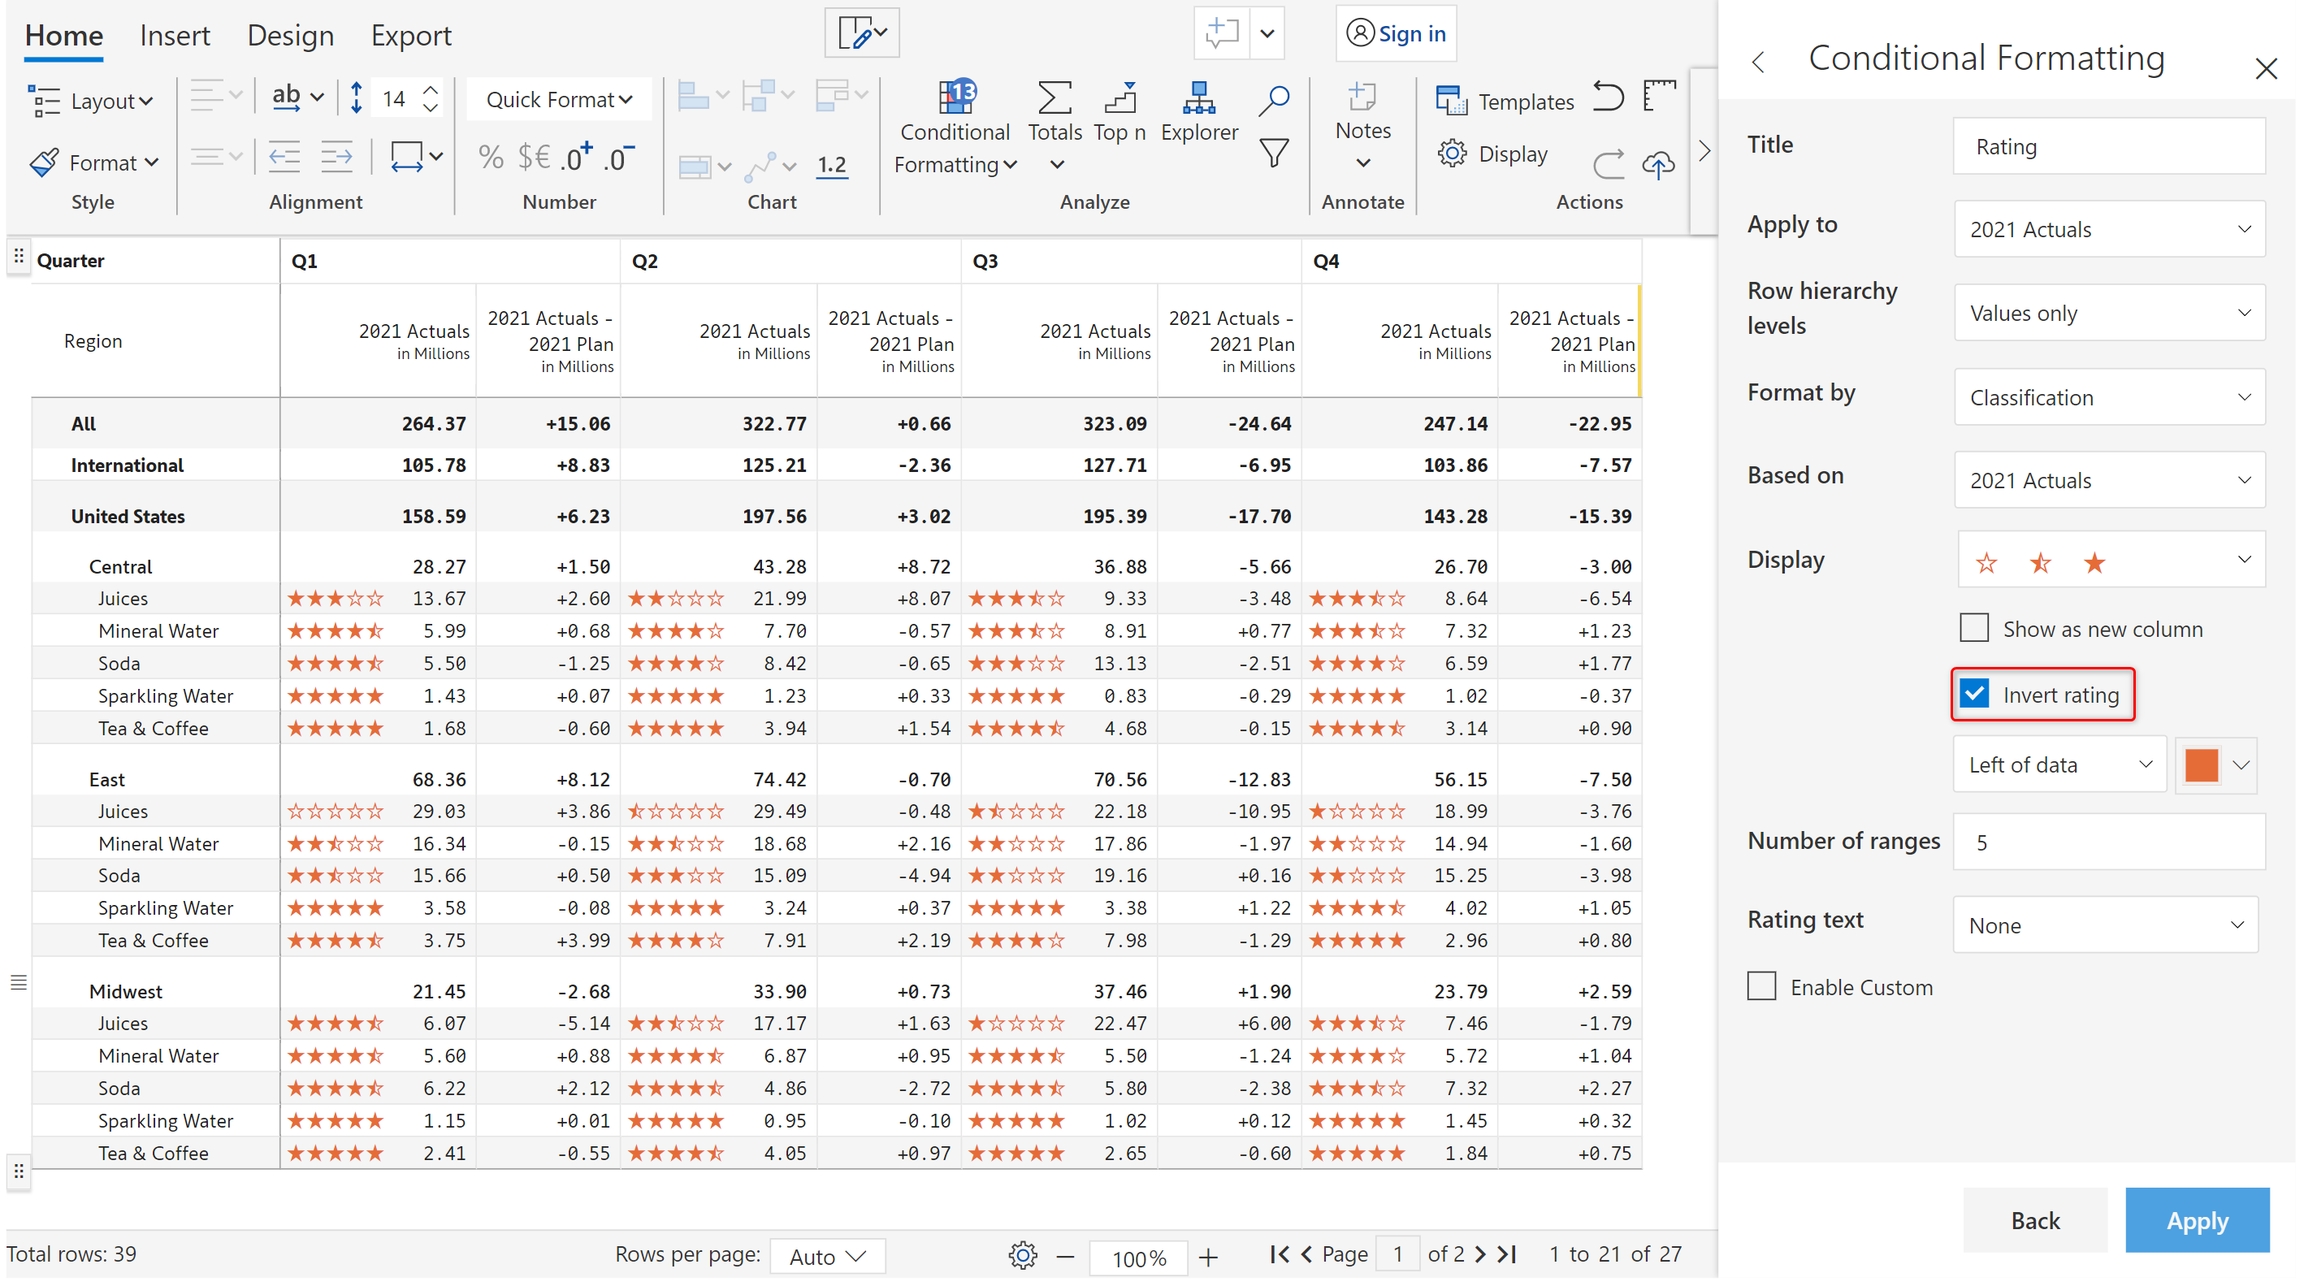
Invert rating
d) Check the 'Invert rating' checkbox in cases where higher values need to show lower ratings.
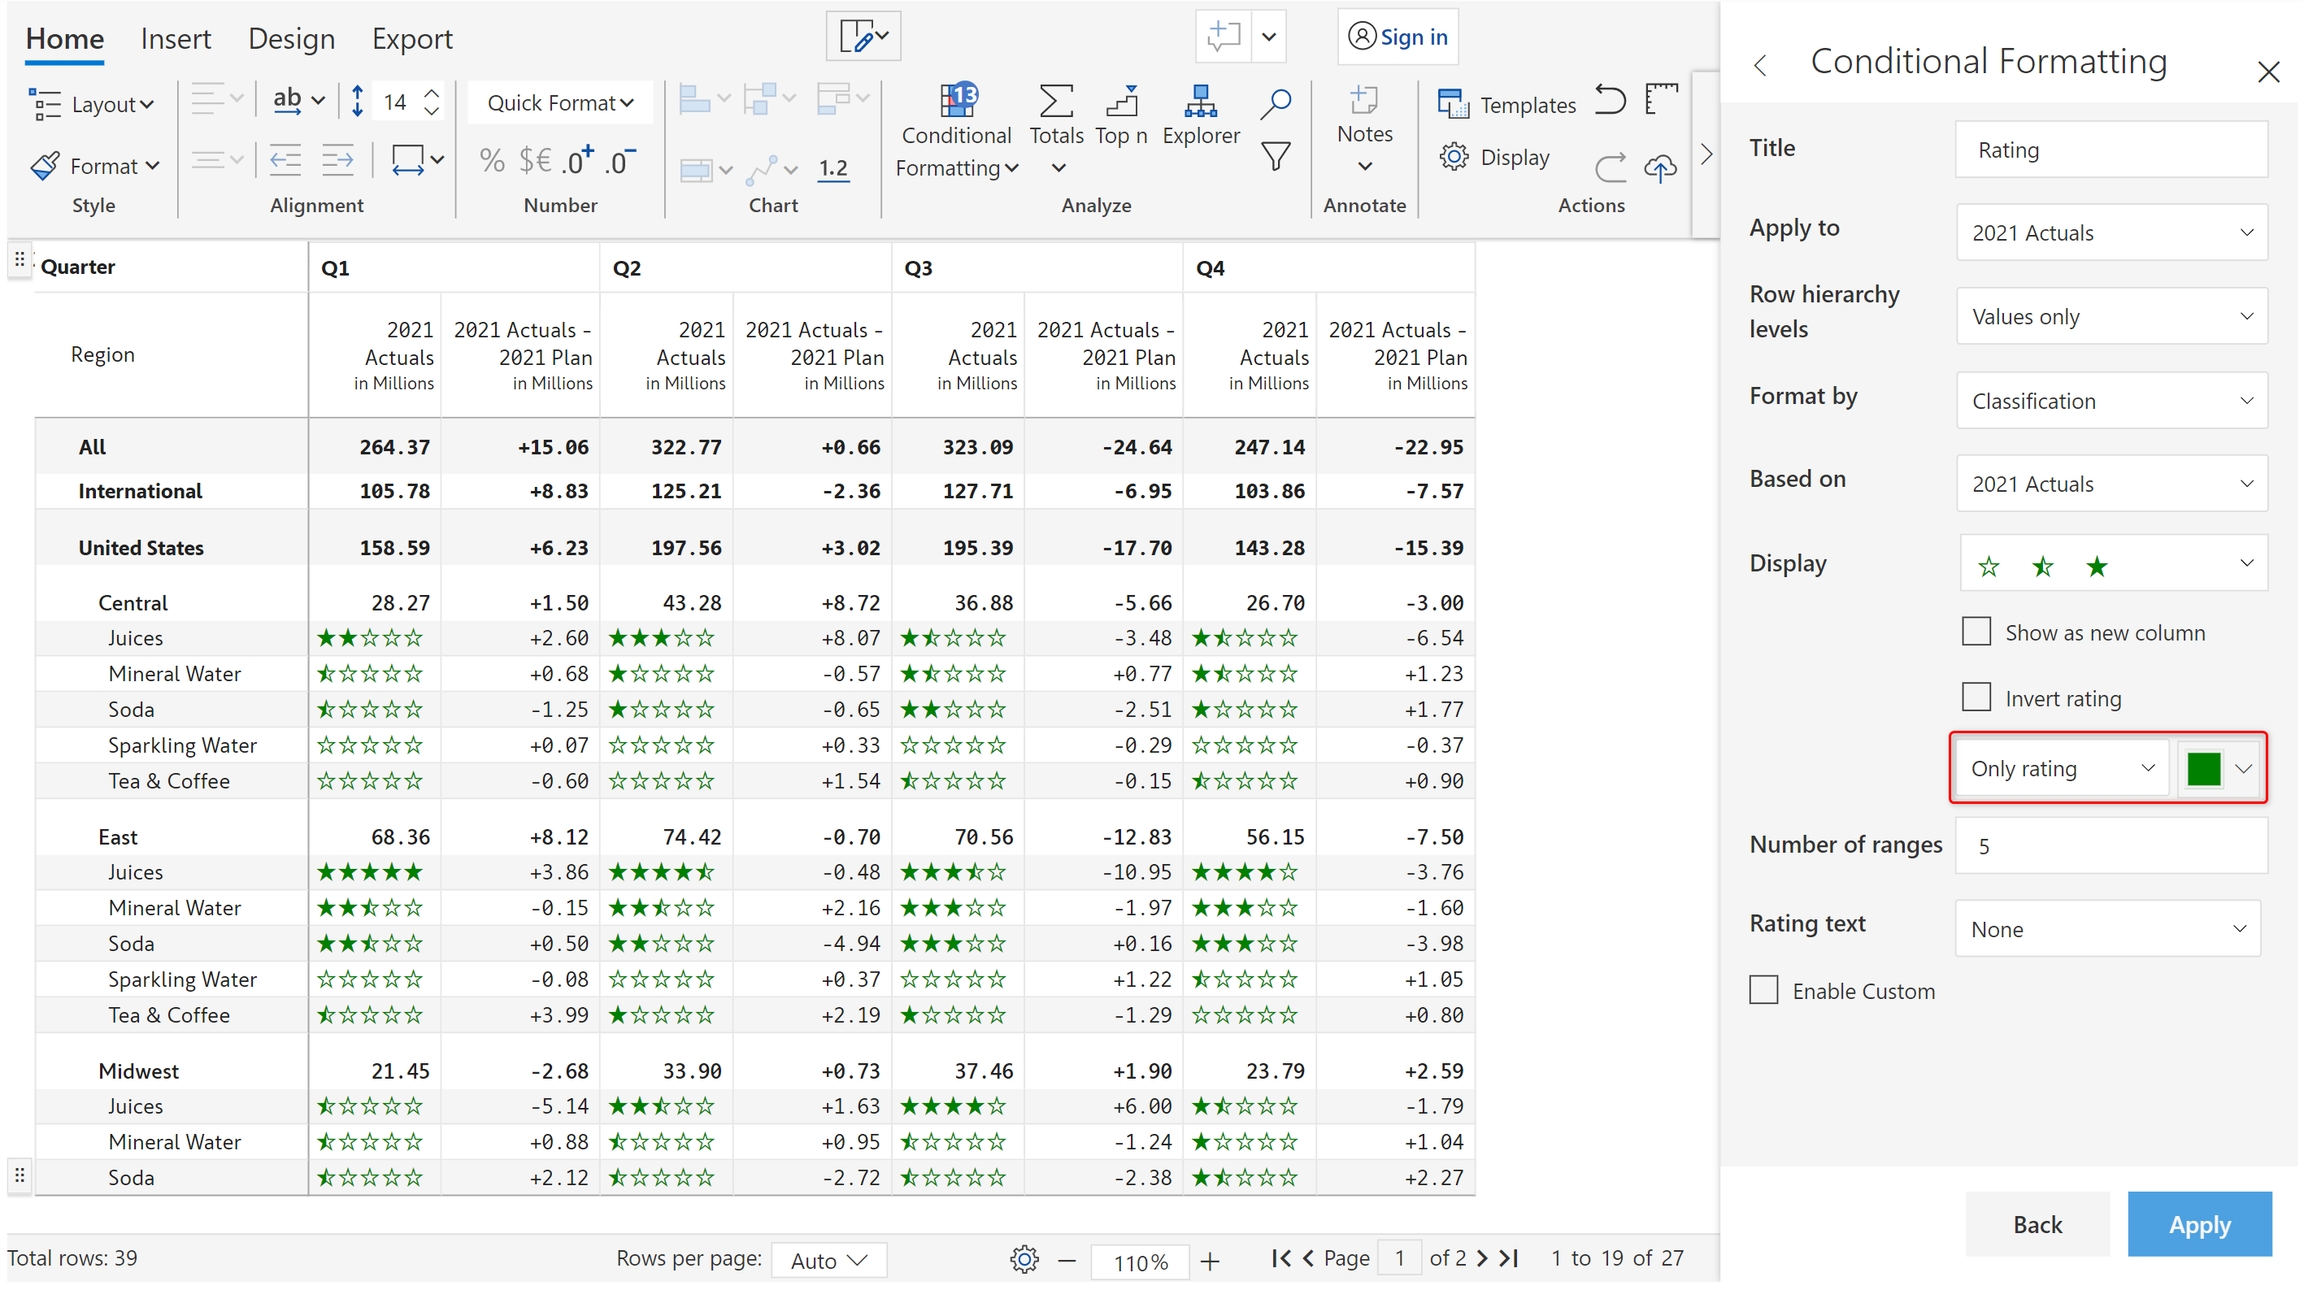
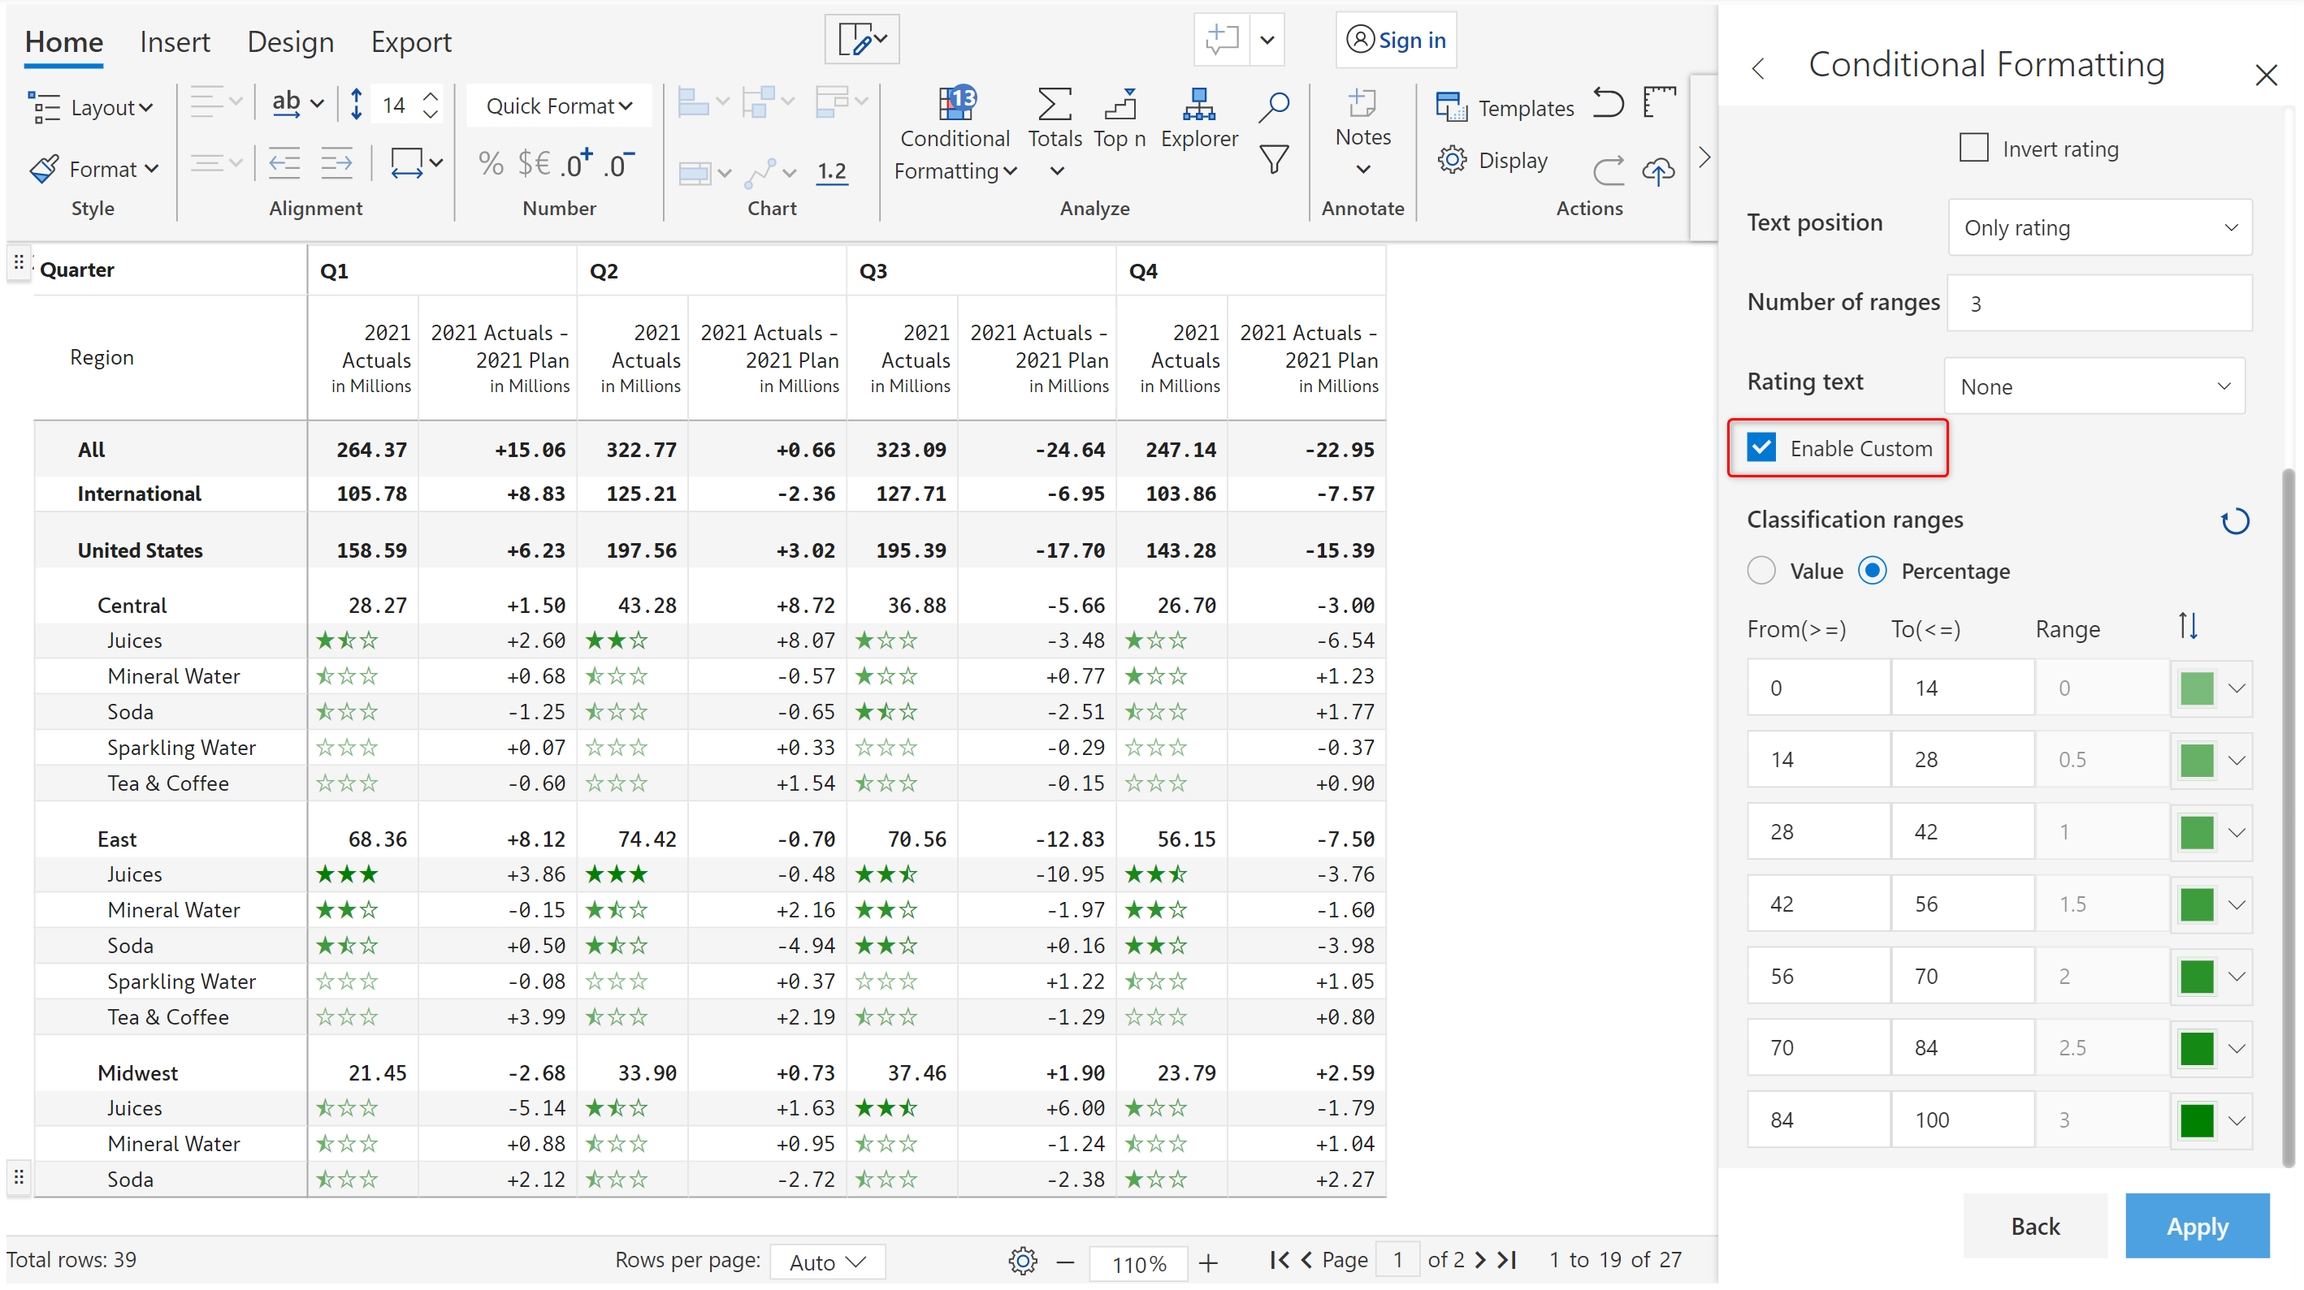
e) As seen in text and icon-based formatting, you can choose only to display the classification or change the position. In the below example, we have chosen the 'Only rating' option.
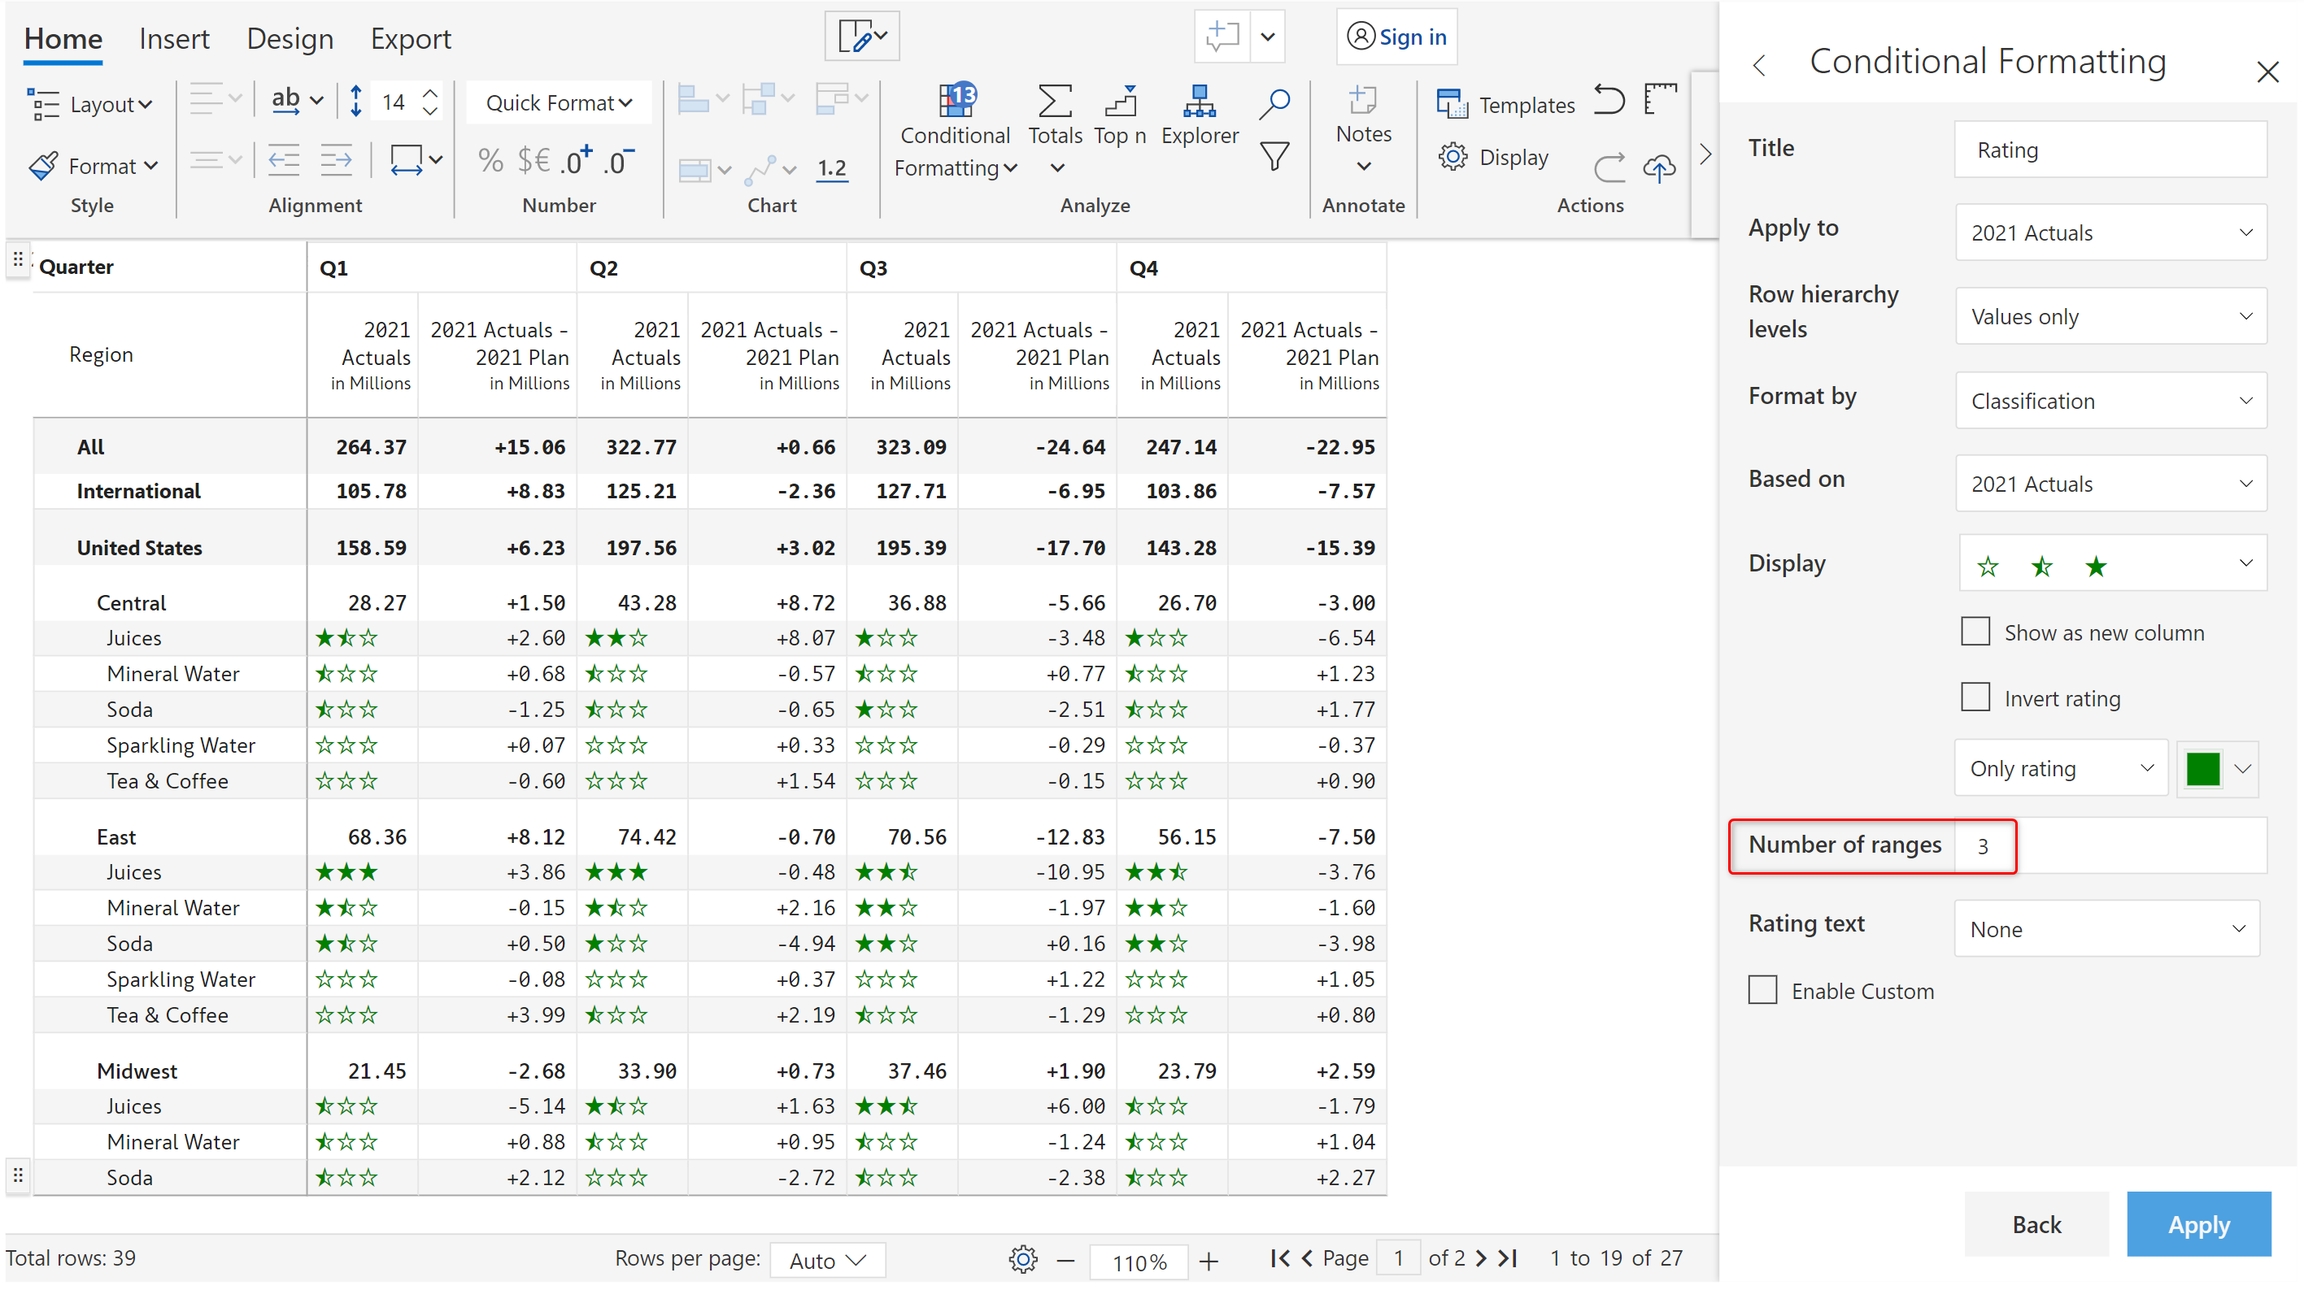
Number of ranges
f) You can customize the number of icons that appear in your scale – 'Number of ranges' has been set to 3 in this case.
g) The rating text can be shown on the left or right. Select the position and color as shown below.
Enable custom
h) In Inforiver, you have the option to configure value ranges for each of the ratings. Click on the 'Enable custom' checkbox. For every half rating, you'll be able to define percentage/value ranges in the 'From' and 'To' fields as shown in the below image.
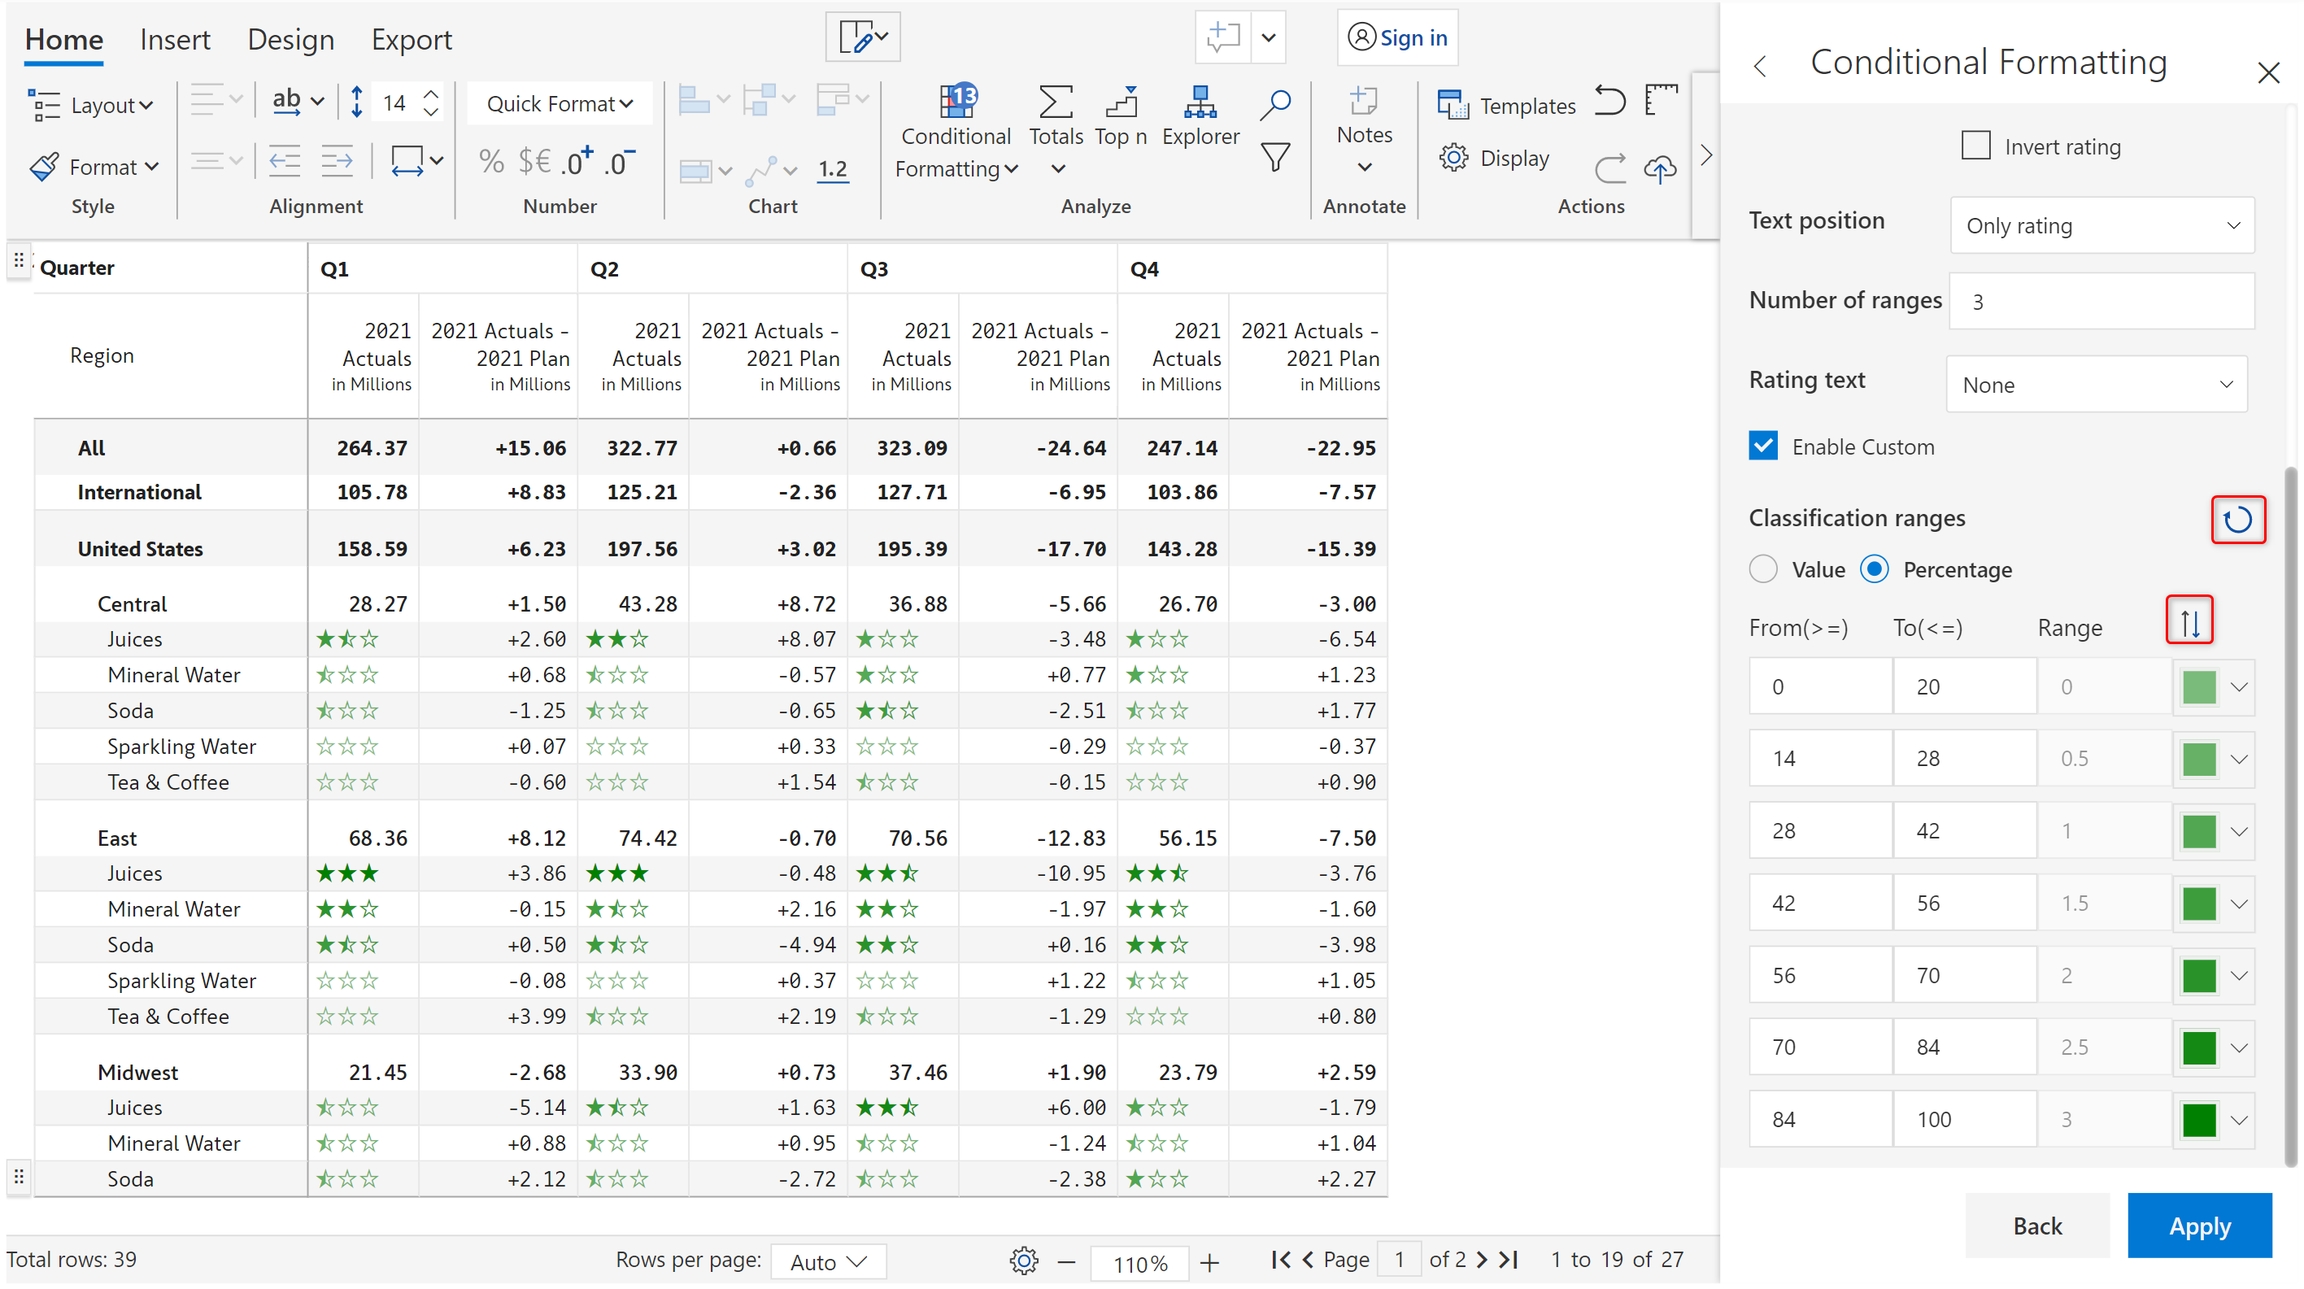
i) To reverse the order of colors and reset all changes to the ranges, click on the highlighted icons.
In the next section, let's look at Ranking.
Was this helpful?