> For the complete documentation index, see [llms.txt](https://docs.inforiver.com/llms.txt). Markdown versions of documentation pages are available by appending `.md` to page URLs; this page is available as [Markdown](https://docs.inforiver.com/~/changes/mS6jwvARNLHpKqBa4cT9/display-settings/hierarchy-settings.md).

# Hierarchy settings

The hierarchy display settings are used to customize the appearance of the hierarchies in the report.

In the Inforiver toolbar, navigate to the Home ribbon. The *Display* option is available in the Actions section. Clicking on this option will open the Display side panel.

Click on the Hierarchy tab in this panel to view the hierarchy settings.

<figure><img src="https://3062809325-files.gitbook.io/~/files/v0/b/gitbook-x-prod.appspot.com/o/spaces%2FEbkCXCUXmtUq5tcnUtZE%2Fuploads%2FcGZCkYh3TFZ2Cag3ryB0%2Fimage.png?alt=media&amp;token=b0936e37-8313-4e52-96a0-2667b88d5450" alt=""><figcaption></figcaption></figure>

Let's explore the options to customize hierarchies in your reports.

## 1. Header and Column

#### 1.1. Category highlight&#x20;

This drop-down lets you show or hide the category highlight. This option is set to 'Off' by default. When this option is enabled, a color picker is displayed. You can select a color to highlight the category hierarchy.

<figure><img src="https://3062809325-files.gitbook.io/~/files/v0/b/gitbook-x-prod.appspot.com/o/spaces%2FEbkCXCUXmtUq5tcnUtZE%2Fuploads%2F6YaLLRkonDMeA9KqPRo3%2Fimage.png?alt=media&amp;token=be5f3464-e5e7-4453-9058-0c75fac53730" alt=""><figcaption><p>Cateory highlight</p></figcaption></figure>

#### 1.2. Responsive columns&#x20;

If this option is enabled, when the report canvas is resized to a small size, only columns that fit into the canvas will be displayed and others will be hidden.

<figure><img src="https://3062809325-files.gitbook.io/~/files/v0/b/gitbook-x-prod.appspot.com/o/spaces%2FEbkCXCUXmtUq5tcnUtZE%2Fuploads%2FSWn1ItDBbfKcxb8Cheey%2Fimage.png?alt=media&amp;token=44607b2f-dcb9-4c27-8729-b2848877006a" alt=""><figcaption><p>Responsive columns</p></figcaption></figure>

In the image below, after resizing the canvas to a much smaller size, out of the 3 measures added in the report, only 2 measures that fit into the view are displayed. This is because the responsive columns option is enabled.

<figure><img src="https://3062809325-files.gitbook.io/~/files/v0/b/gitbook-x-prod.appspot.com/o/spaces%2FEbkCXCUXmtUq5tcnUtZE%2Fuploads%2FsbaZIfxNbWsgWGzPz5JE%2Fimage.png?alt=media&amp;token=da49c3f7-80b3-41c9-984b-d1267186afd9" alt=""><figcaption><p>Report with responsive columns enabled</p></figcaption></figure>

#### 1.3. Show totals/subtotals values for non-numeric measures

You can add non-numeric measures like dates and text fields and display them in your reports. The first value is displayed in the total/subtotal cell by default, which may be irrelevant in an aggregated row. You can choose to leave the totals and subtotals blank for non-numeric fields by enabling this property.

<div><figure><img src="https://3062809325-files.gitbook.io/~/files/v0/b/gitbook-x-prod.appspot.com/o/spaces%2FEbkCXCUXmtUq5tcnUtZE%2Fuploads%2FeTn5iTbPQzltfTPuNNRC%2Fimage.png?alt=media&amp;token=8357f1d3-c9b0-4687-b8ba-2da002cdba1c" alt=""><figcaption><p>Non-numeric fields displayed as totals/subtotals</p></figcaption></figure> <figure><img src="https://3062809325-files.gitbook.io/~/files/v0/b/gitbook-x-prod.appspot.com/o/spaces%2FEbkCXCUXmtUq5tcnUtZE%2Fuploads%2FKCc0EM2wuLp2mvrN4Nza%2Fnumeric%20non-numeric.png?alt=media&amp;token=ca365759-4065-423c-abd1-3514fb3d226d" alt=""><figcaption><p>Totals/subtotals left blank for non-numeric fields</p></figcaption></figure></div>

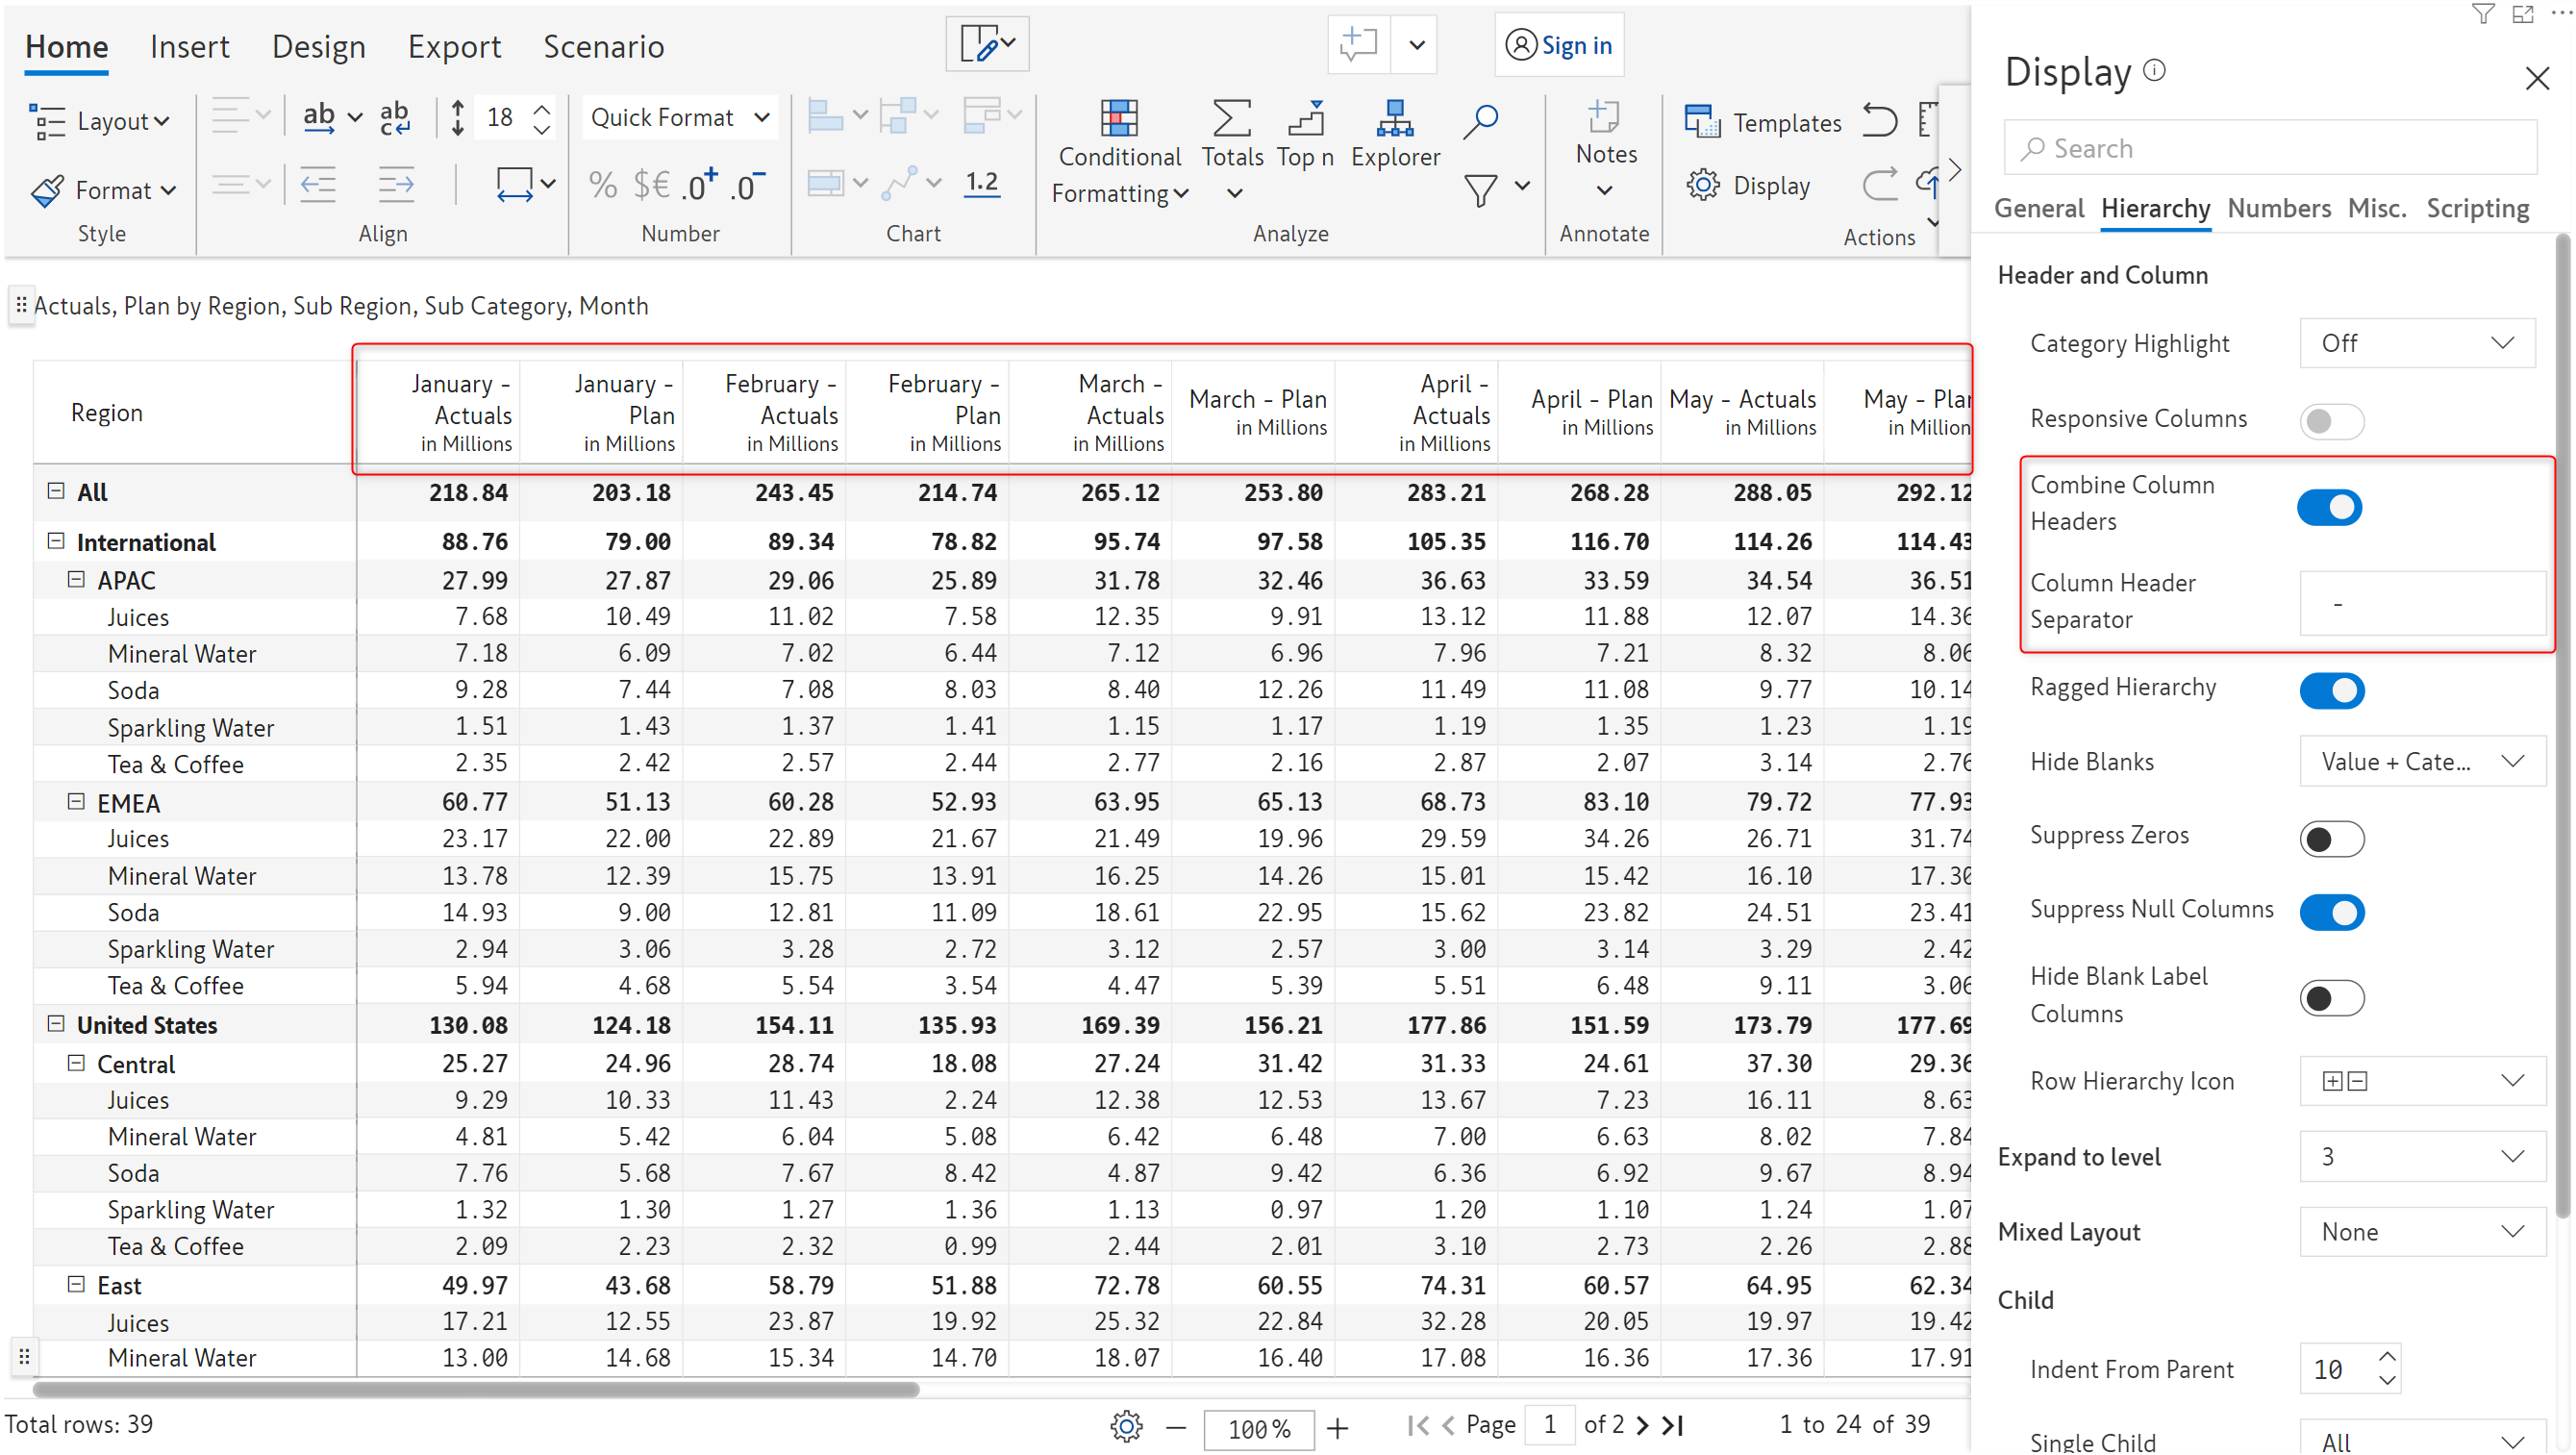
#### 1.4. Combine column headers&#x20;

Enabling this option will combine the column headers and measure labels to display compact headers. As you can see from the below image, when this option is turned off, the column headers and measure labels are displayed separately.

<figure><img src="https://3062809325-files.gitbook.io/~/files/v0/b/gitbook-x-prod.appspot.com/o/spaces%2FEbkCXCUXmtUq5tcnUtZE%2Fuploads%2FHykKdxsWhUNE1XIaWiHL%2Fimage.png?alt=media&amp;token=b7f1ebee-dd08-45c5-a501-b8a0ad465eba" alt=""><figcaption><p>Combine column headers</p></figcaption></figure>

When this option is enabled, the column headers and measure labels are combined and displayed compactly. If the *Combine Column Header* option is enabled, you can set a custom separator using the *Column header separator* option.

<figure><img src="https://3062809325-files.gitbook.io/~/files/v0/b/gitbook-x-prod.appspot.com/o/spaces%2FEbkCXCUXmtUq5tcnUtZE%2Fuploads%2FNVkRyGvfyNRWlJbtDfW5%2Fimage.png?alt=media&amp;token=ad2ac0c9-c541-4df5-af31-2403cfebc1fe" alt=""><figcaption><p>Combine column headers</p></figcaption></figure>

{% hint style="warning" %}
If the 'Combine column headers' option is enabled, you won't be able to reorder the columns.
{% endhint %}

#### Column header separator&#x20;

This option lets you specify the separator that will get inserted between the column header and the measure label.

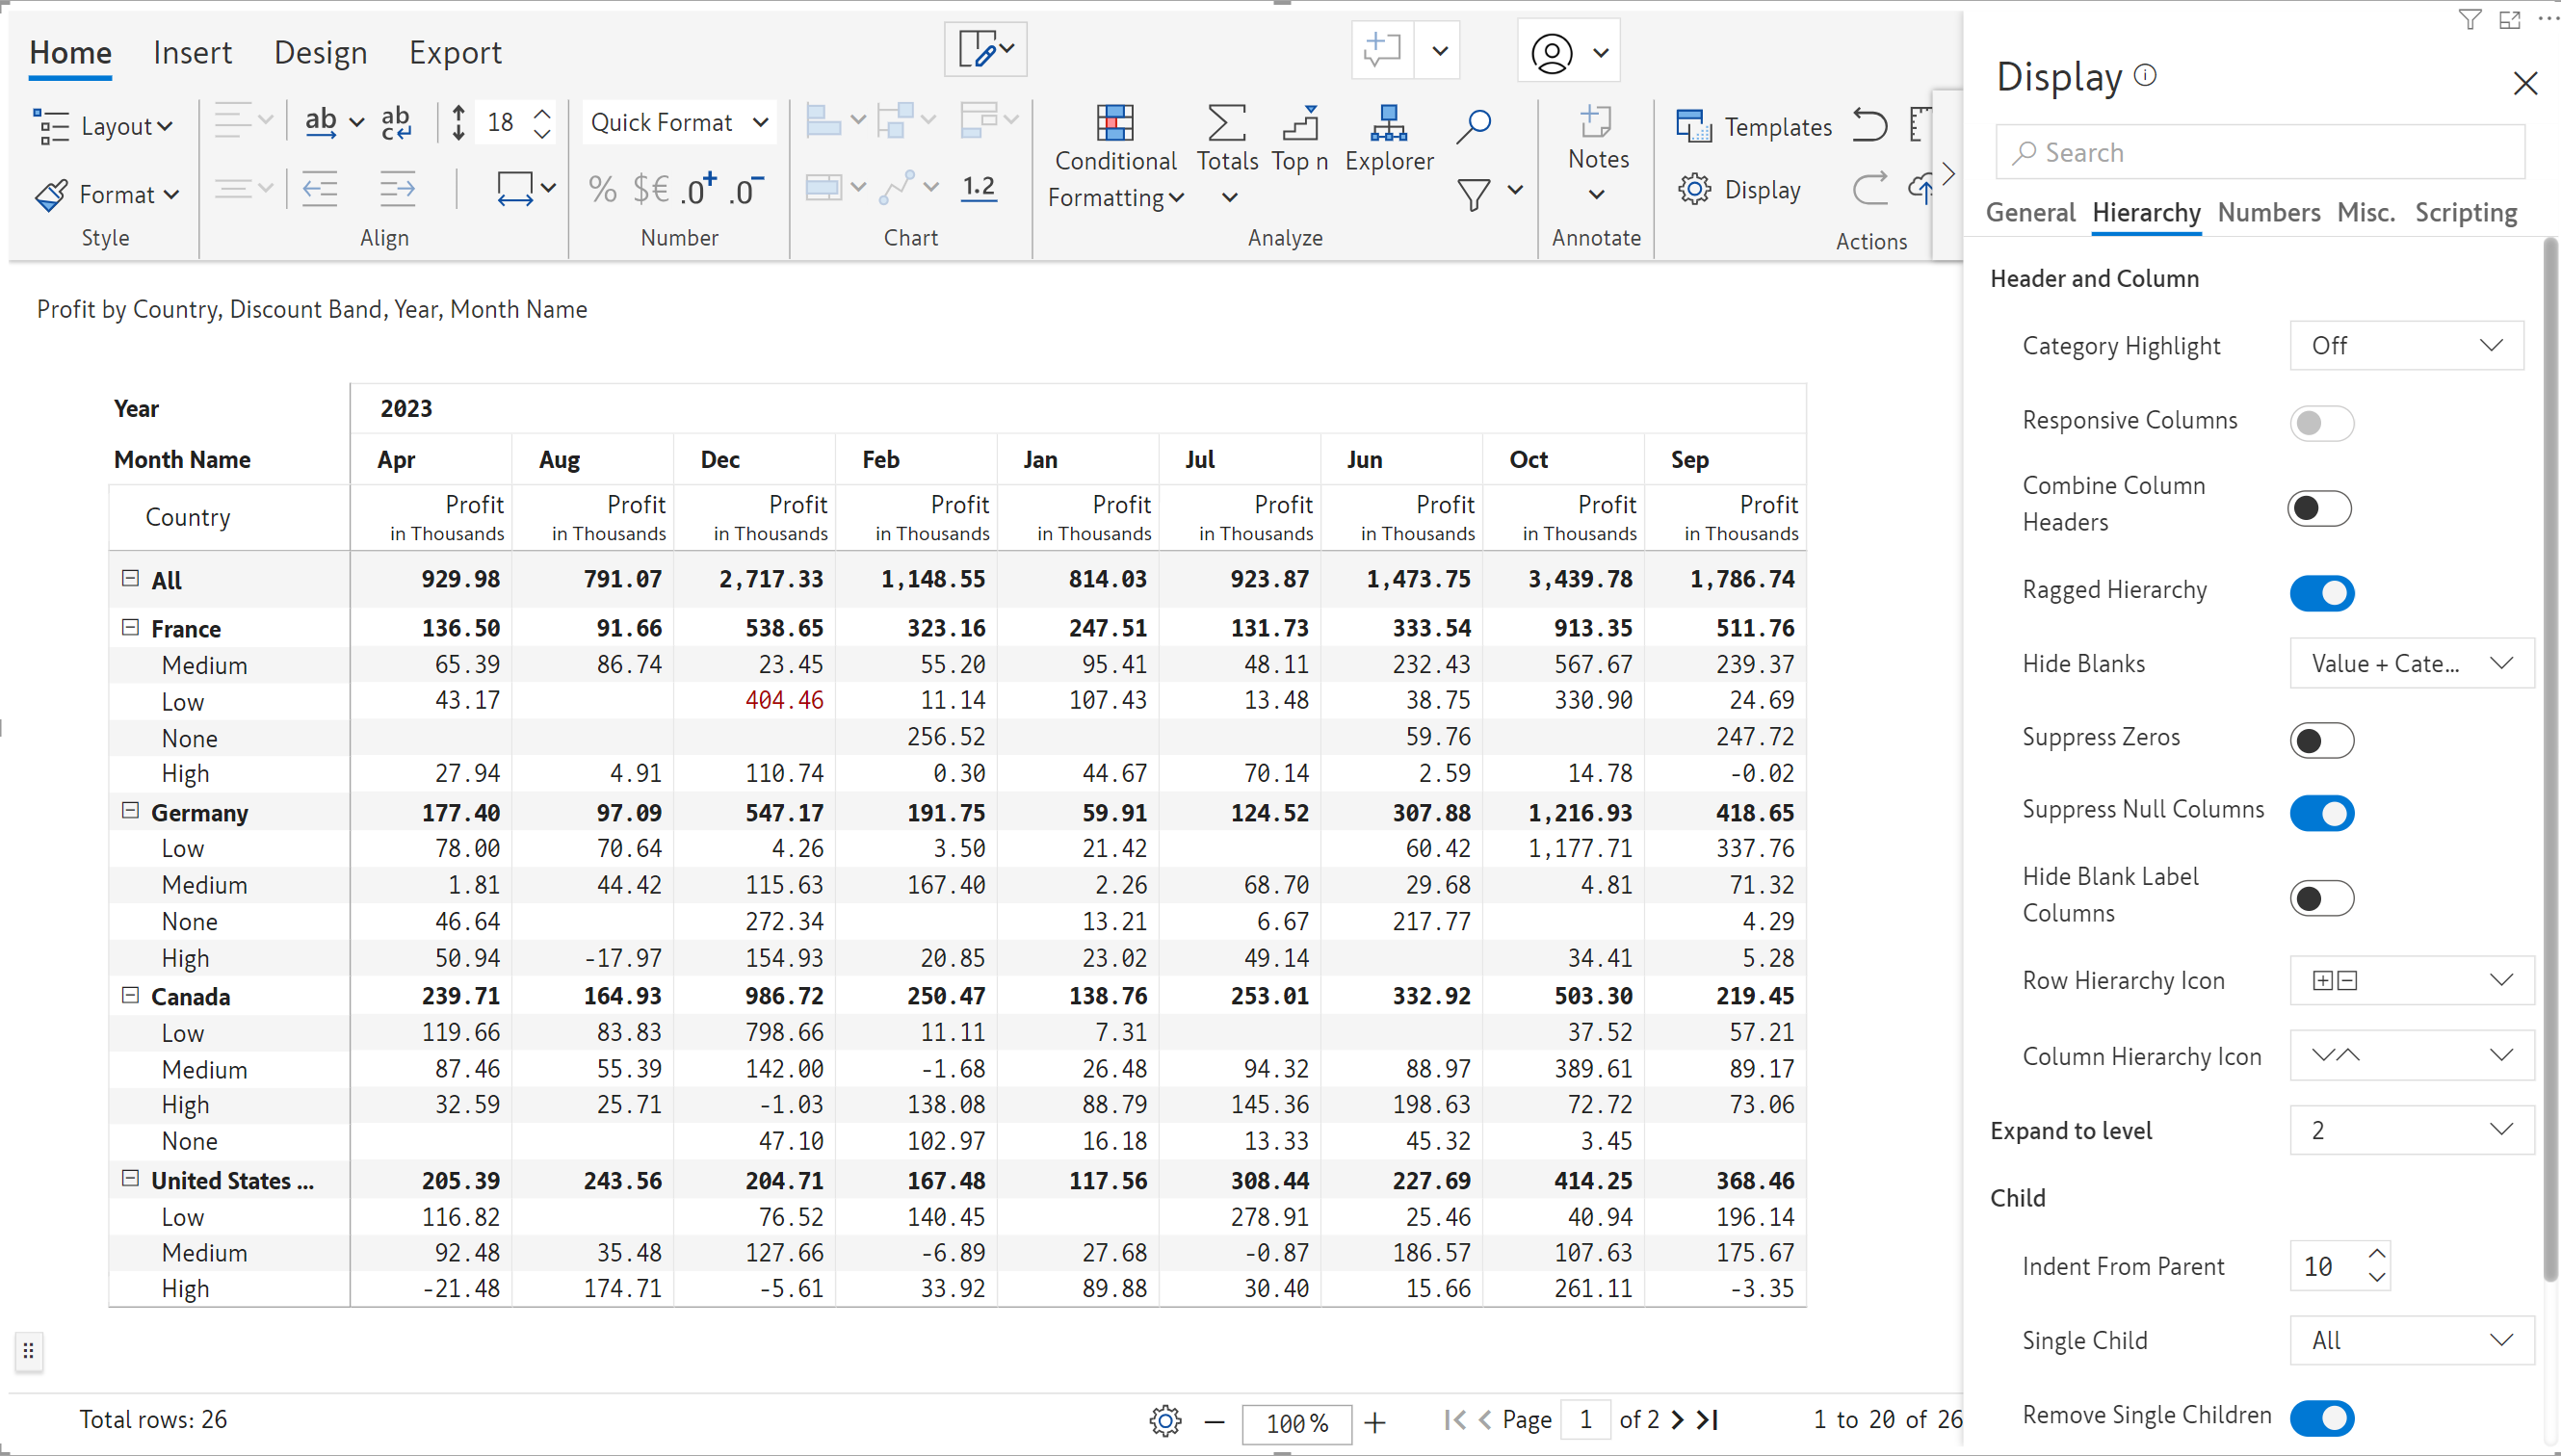
#### 1.5. Ragged hierarchy&#x20;

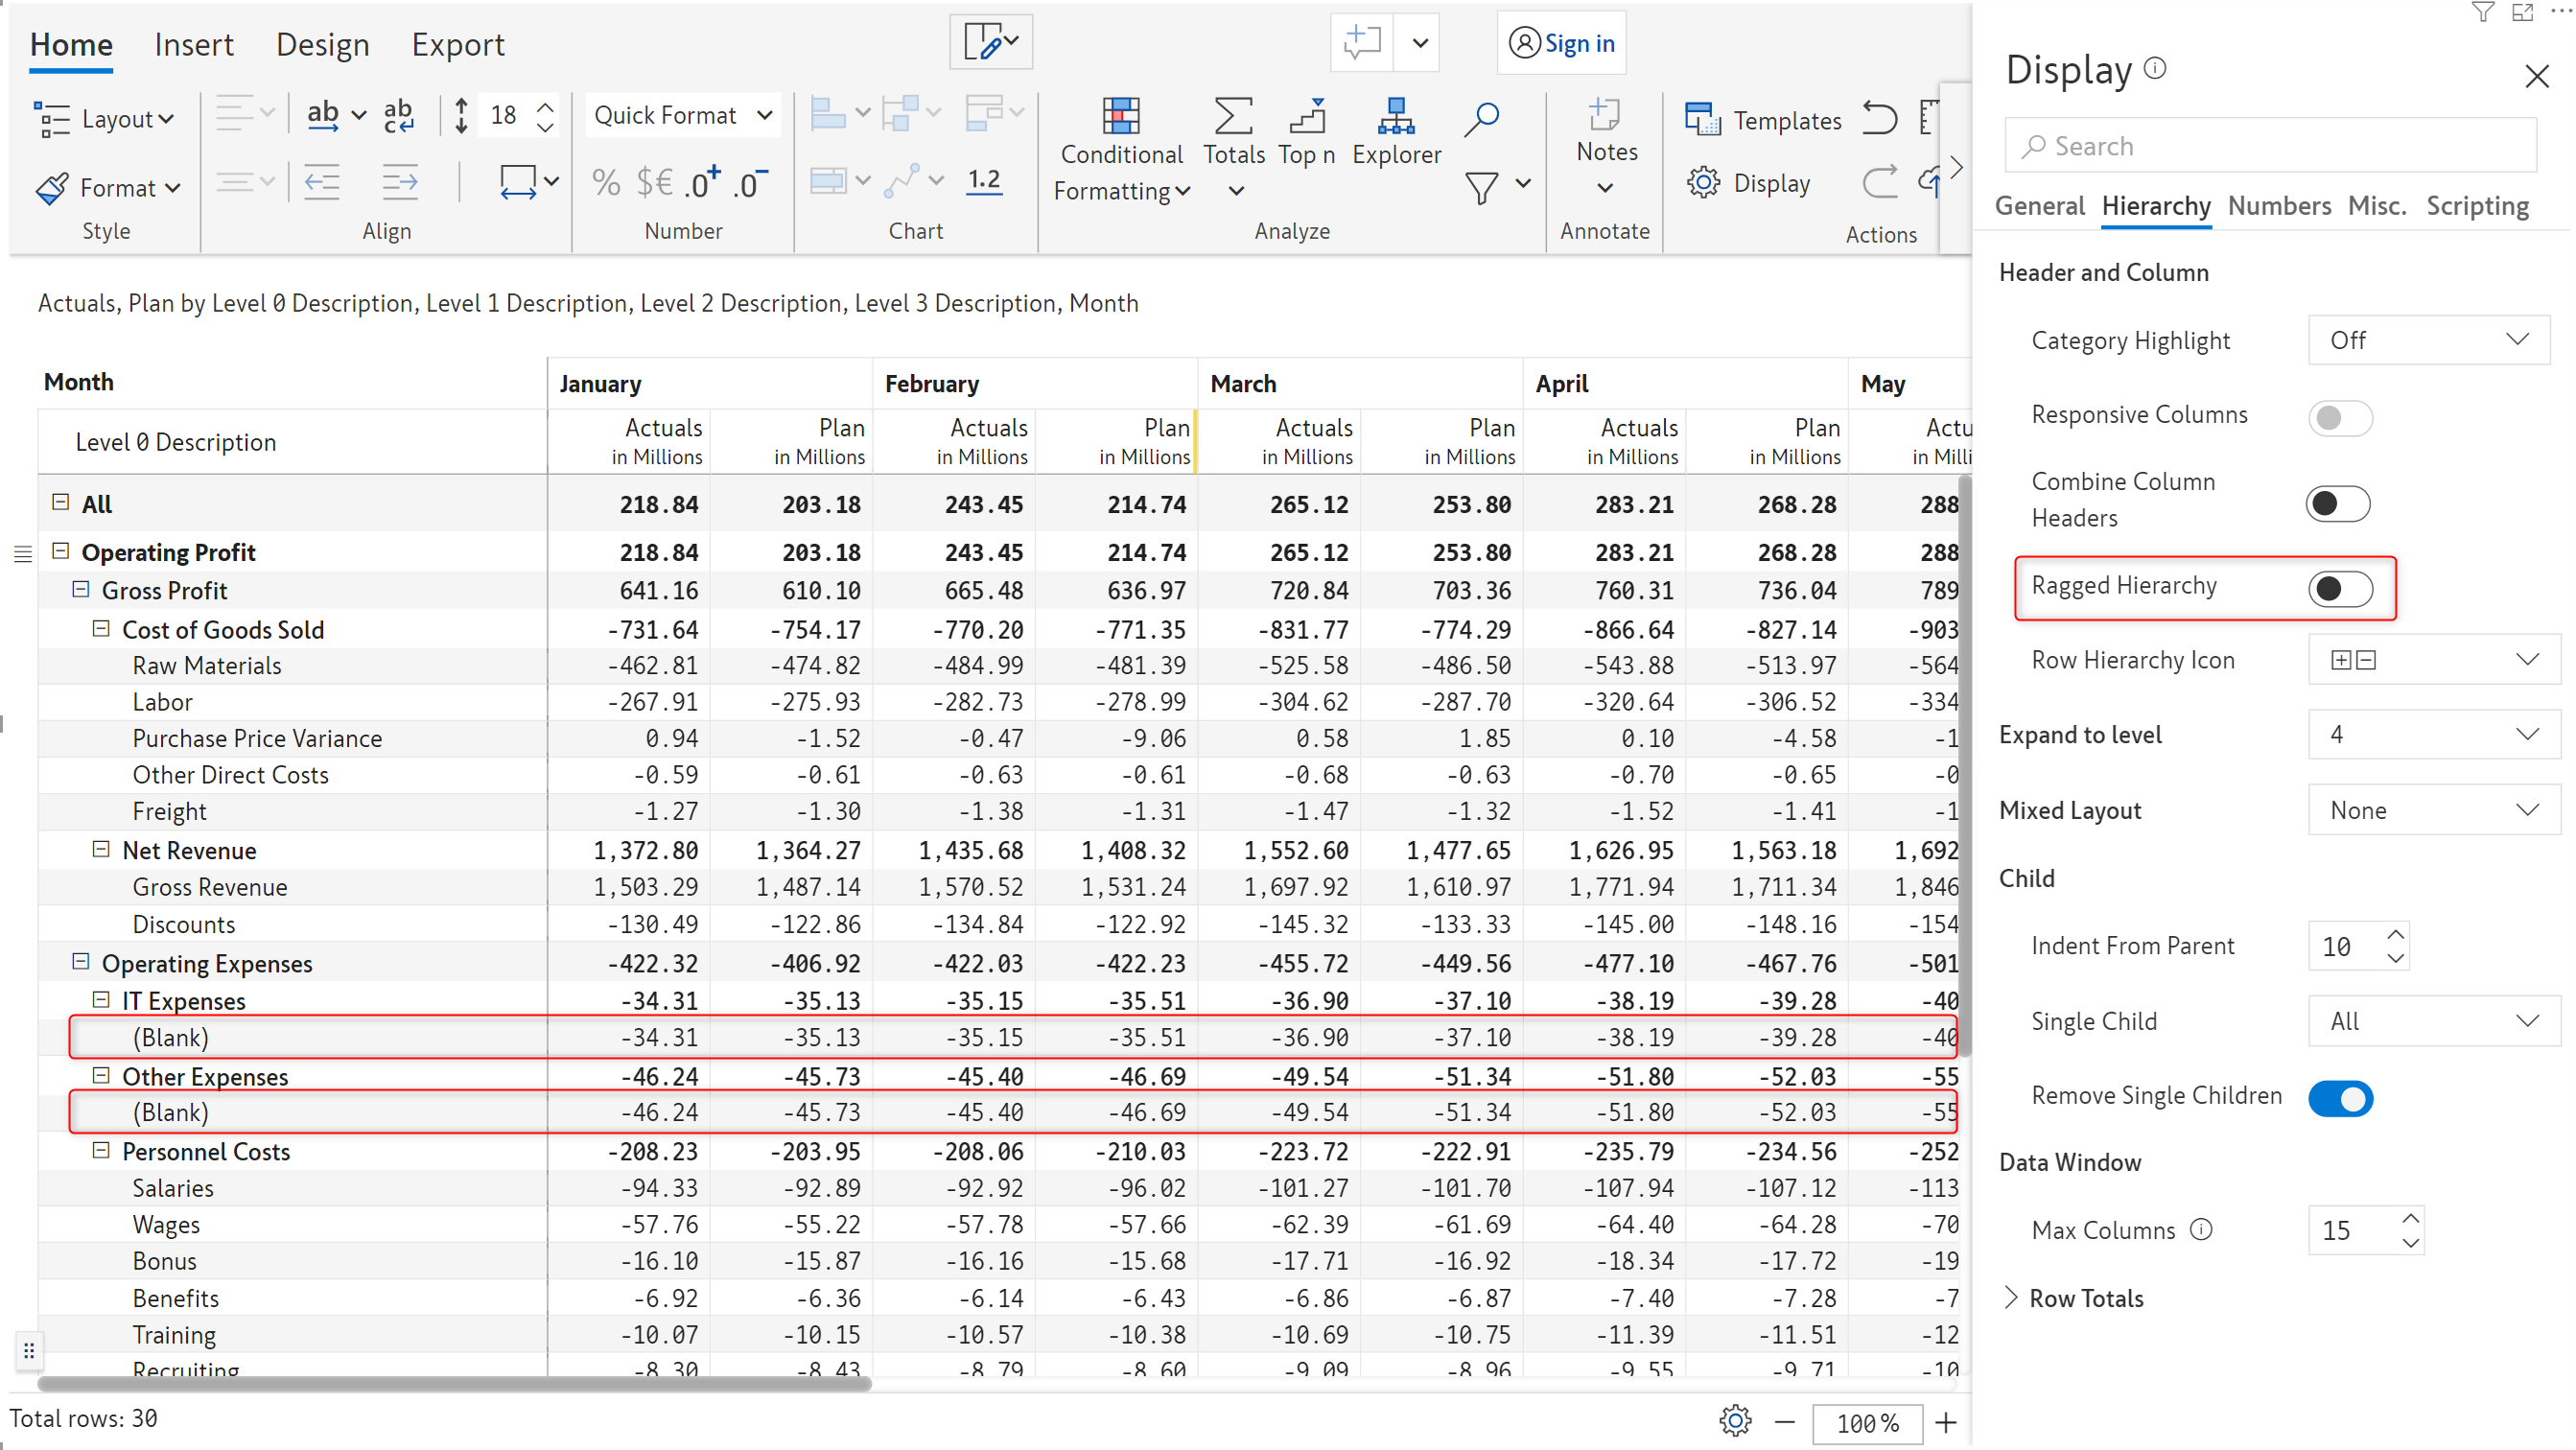
In the case of ragged/unbalanced hierarchies where the number of levels is uneven, you can hide the blank category rows.&#x20;

<figure><img src="https://3062809325-files.gitbook.io/~/files/v0/b/gitbook-x-prod.appspot.com/o/spaces%2FEbkCXCUXmtUq5tcnUtZE%2Fuploads%2FPUBtSf33bi1DmQoVd5er%2Fimage.png?alt=media&amp;token=cf427deb-84ca-4d02-bd4a-d8ec6e31b0c6" alt=""><figcaption><p>Ragged hierarchy option</p></figcaption></figure>

Notice how the blank categories under 'IT Expenses' and 'Other Expenses' have been hidden after enabling the *Ragged Hierarchy* option.

<figure><img src="https://3062809325-files.gitbook.io/~/files/v0/b/gitbook-x-prod.appspot.com/o/spaces%2FEbkCXCUXmtUq5tcnUtZE%2Fuploads%2FCutemxvZAtcO06zOe8MN%2Fimage.png?alt=media&amp;token=e9bccdb4-1a22-4f7f-bdfd-4b6f4b0fdf7b" alt=""><figcaption><p>Ragged hierarchy sub-options</p></figcaption></figure>

On enabling ragged hierarchy, additional options are displayed:

* **Hide blanks**

Using this option you can choose to hide the rows if the category is blank, values are blank or both value and category are blank.

* #### Suppress zeros&#x20;

If you enable this option, then the rows containing zeros will be suppressed.

{% hint style="info" %}
This option becomes available only if the option chosen in the Hide Blanks is 'Value' or 'Value+Category'.
{% endhint %}

* **Suppress null columns**

Columns containing null values will be suppressed if this option is enabled.

* **Hide blank label columns**

Columns with blank labels will be suppressed if this option is enabled.

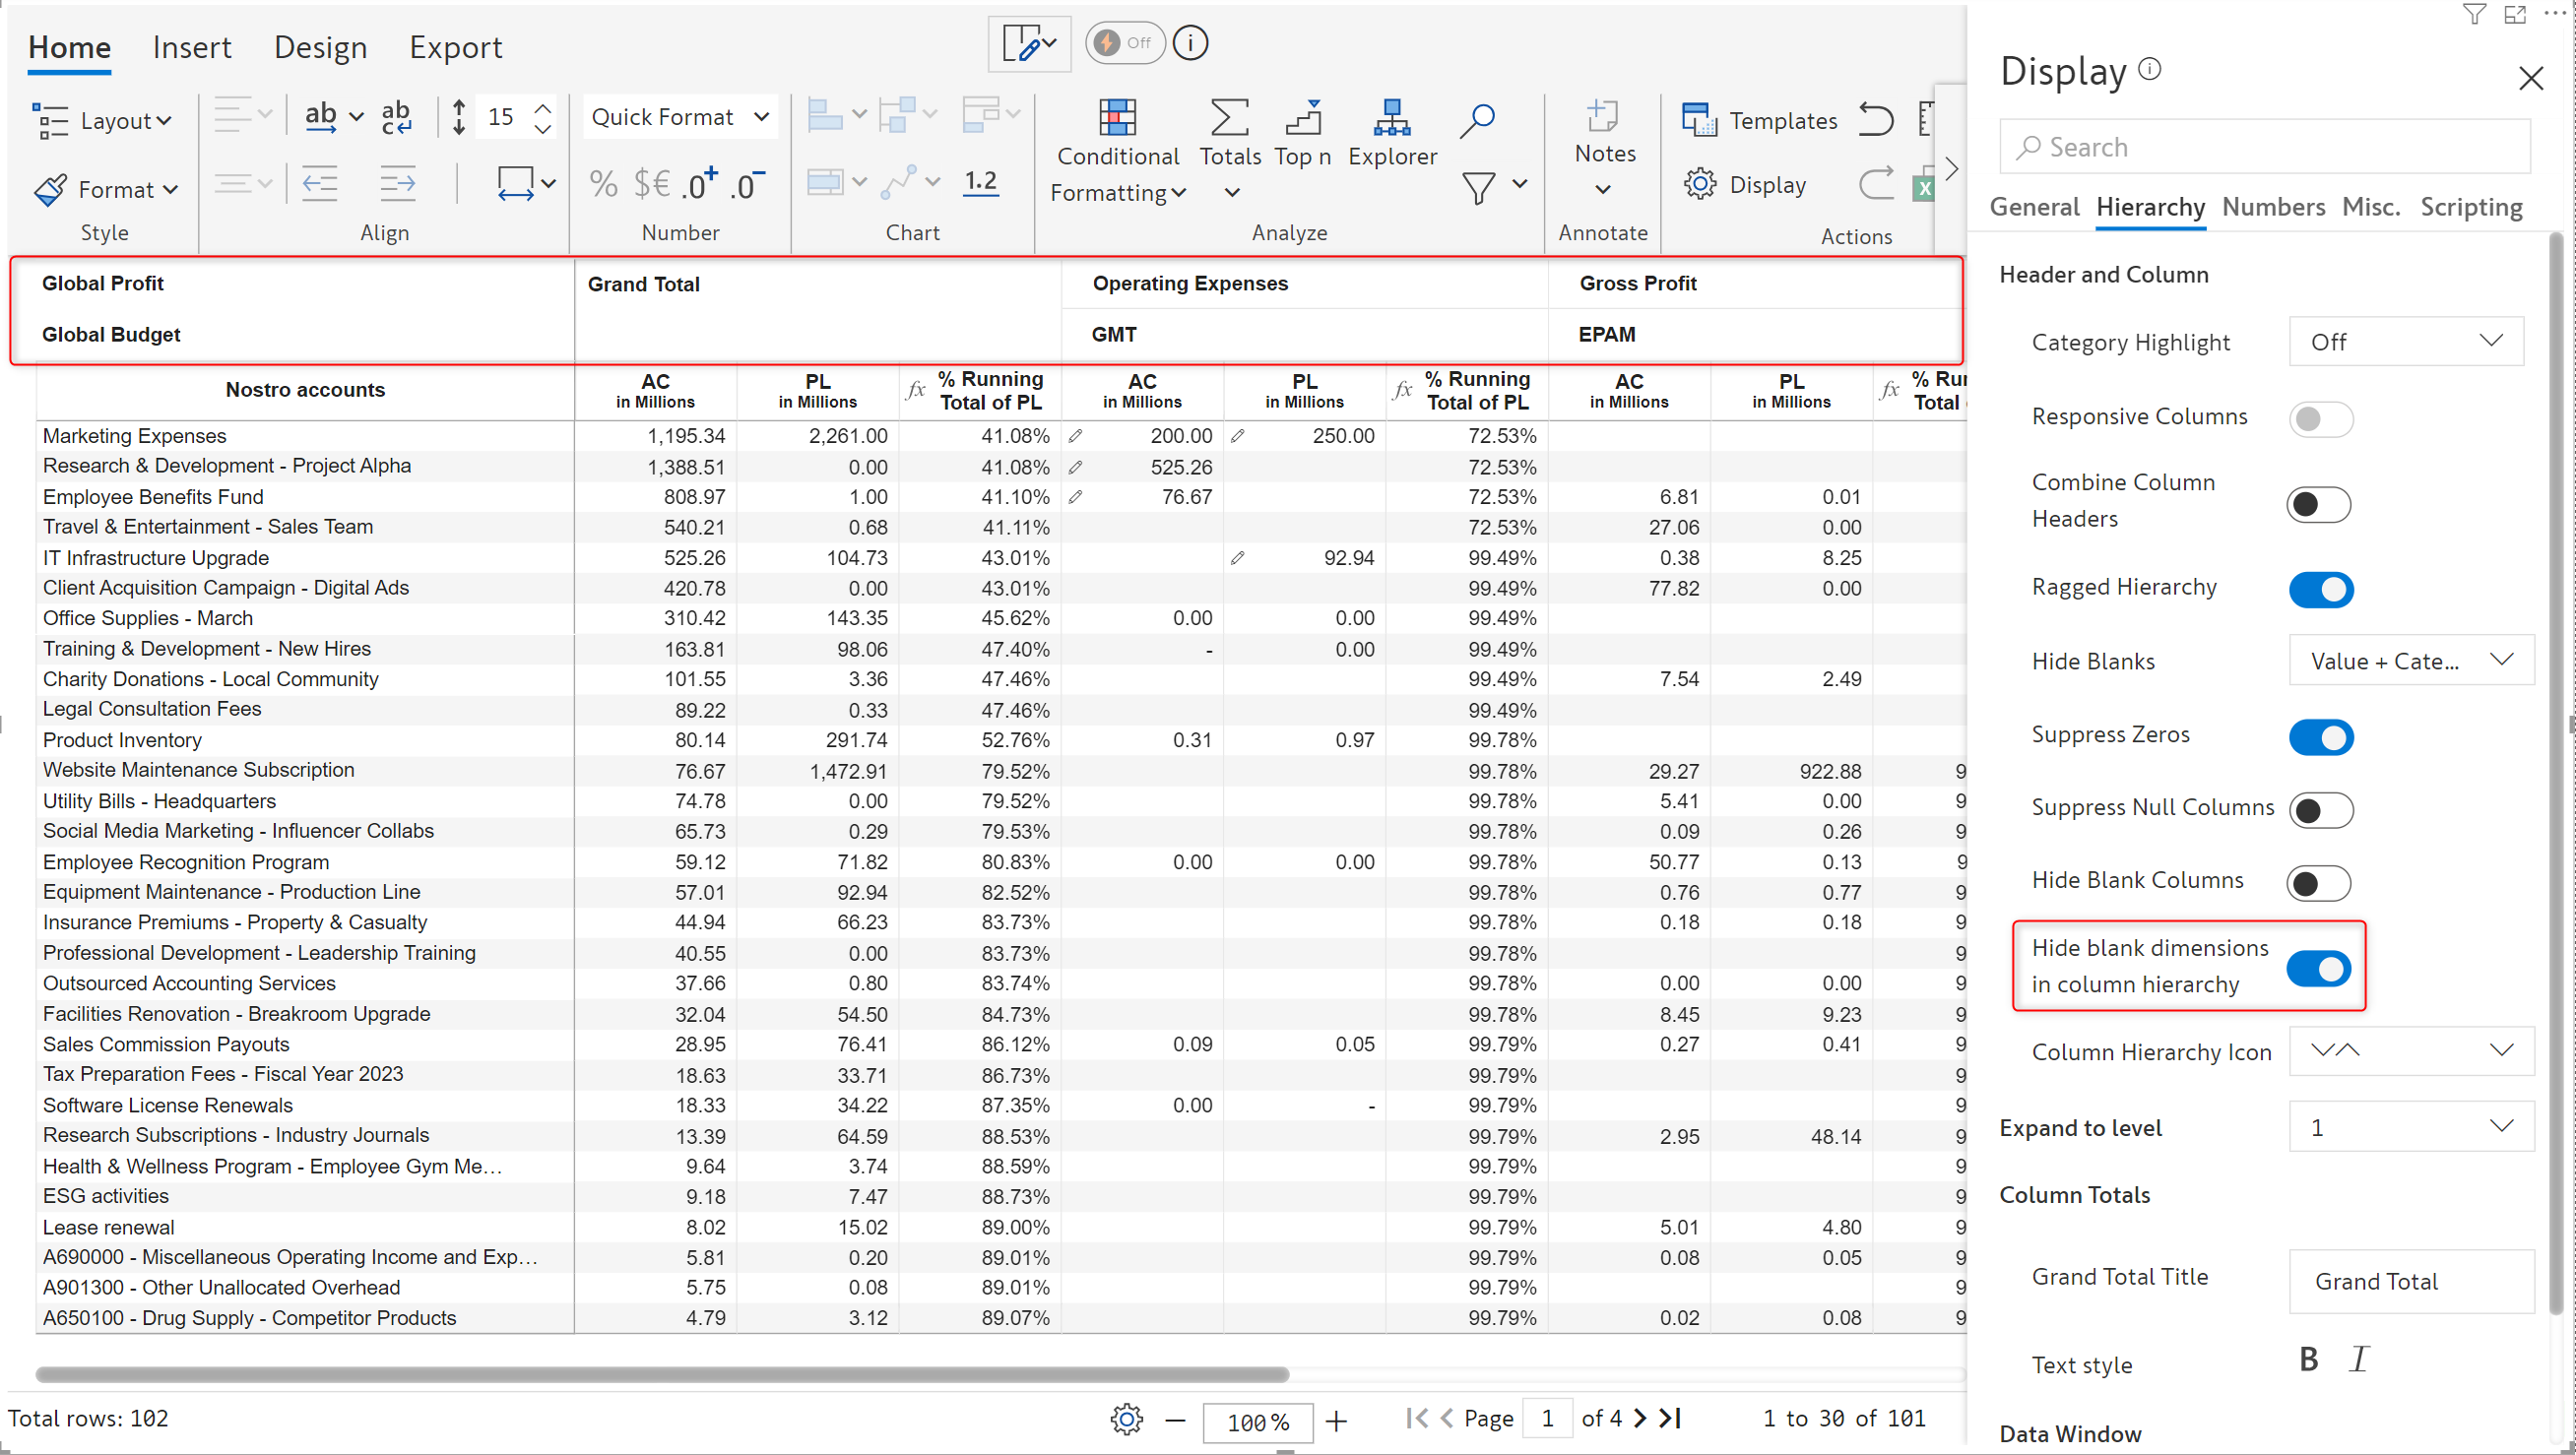
* **Hide blank dimensions in column hierarchy**

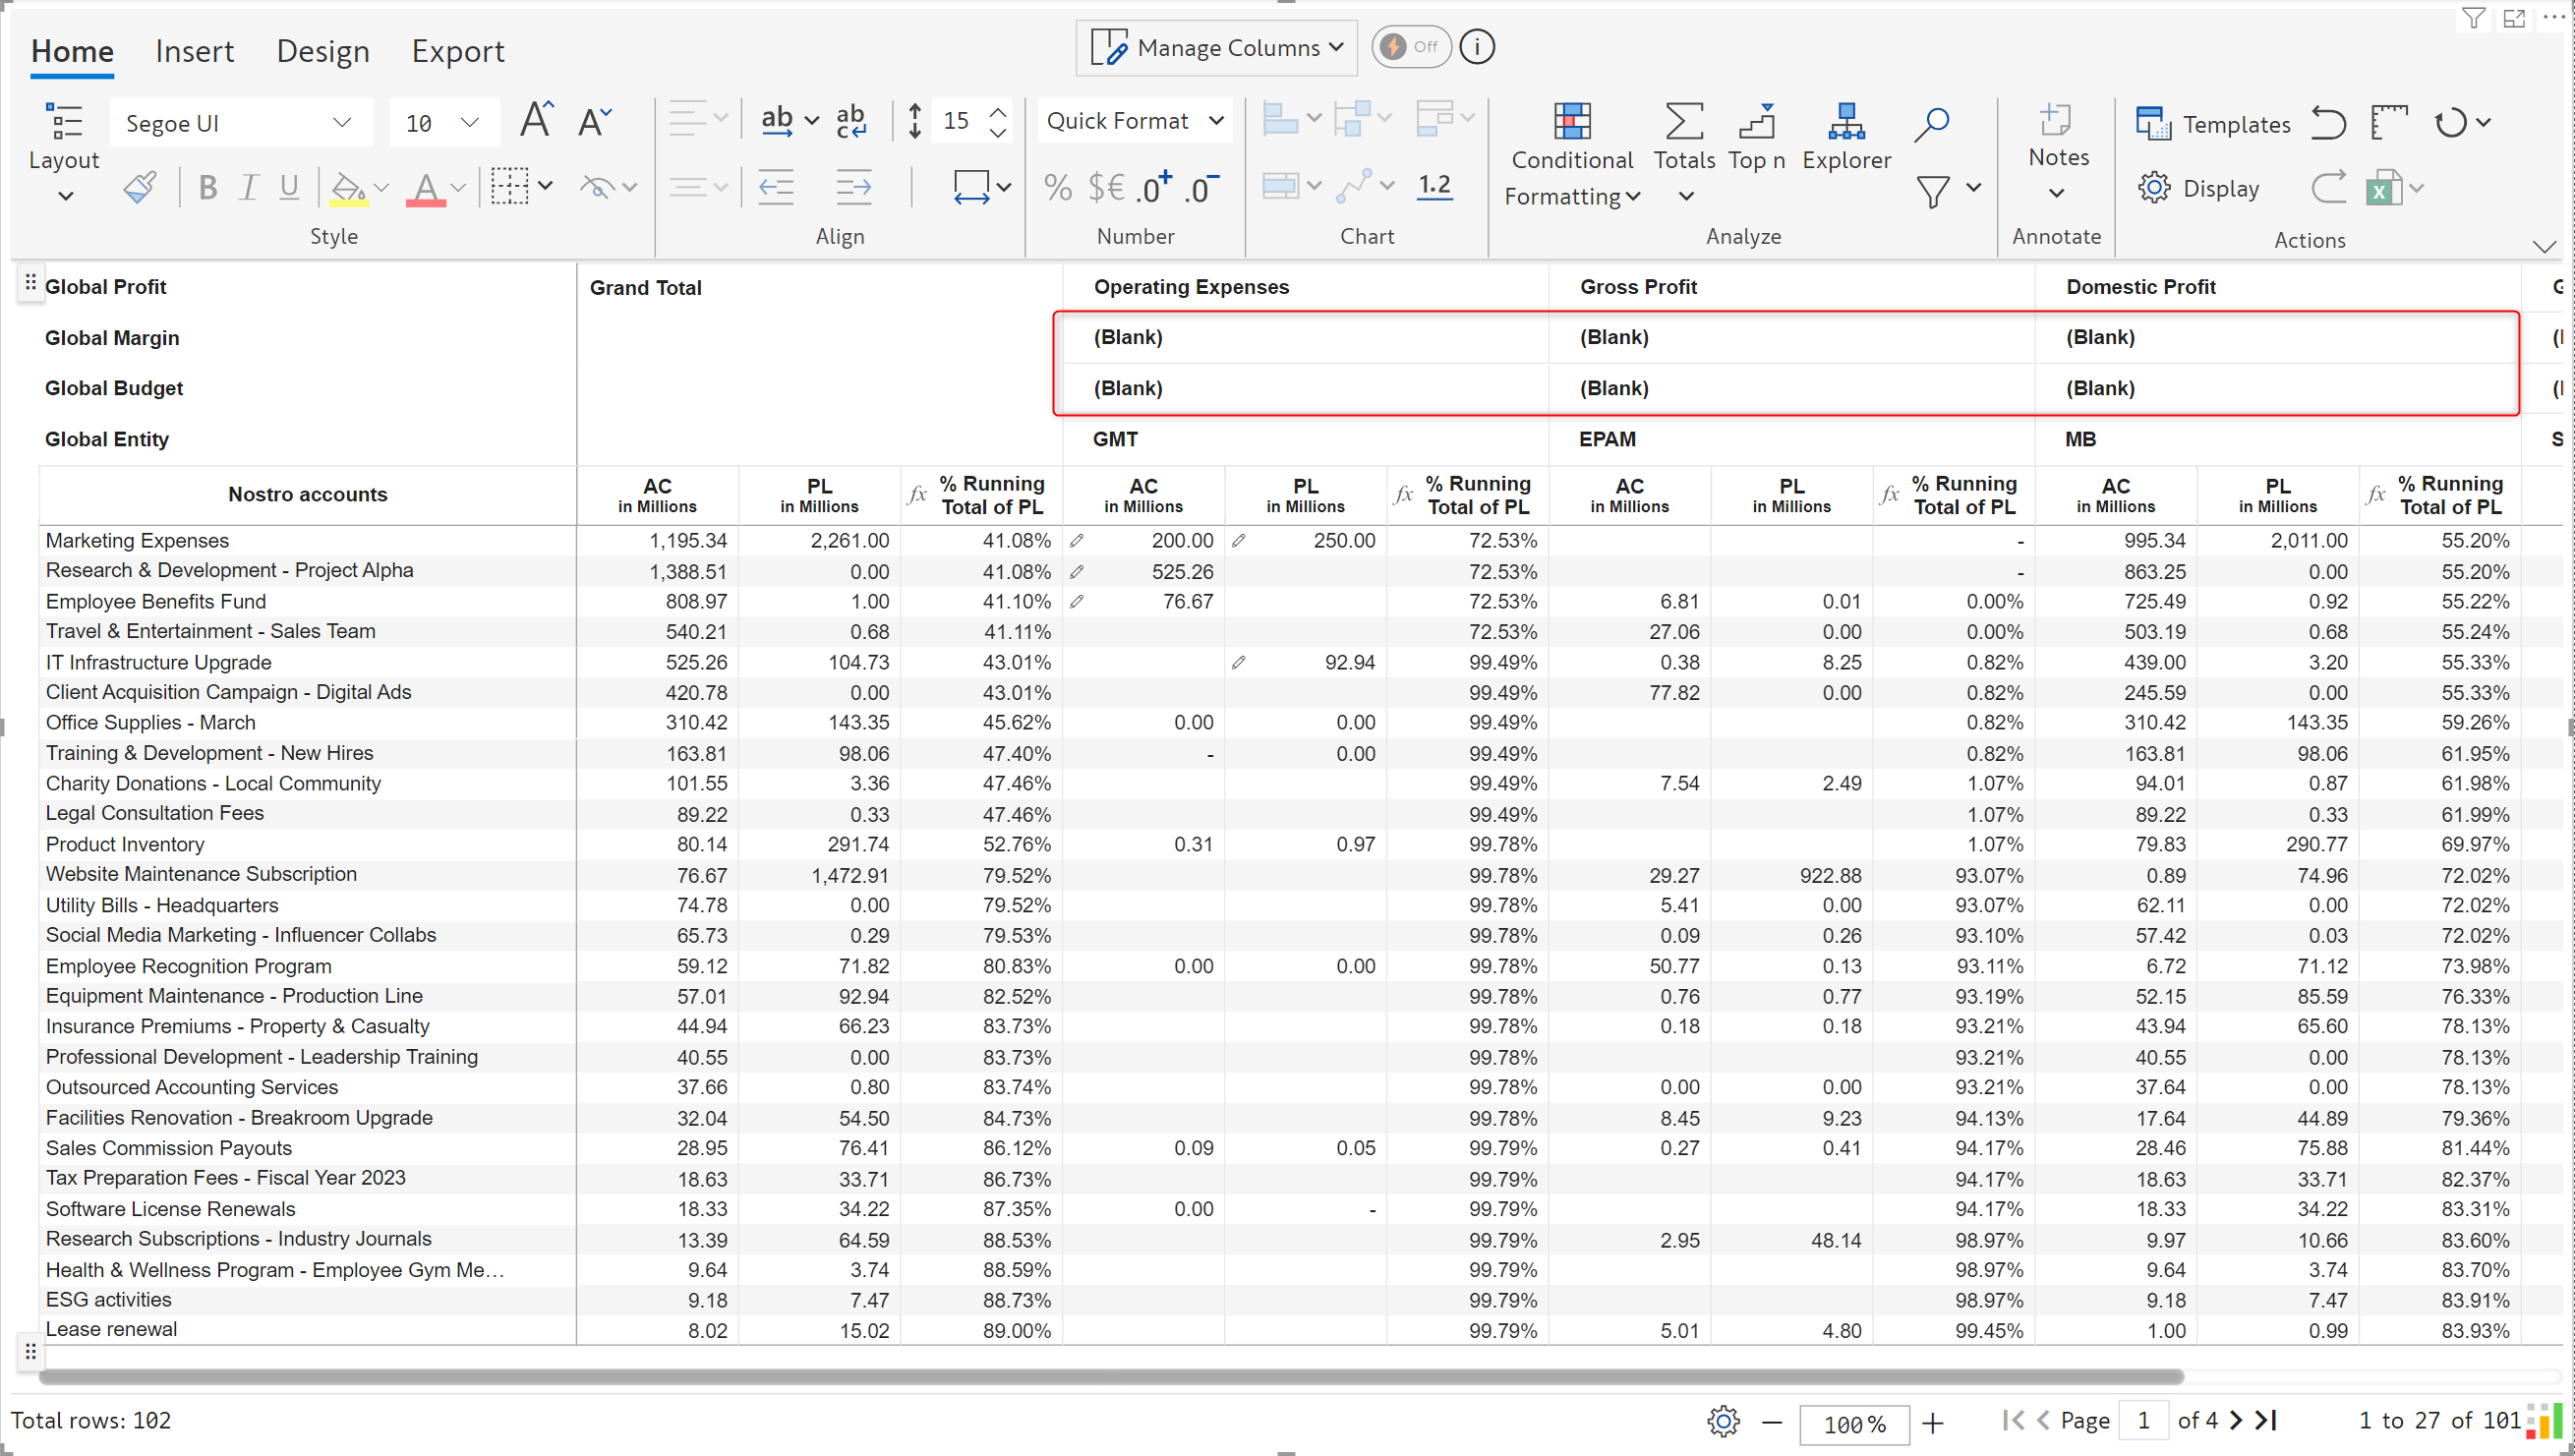
When you have hierarchical column dimensions, there may be cases where the entire dimension category is blank as shown in the report below.

<figure><img src="https://3062809325-files.gitbook.io/~/files/v0/b/gitbook-x-prod.appspot.com/o/spaces%2FEbkCXCUXmtUq5tcnUtZE%2Fuploads%2F8wODGYaWdJUIMargSYkt%2F5.1.1.%20Hide%20blank%20category.png?alt=media&amp;token=6d89d58a-6c15-4987-a3b4-69948da8a8b4" alt=""><figcaption><p>Blank categories in the column dimension</p></figcaption></figure>

Since these categories do not add value to the report, you can suppress them by enabling the **Hide blank dimensions in column hierarchy** option.

<figure><img src="https://3062809325-files.gitbook.io/~/files/v0/b/gitbook-x-prod.appspot.com/o/spaces%2FEbkCXCUXmtUq5tcnUtZE%2Fuploads%2Fr7Ze84x08dwAxjYbMOJC%2F5.1.2.%20Hidden%20blank%20category.png?alt=media&amp;token=fadf0d21-ad0a-4e1c-a07b-ab42d7cad3f1" alt=""><figcaption><p>Suppress blank categories in the column dimension</p></figcaption></figure>

#### 1.6. Row hierarchy icon

You can select custom icon styles to represent the row hierarchy i.e. choose the expand/collapse icons for hierarchical categories. If 'None' is selected, an icon will not be displayed.&#x20;

<figure><img src="https://3062809325-files.gitbook.io/~/files/v0/b/gitbook-x-prod.appspot.com/o/spaces%2FEbkCXCUXmtUq5tcnUtZE%2Fuploads%2FirLTgbclm5ye3lSic1h7%2Fimage.png?alt=media&amp;token=a68af04c-abf8-4767-ab1b-30683350e11b" alt=""><figcaption><p>Row hierarchy icon</p></figcaption></figure>

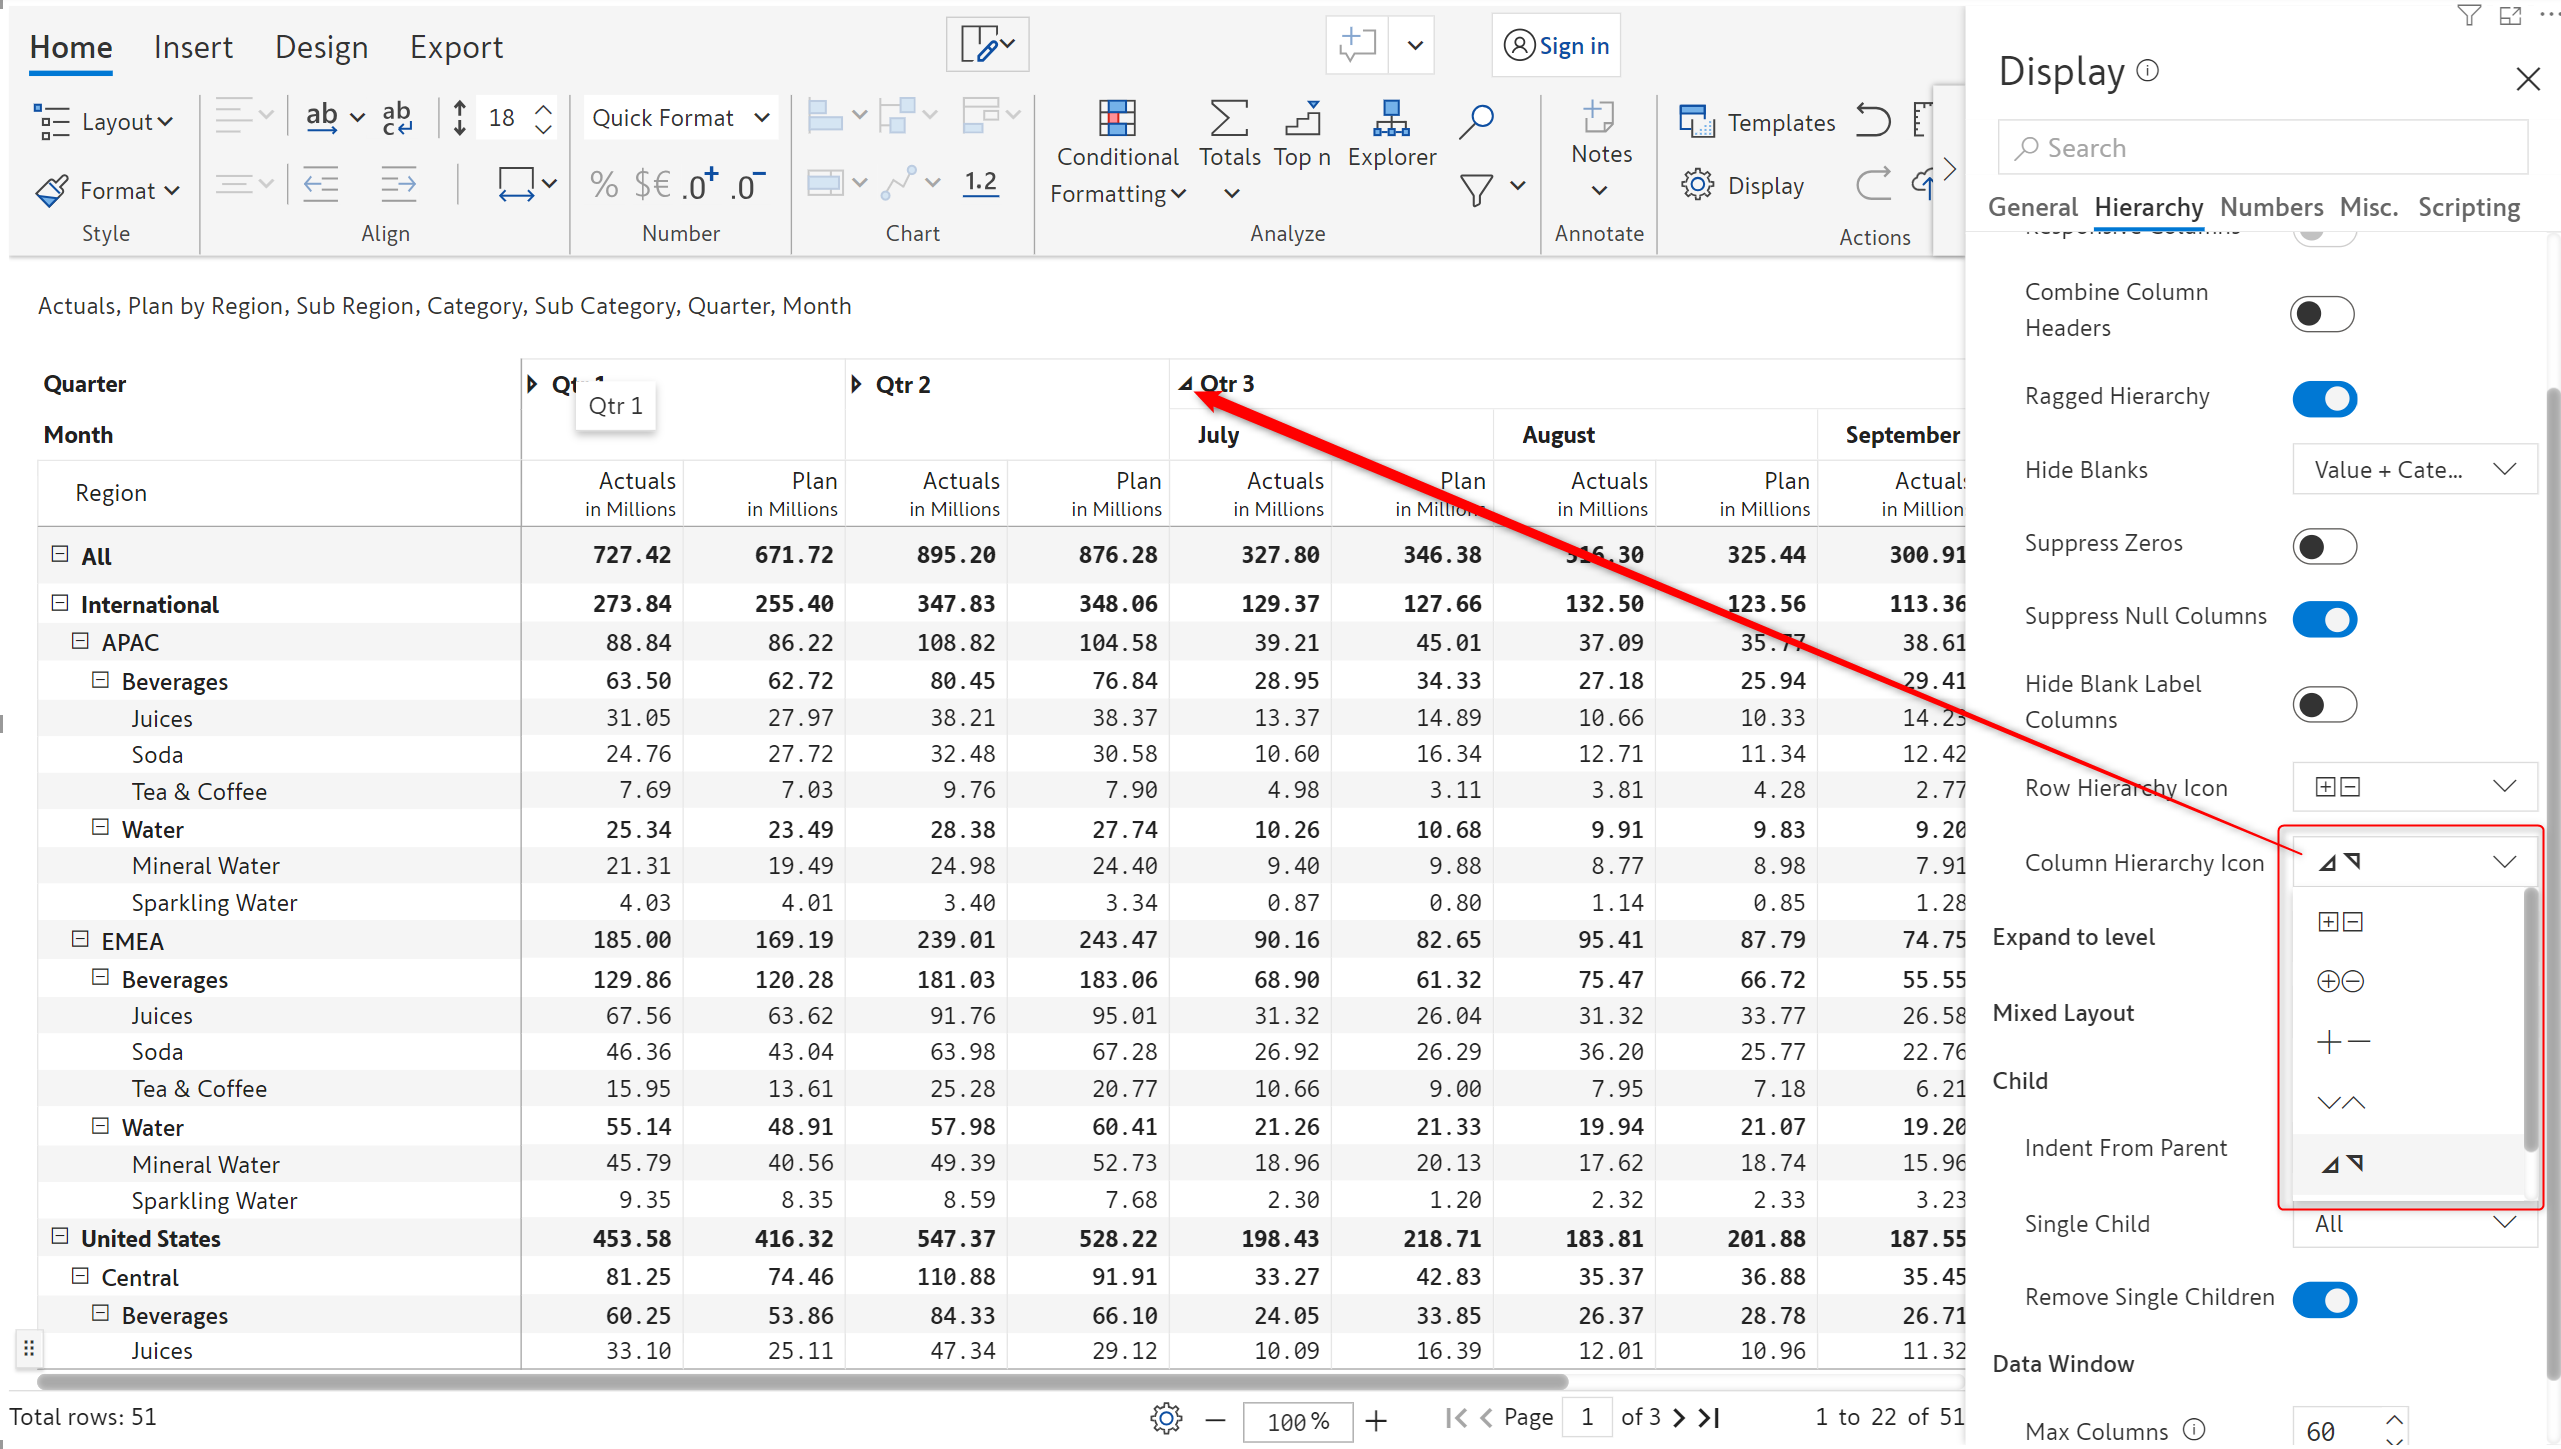
#### 1.7. Column hierarchy icon

You can select custom icon styles to represent the column hierarchy as well.

<figure><img src="https://3062809325-files.gitbook.io/~/files/v0/b/gitbook-x-prod.appspot.com/o/spaces%2FEbkCXCUXmtUq5tcnUtZE%2Fuploads%2FooXOAGNG1AAFKKjyOsJy%2Fimage.png?alt=media&amp;token=a7b2af28-db3b-4fda-a756-b95449192b7e" alt=""><figcaption><p>Change the expand and collapse icons</p></figcaption></figure>

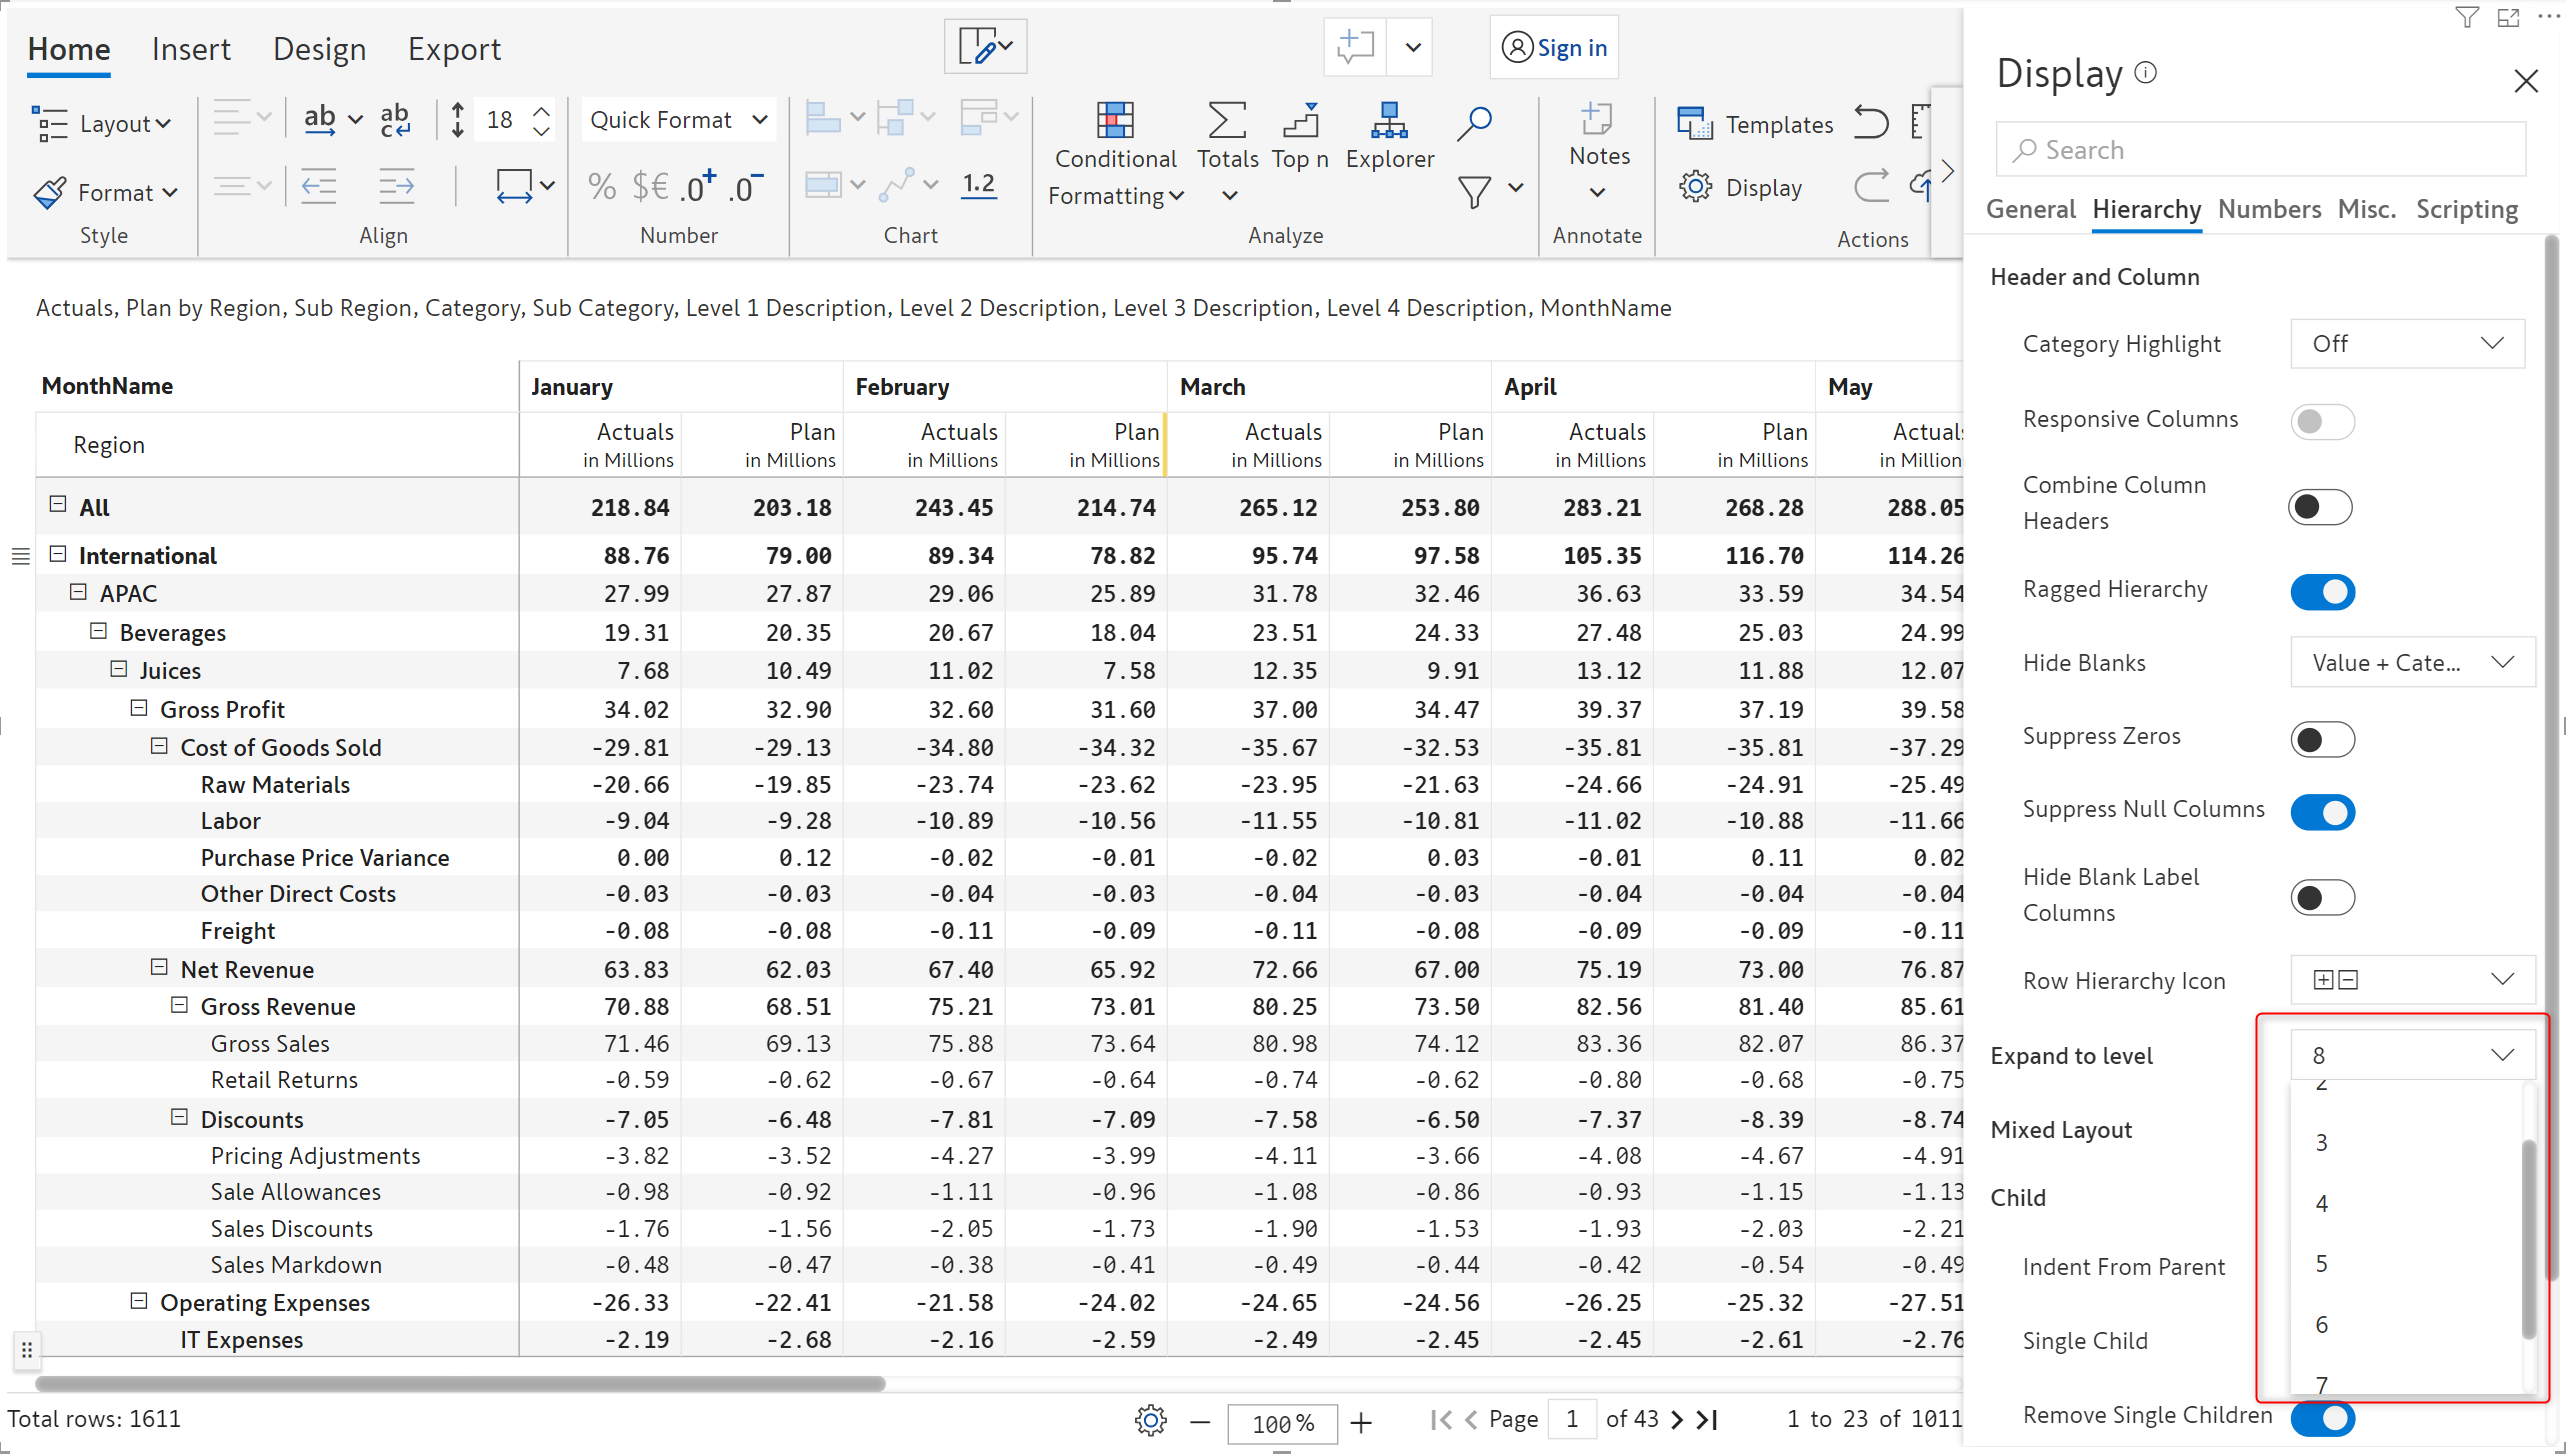
## 2. Expand to level

If your dataset contains hierarchies with multiple levels, you can choose to expand the hierarchy to a specific level at the initial load. This setting will be retained even after applying a filter/slicer.&#x20;

<figure><img src="https://3062809325-files.gitbook.io/~/files/v0/b/gitbook-x-prod.appspot.com/o/spaces%2FEbkCXCUXmtUq5tcnUtZE%2Fuploads%2F2uBMPdkd3IeX6f4hUT6f%2Fimage.png?alt=media&amp;token=d82c7db9-bbb3-4211-8747-ca5a9c3f3ac1" alt=""><figcaption><p>Expand to level</p></figcaption></figure>

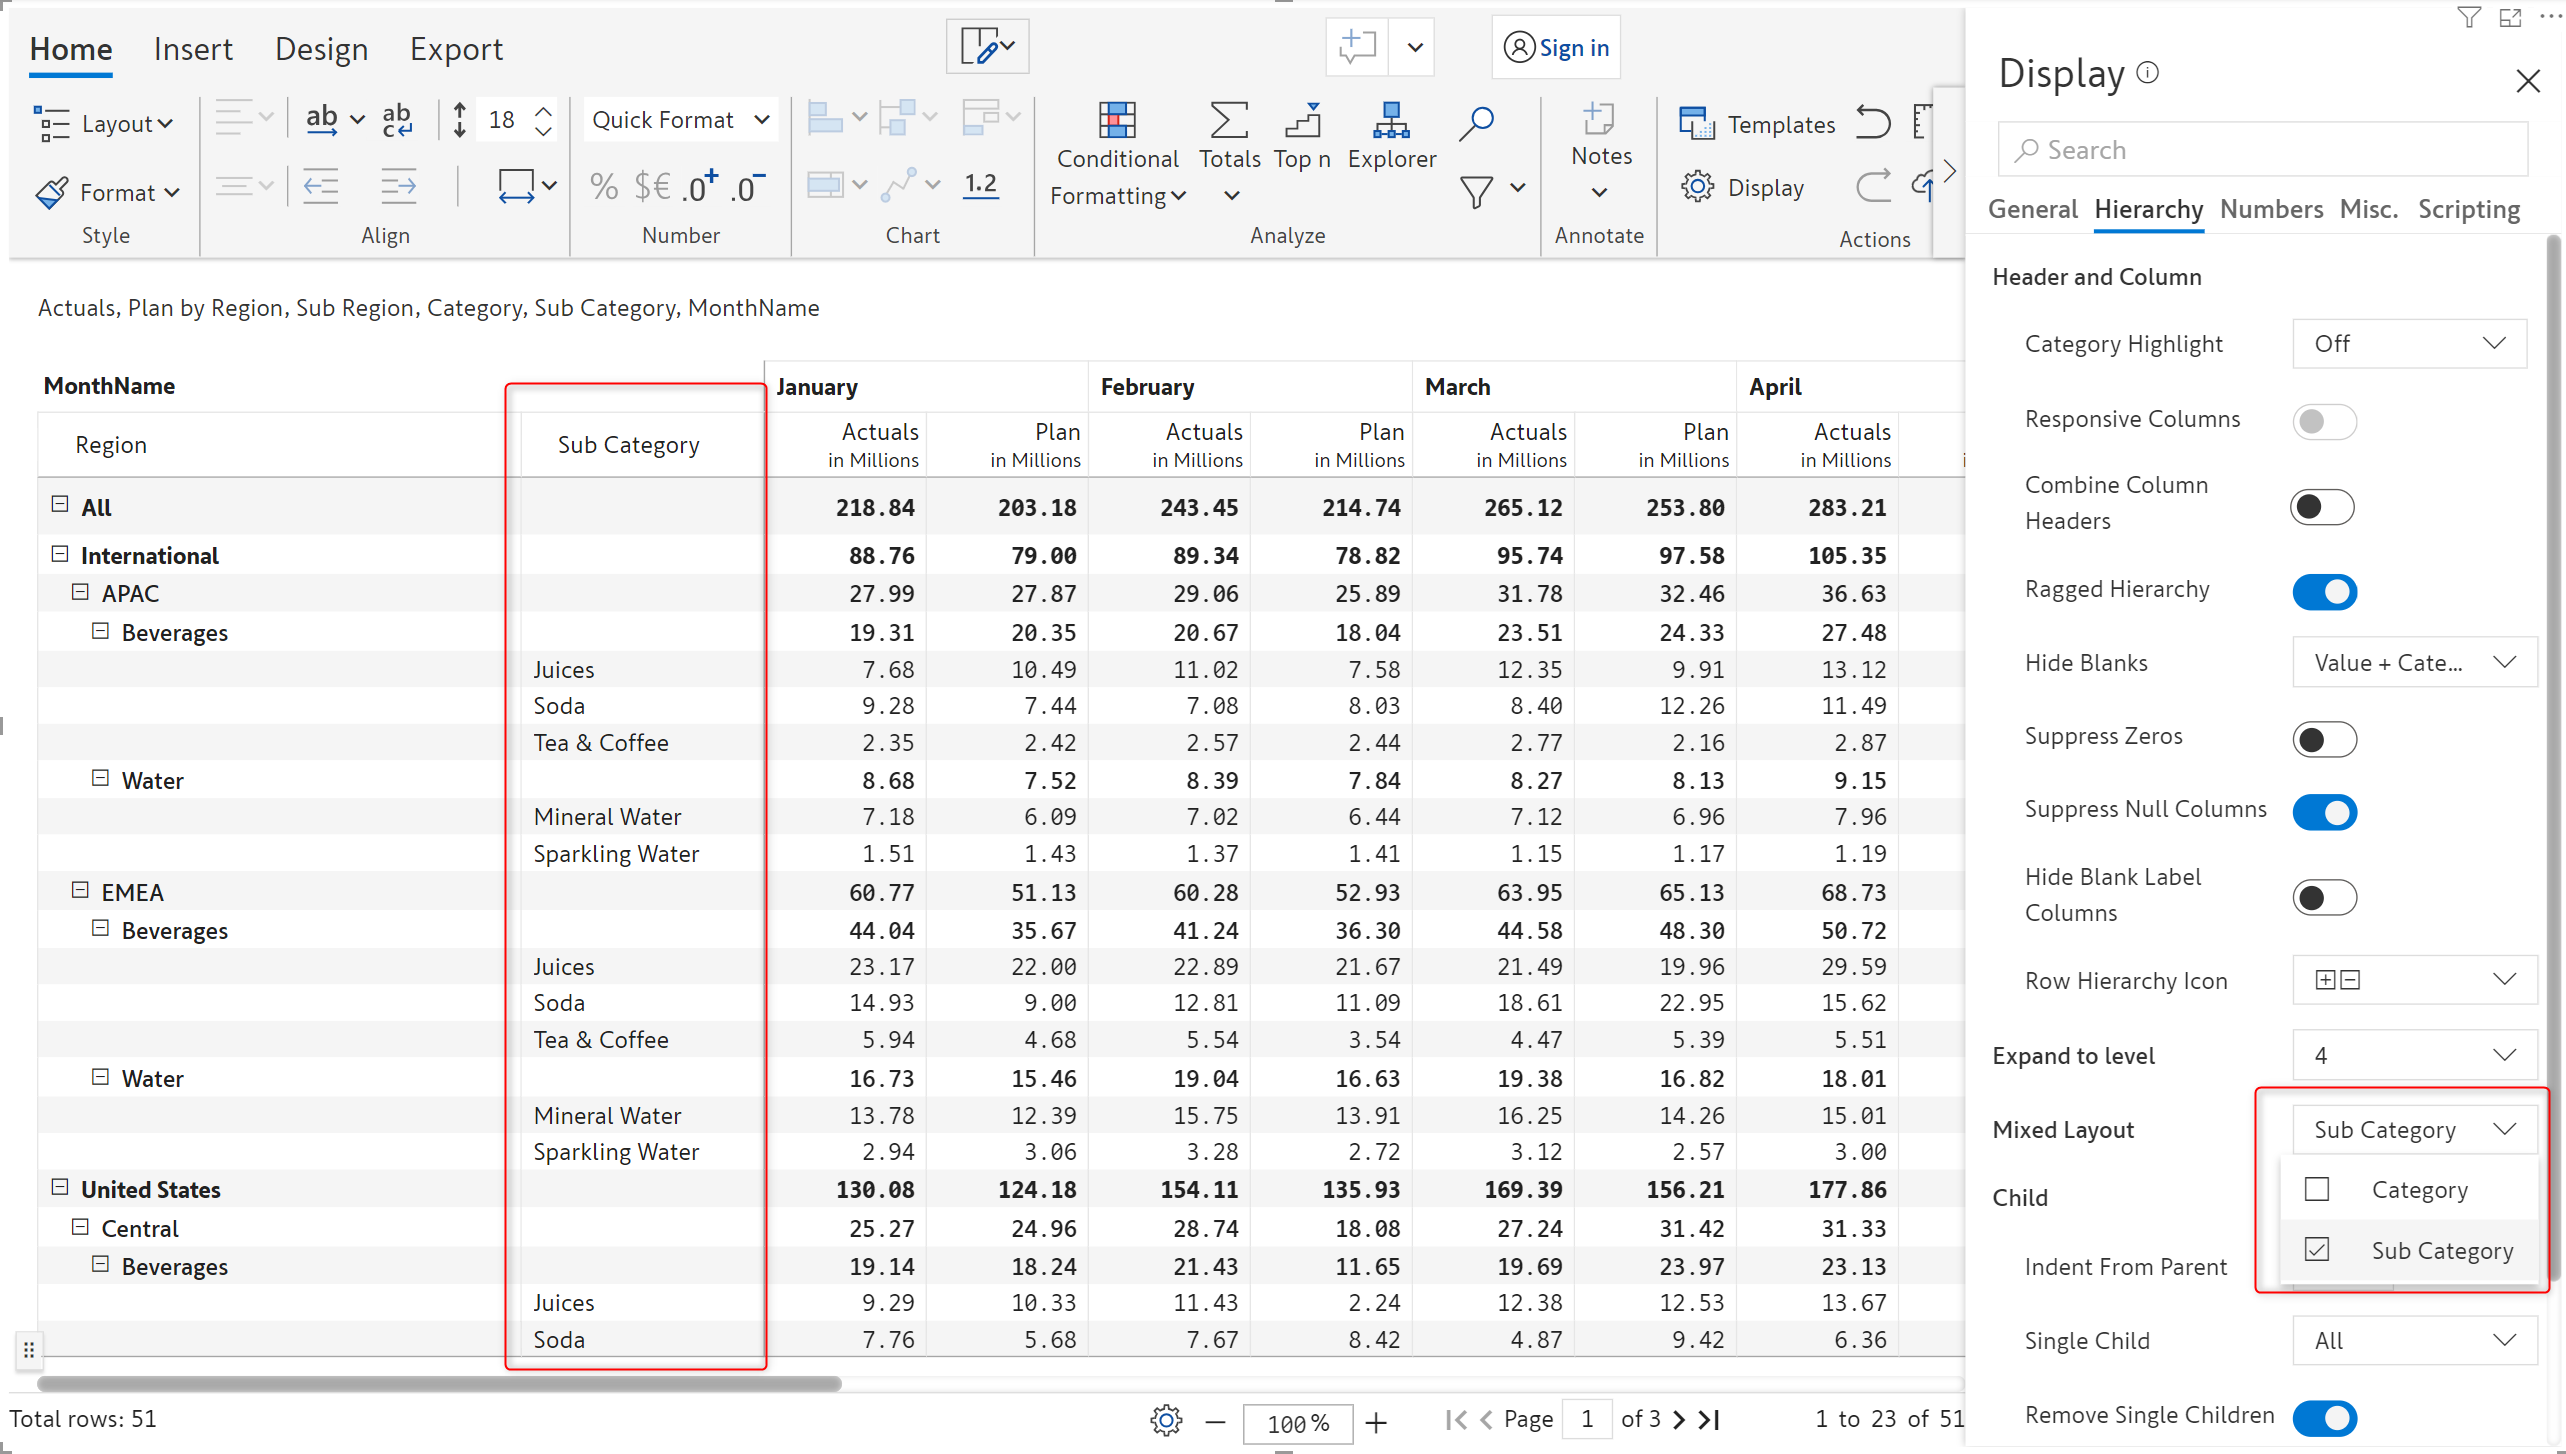
## 3. Mixed layout

You can display a chosen field as a separate column similar to the stepped layout. By default, it is set to 'None'. In the below image, the 'Sub Category' field has been selected and it gets displayed as a separate column in the visual.

{% hint style="info" %}
This option is available only in the Hierarchy layout when there are 3 or more levels in the row dimensions.
{% endhint %}

<figure><img src="https://3062809325-files.gitbook.io/~/files/v0/b/gitbook-x-prod.appspot.com/o/spaces%2FEbkCXCUXmtUq5tcnUtZE%2Fuploads%2Fw88JD0mmEzECzcESJy2G%2Fimage.png?alt=media&amp;token=dcfd6342-f625-4275-a634-90c36004dec3" alt=""><figcaption><p>Mixed layout</p></figcaption></figure>

## 4. Child

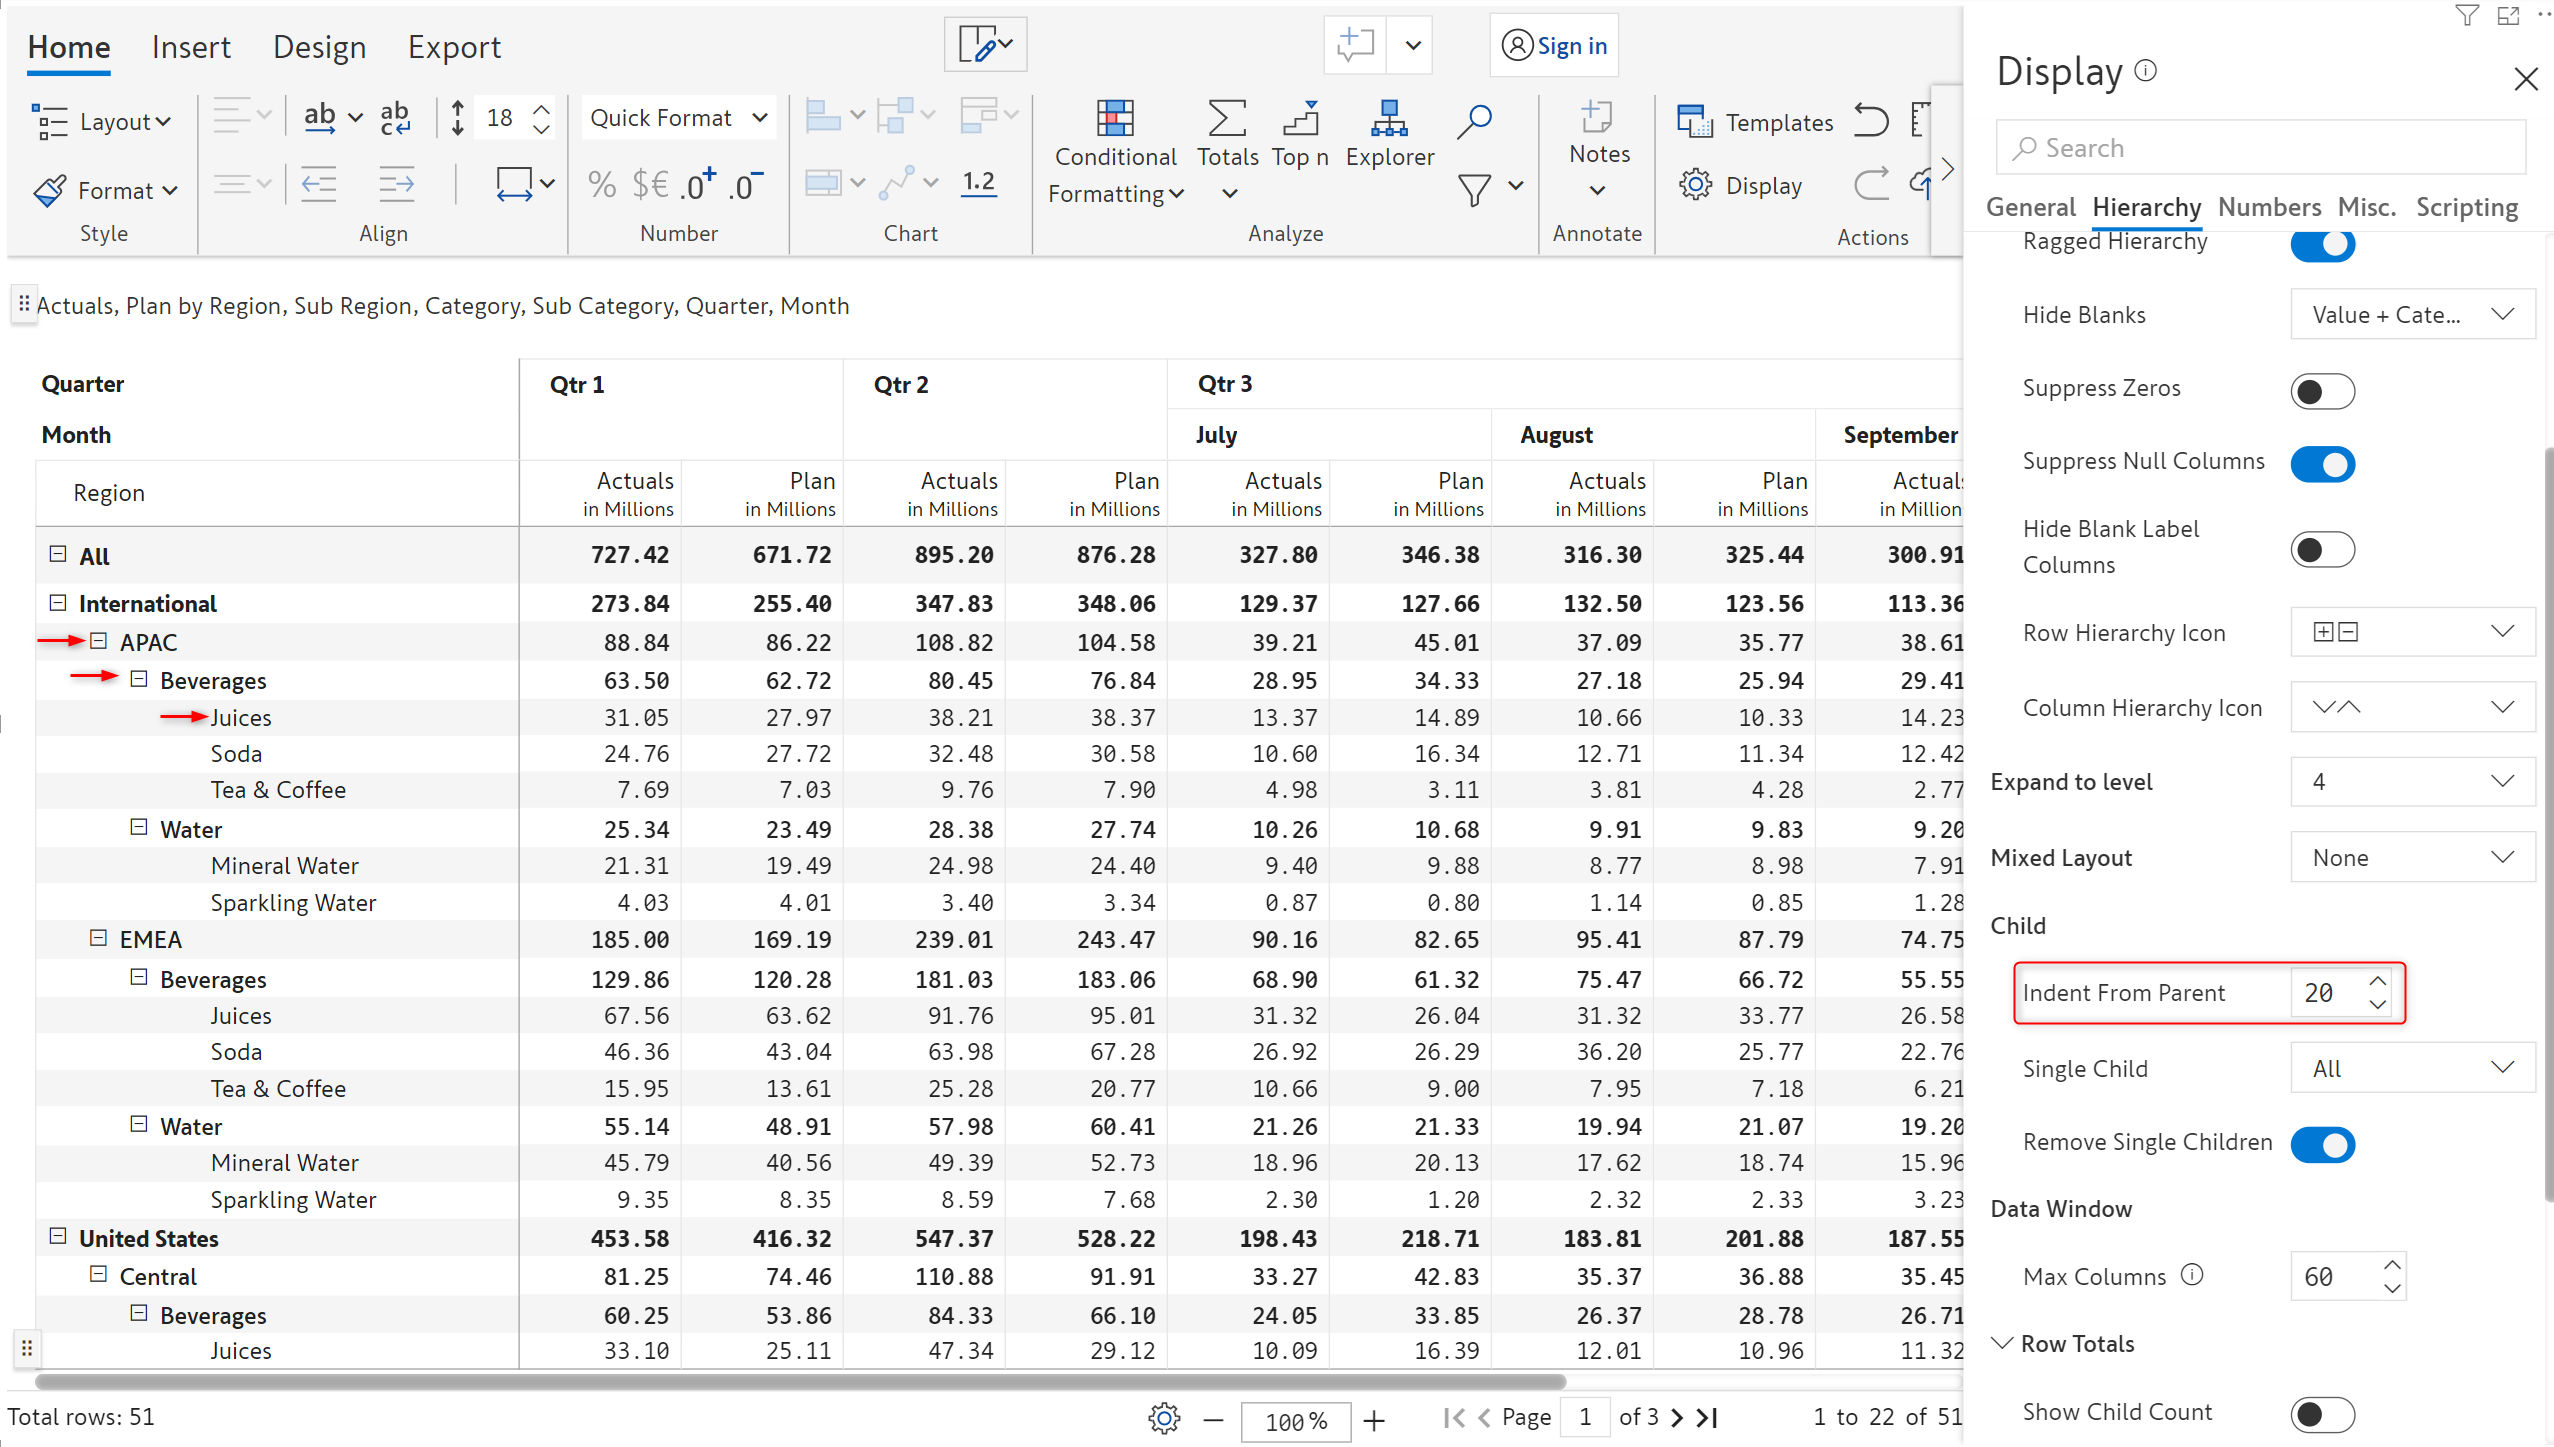
#### 4.1. Indent from parent&#x20;

This option lets you set the amount of indentation that has to be applied to the child rows from the parent row.

{% hint style="info" %}
The minimum and maximum indentation values are 1 and 25 respectively.
{% endhint %}

In the image below, every child row has been indented from its parent row by the specified amount.

<figure><img src="https://3062809325-files.gitbook.io/~/files/v0/b/gitbook-x-prod.appspot.com/o/spaces%2FEbkCXCUXmtUq5tcnUtZE%2Fuploads%2FFu89mvZp2K1zRM3qg4I3%2Fimage.png?alt=media&amp;token=bf9cdb82-9df0-403a-8d76-57bbee28306d" alt=""><figcaption><p>Indent from parent</p></figcaption></figure>

#### 4.2. Single child&#x20;

Using this option you can select which nodes to display when a parent hierarchy has only one child. In this example, we have a multi-level account hierarchy with several single-child rows and blank rows.&#x20;

The sales and marketing expenses row has only one child. The personnel cost row's child rows have blank rows. Let's see how this report is displayed for each of the options.

* **All** - Displays all the rows i.e. the parent rows and the single child rows. There are blank rows at levels 5 and 6.

<figure><img src="https://3062809325-files.gitbook.io/~/files/v0/b/gitbook-x-prod.appspot.com/o/spaces%2FEbkCXCUXmtUq5tcnUtZE%2Fuploads%2FC8pu9aXG3Hj0aPvLQK4u%2FSingle%20child%20all.png?alt=media&amp;token=2e3c724b-0cdb-424e-b034-2ef8e9b8340e" alt=""><figcaption><p>Single child - All</p></figcaption></figure>

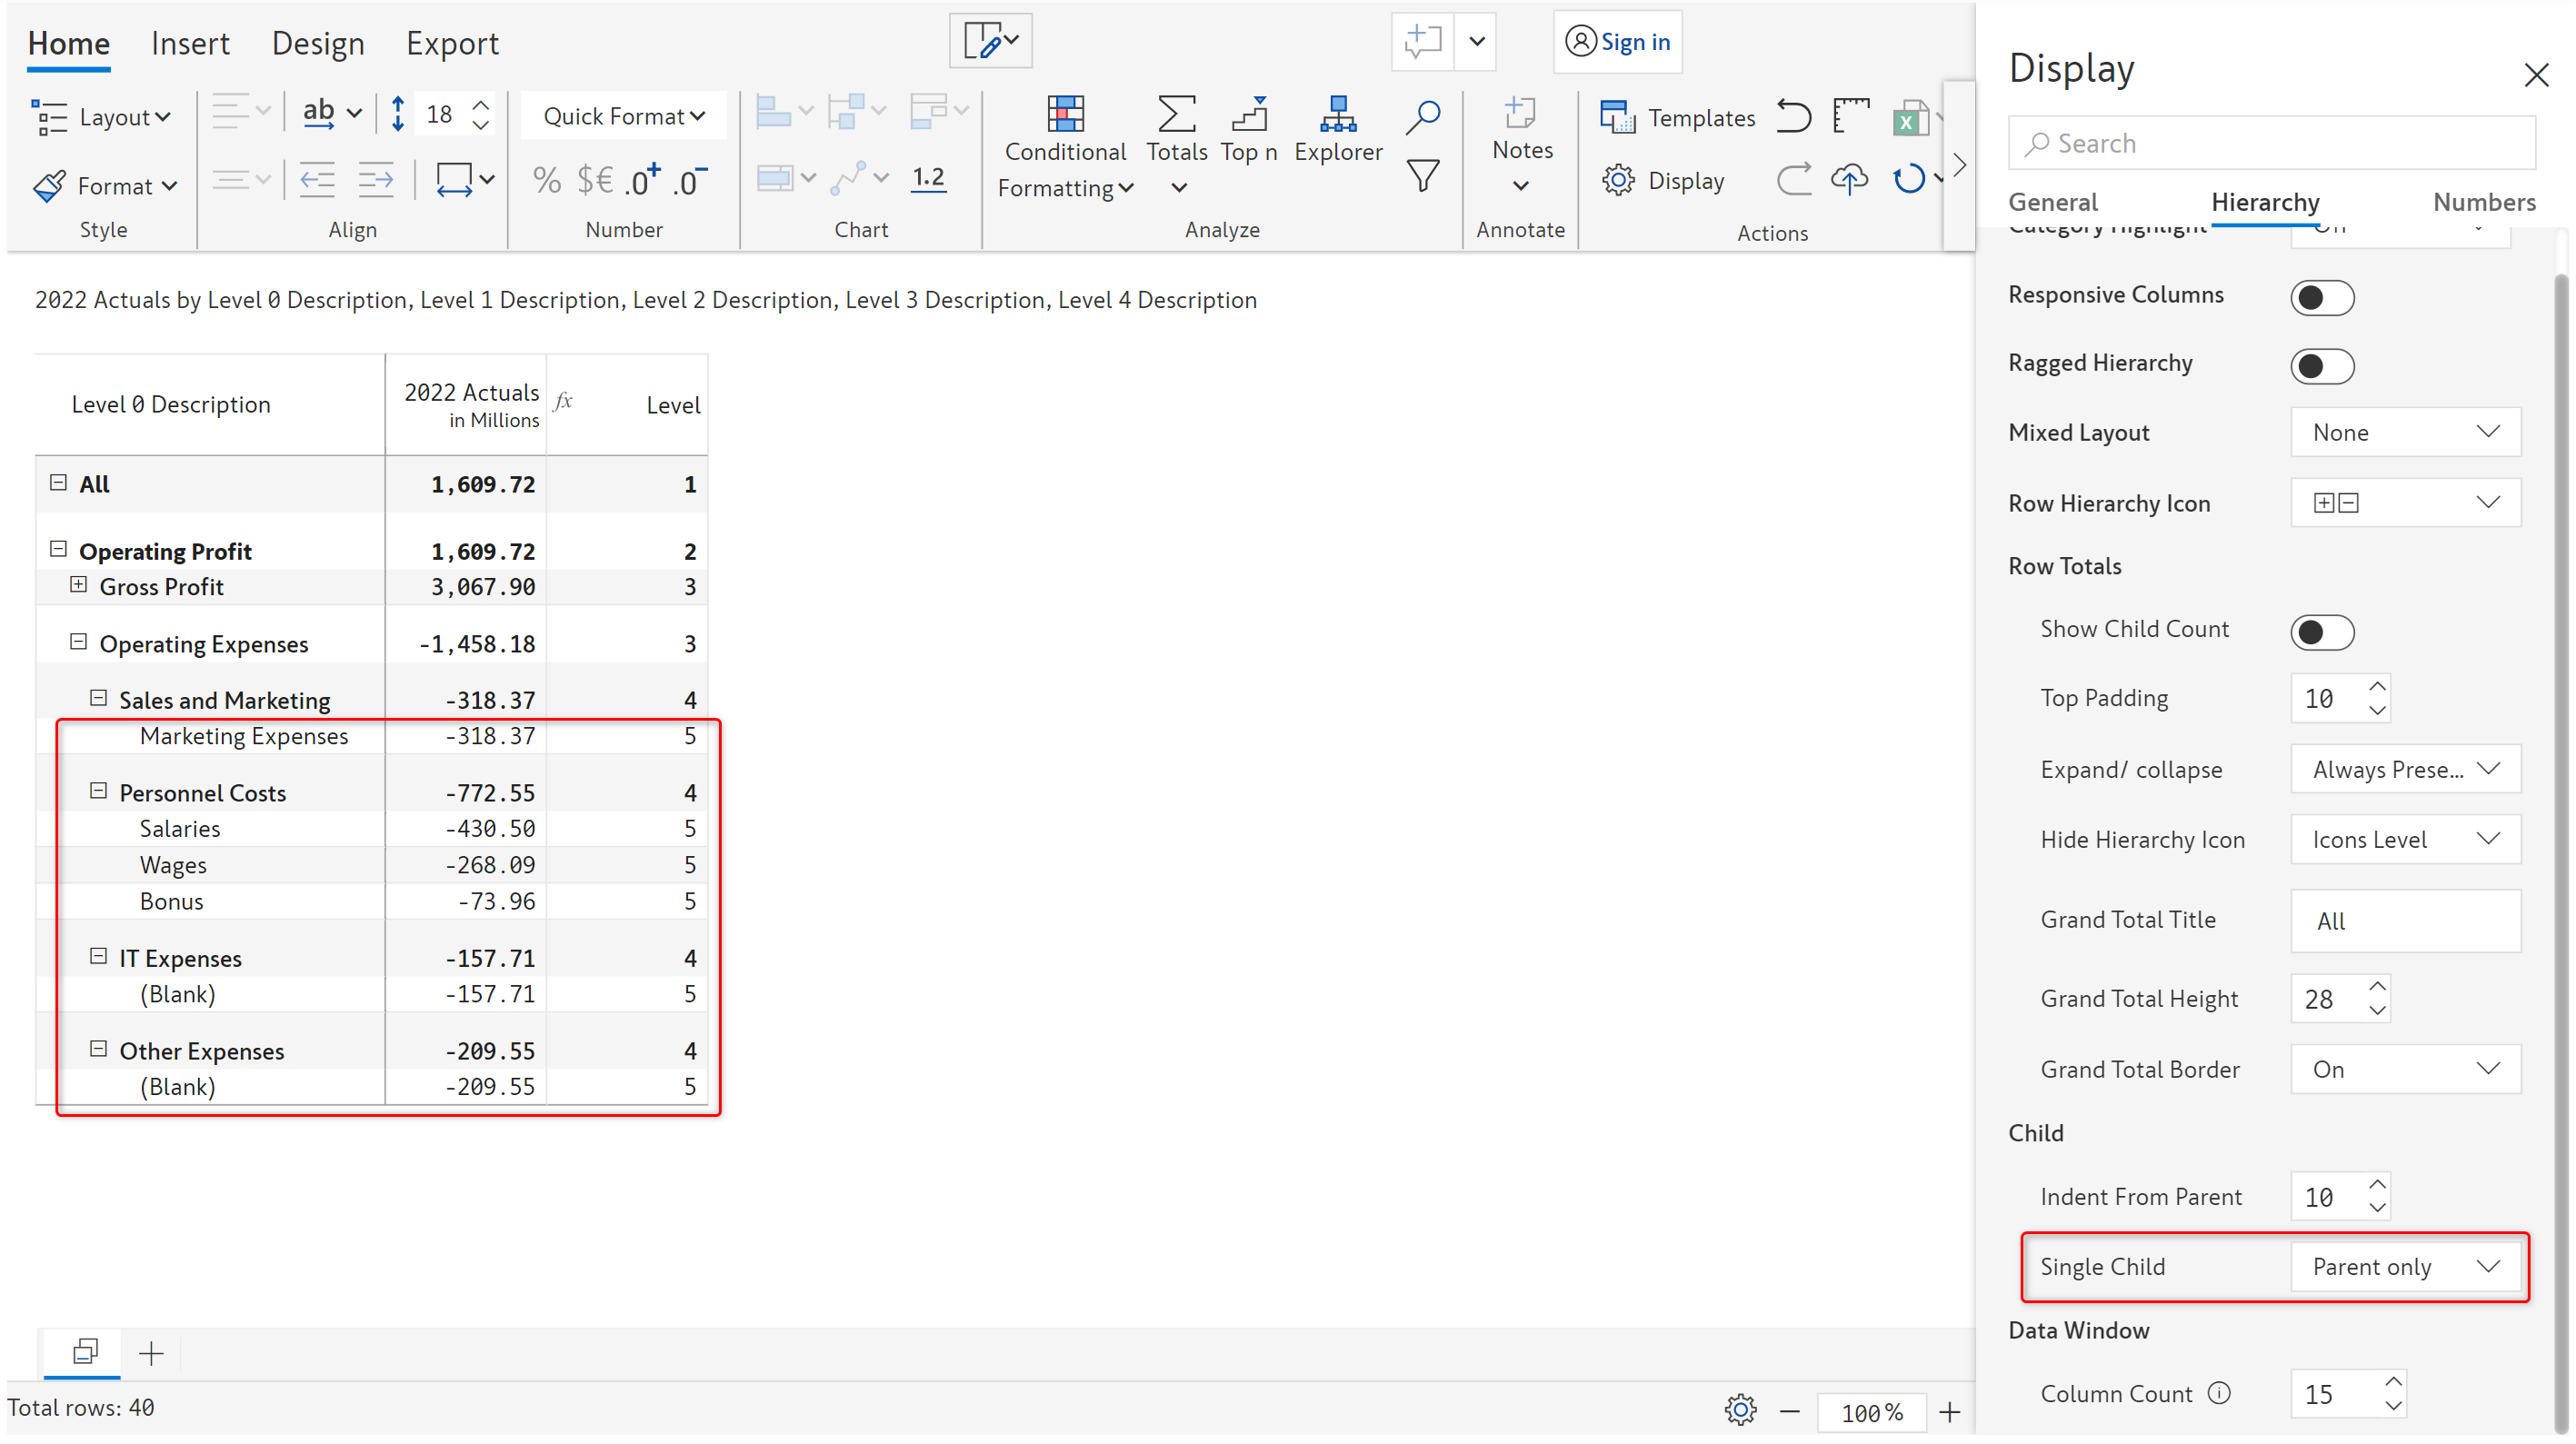
* **Parent only** - Displays the parent nodes of the single child. The blank rows at level 6 have all been hidden as shown below. The blank rows at level 5 are still shown.&#x20;

<figure><img src="https://3062809325-files.gitbook.io/~/files/v0/b/gitbook-x-prod.appspot.com/o/spaces%2FEbkCXCUXmtUq5tcnUtZE%2Fuploads%2Ft3zdfKgBHB3c13ChcdN9%2FSingle%20child%20parent%20only.png?alt=media&amp;token=363c4bd0-ce70-4a5d-9500-86d4919a4457" alt=""><figcaption><p>Single child - Parent only</p></figcaption></figure>

* **Parent (Multi-level) -** Displays only the highest level row of the multi-level hierarchy. The blank rows at both levels 5 and 6 are not shown.&#x20;

<figure><img src="https://3062809325-files.gitbook.io/~/files/v0/b/gitbook-x-prod.appspot.com/o/spaces%2FEbkCXCUXmtUq5tcnUtZE%2Fuploads%2F7WX60D8hUwHiiPj6SLFK%2FSingle%20child%20parent%20multilevel.png?alt=media&amp;token=fd7ffd11-30cd-40a5-b031-9674de2e2c44" alt=""><figcaption><p>Single child - Parent multi-level</p></figcaption></figure>

* **Single child level as parent -** Displays the single child as the parent of its level.&#x20;

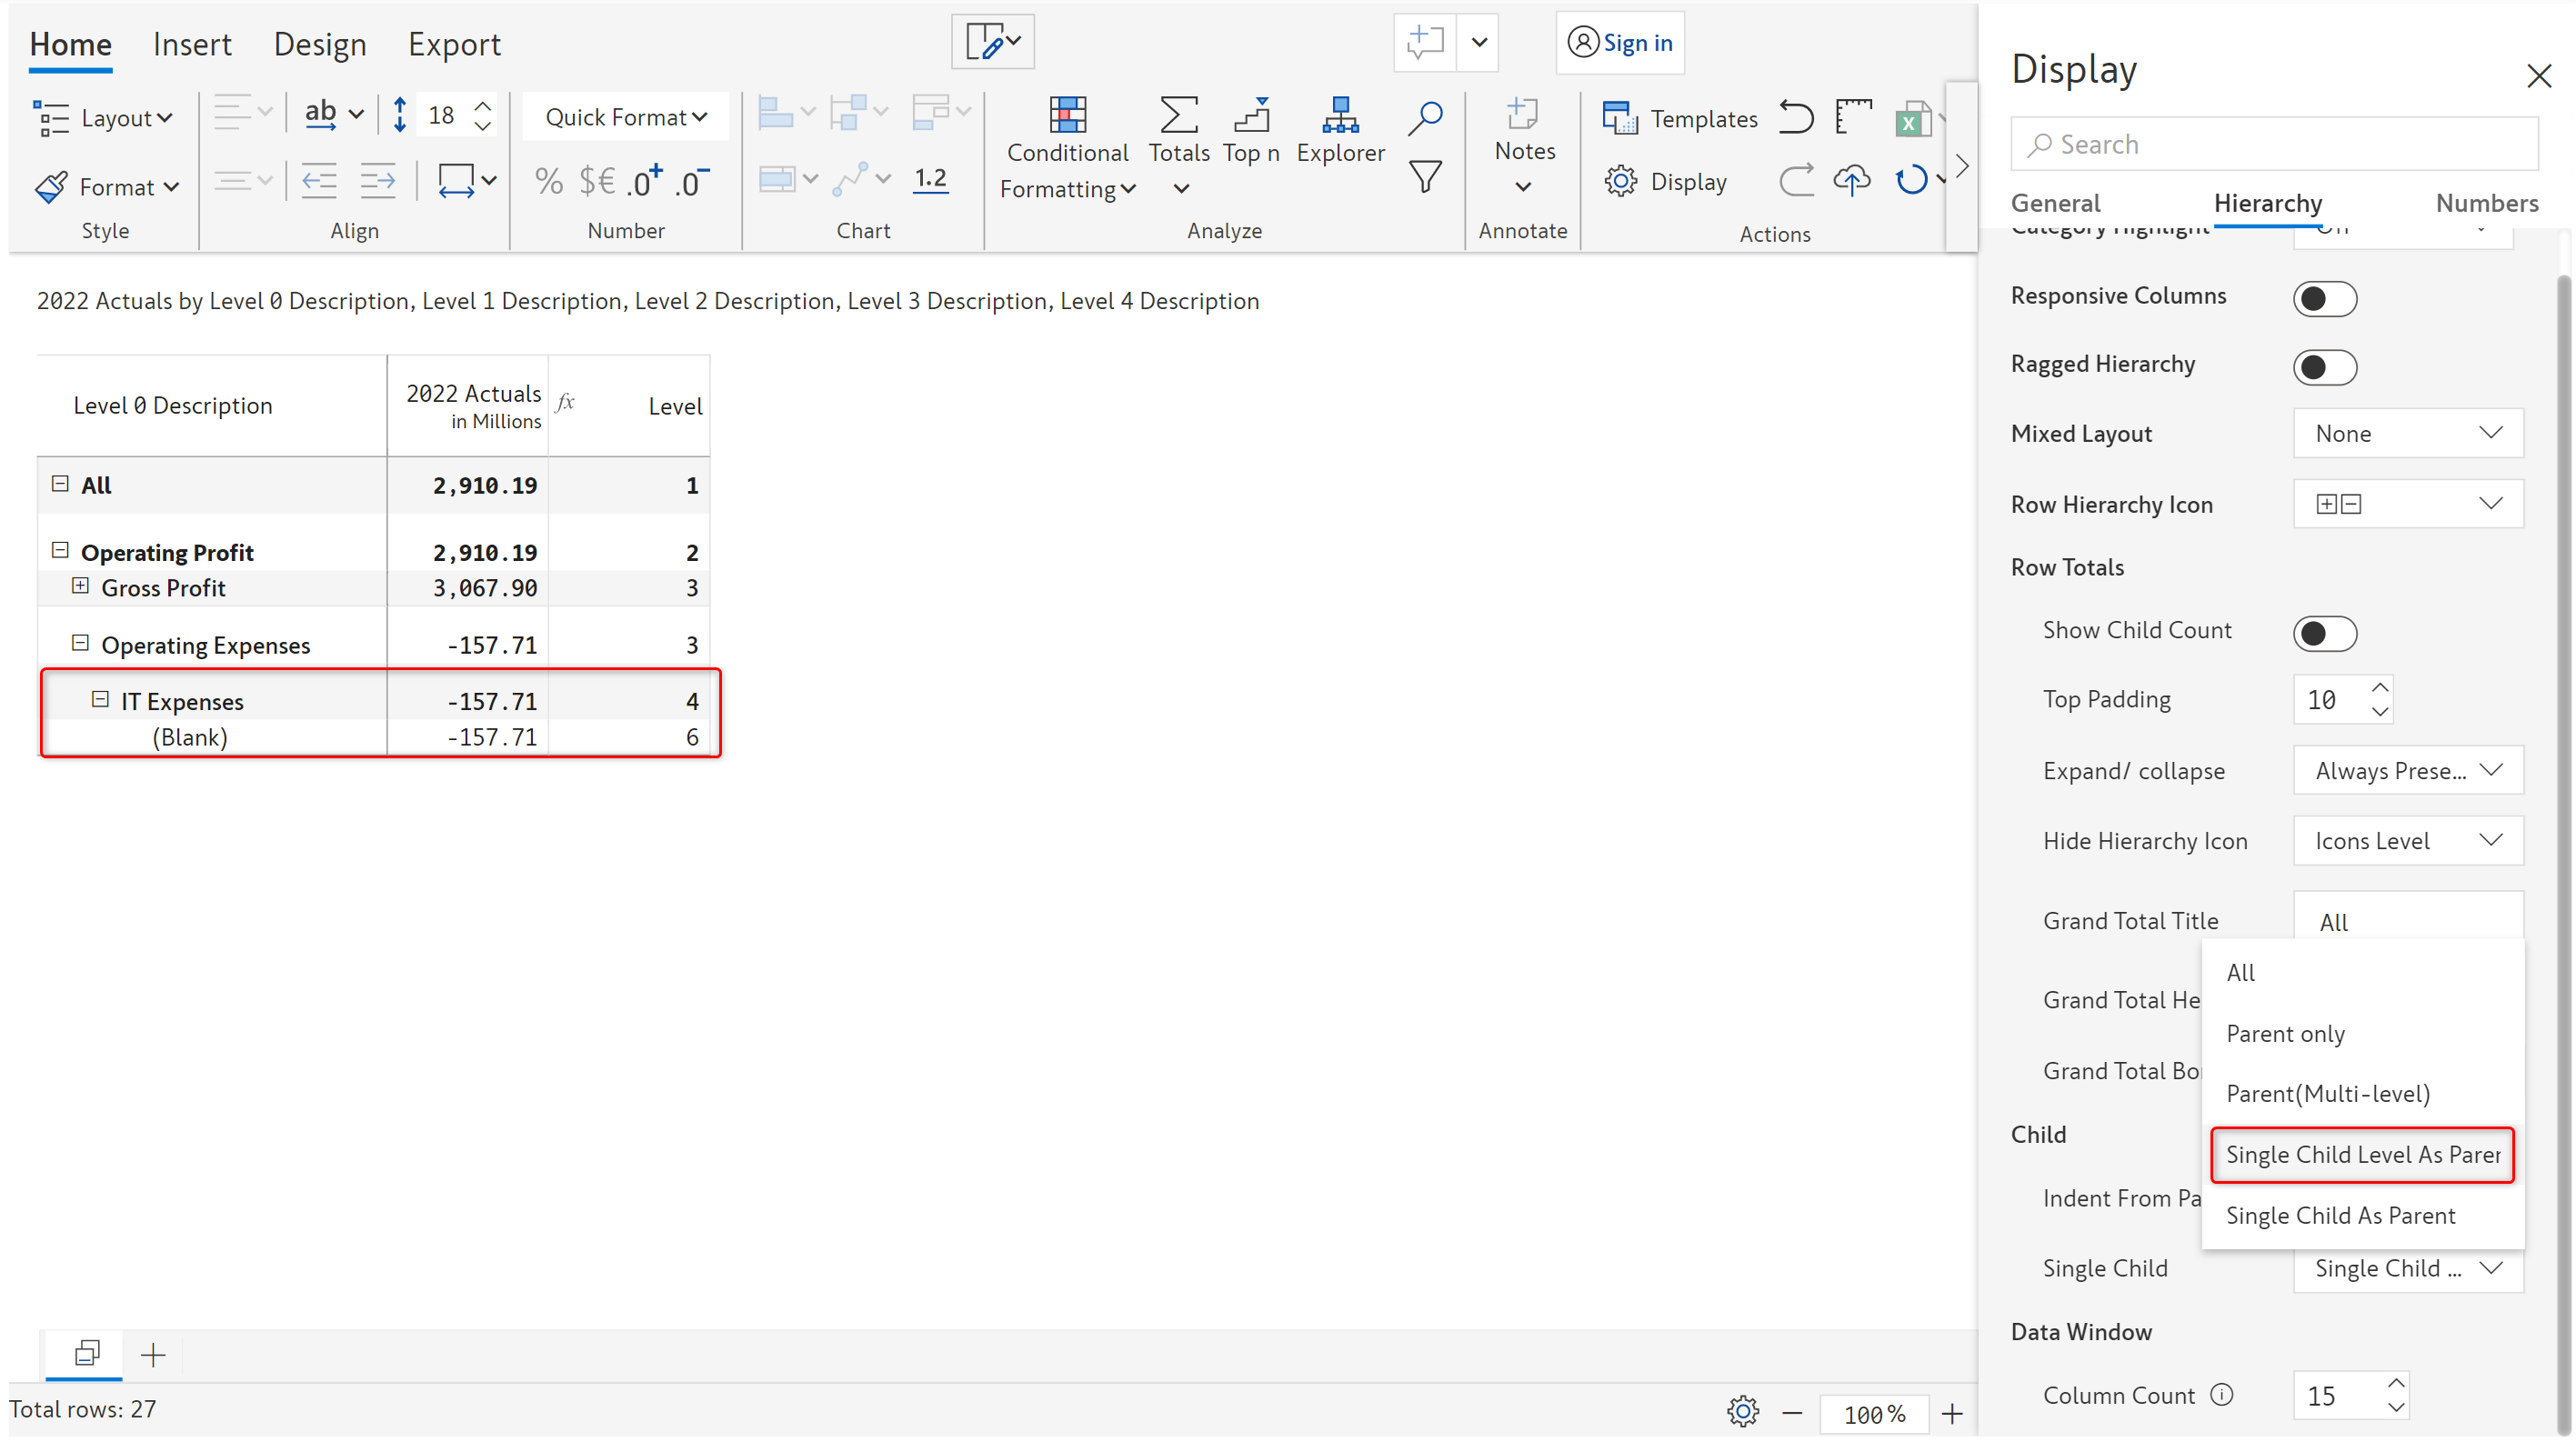
Let's take a different scenario to explain the S*ingle Child Level As Parent* and S*ingle Child As Parent* options. As you can see below, under Operating expenses we have filtered only IT expenses. You can see blanks at levels 5 and 6.

<figure><img src="https://3062809325-files.gitbook.io/~/files/v0/b/gitbook-x-prod.appspot.com/o/spaces%2FEbkCXCUXmtUq5tcnUtZE%2Fuploads%2FTxADCITDHVpfv3cuc1x6%2FSingle%20child%20level%20as%20parent%201.png?alt=media&amp;token=de19fd0c-42f7-4c4f-9055-d69d6a90cc63" alt=""><figcaption><p>Single child at level 4</p></figcaption></figure>

On selecting S*ingle Child Level As Parent*, you can see that the level 6 blank row is shown as the child for the level 4 row.

<figure><img src="https://3062809325-files.gitbook.io/~/files/v0/b/gitbook-x-prod.appspot.com/o/spaces%2FEbkCXCUXmtUq5tcnUtZE%2Fuploads%2FHJKdepPvfGxk4E3Gts1I%2FSingle%20child%20level%20as%20parent.png?alt=media&amp;token=4354a889-26db-4c15-8265-67ab861f1d1e" alt=""><figcaption><p>Single child level as parent</p></figcaption></figure>

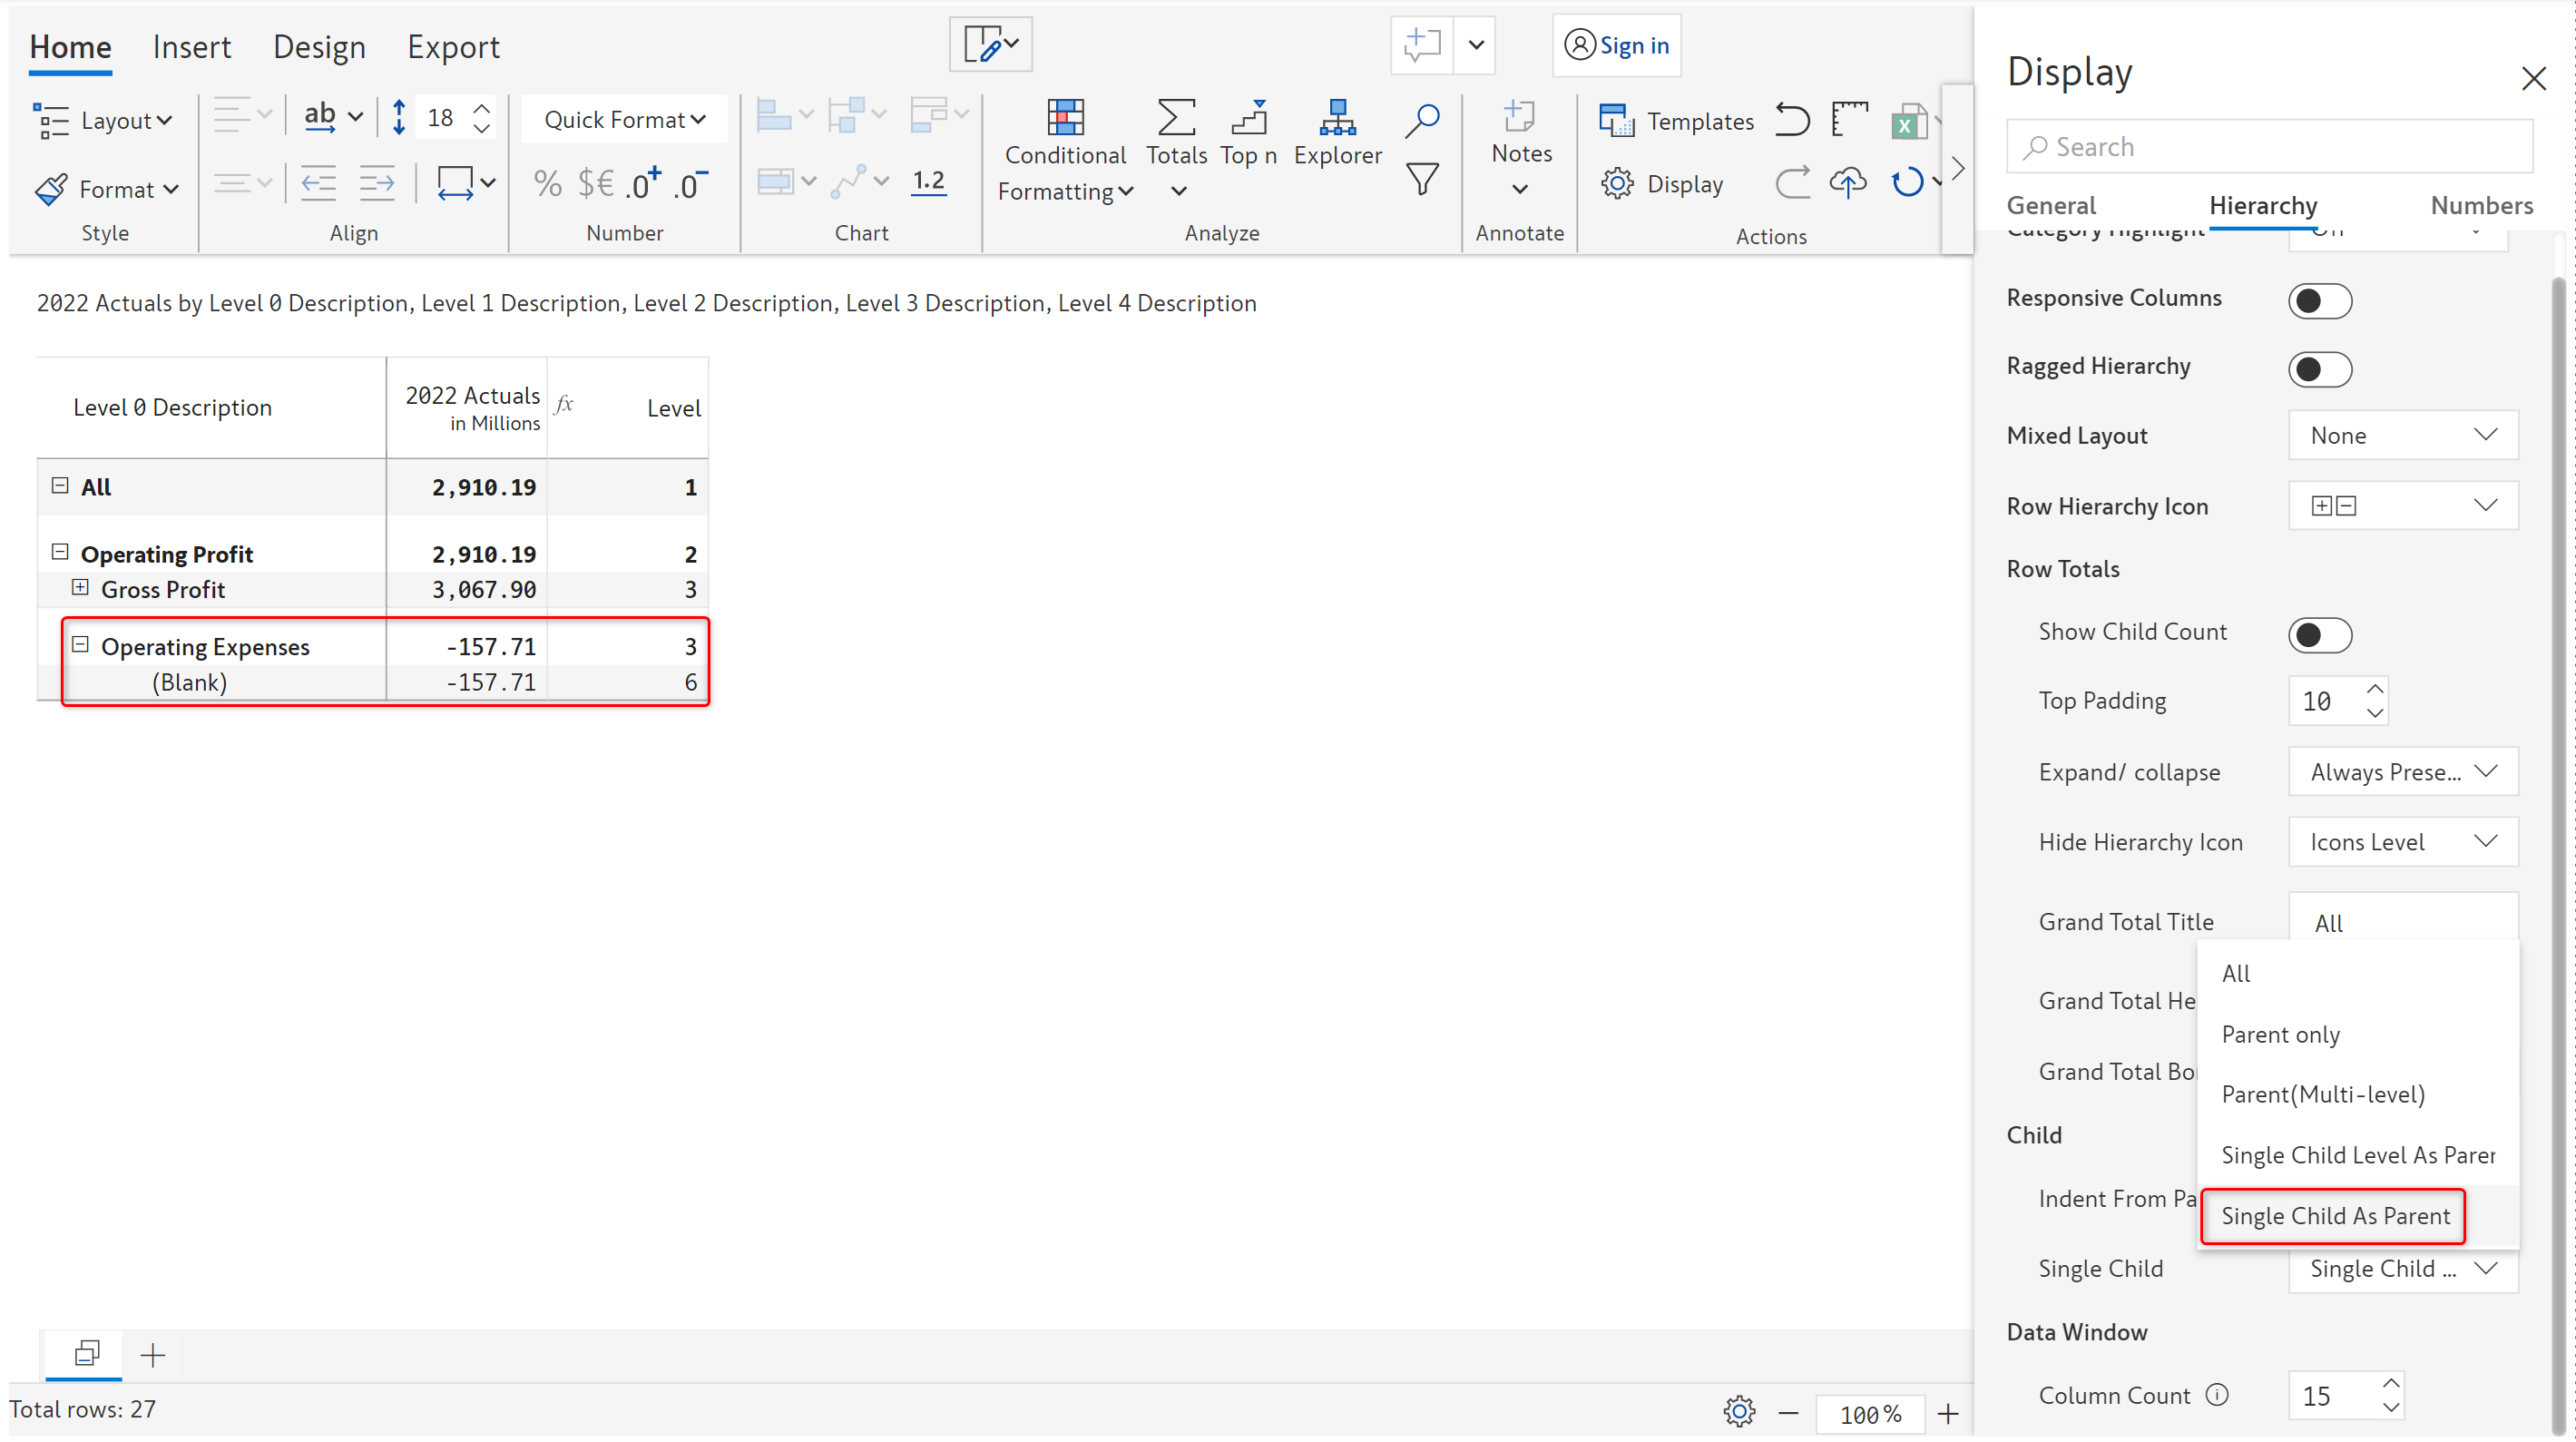
* **Single child as parent -** Displays only the single child at the lowest level. The blank row at level 6 is shown as the child for the level 3 row.

<figure><img src="https://3062809325-files.gitbook.io/~/files/v0/b/gitbook-x-prod.appspot.com/o/spaces%2FEbkCXCUXmtUq5tcnUtZE%2Fuploads%2FzOS9kapR8qOzBQcPacN3%2FSingle%20child%20as%20parent%201.png?alt=media&amp;token=cc4c2929-c903-4d02-a862-58834a1c4bd5" alt=""><figcaption><p>Single child as parent</p></figcaption></figure>

## 5. Data window

#### 5.1. Max columns&#x20;

Inforiver supports wide table use cases through the dynamic columns feature. You can fetch up to 1000 columns, however, the performance would be compromised. &#x20;

Every fetch from Power BI is 30,000 cells (No of rows x No of columns). This means you can load data chunks of different sizes dynamically - 500 Rows by 60 Columns (or) 30 Rows by 1000 Columns (or) 10,000 Rows by 3 Columns.

You can view the current column count by hovering over the 'i' icon and modify the column count if needed.

<figure><img src="https://3062809325-files.gitbook.io/~/files/v0/b/gitbook-x-prod.appspot.com/o/spaces%2FEbkCXCUXmtUq5tcnUtZE%2Fuploads%2FPzMYpj5hE6gcqlrMBnL1%2Fimage.png?alt=media&amp;token=0df97f8d-ed99-4e77-882d-7af3c77cddff" alt=""><figcaption><p>Column count</p></figcaption></figure>

Learn more about dynamically setting data chunk size using Power BI's [fetchMoreData API](https://learn.microsoft.com/en-us/power-bi/developer/visuals/fetch-more-data).

## 6. Row totals

You can customize the totals and subtotals by adding child count, padding, border, editing titles, and more. The available options are explained below.

#### 6.1. Show child count&#x20;

Enabling this option will display the count of child rows next to the name of the parent row in brackets.

<figure><img src="https://3062809325-files.gitbook.io/~/files/v0/b/gitbook-x-prod.appspot.com/o/spaces%2FEbkCXCUXmtUq5tcnUtZE%2Fuploads%2FtRdfe0ke2YDYNQIRJzEH%2Fimage.png?alt=media&amp;token=96f74c21-00a6-404a-b7f2-a36ea83080c9" alt=""><figcaption><p>Show child count</p></figcaption></figure>

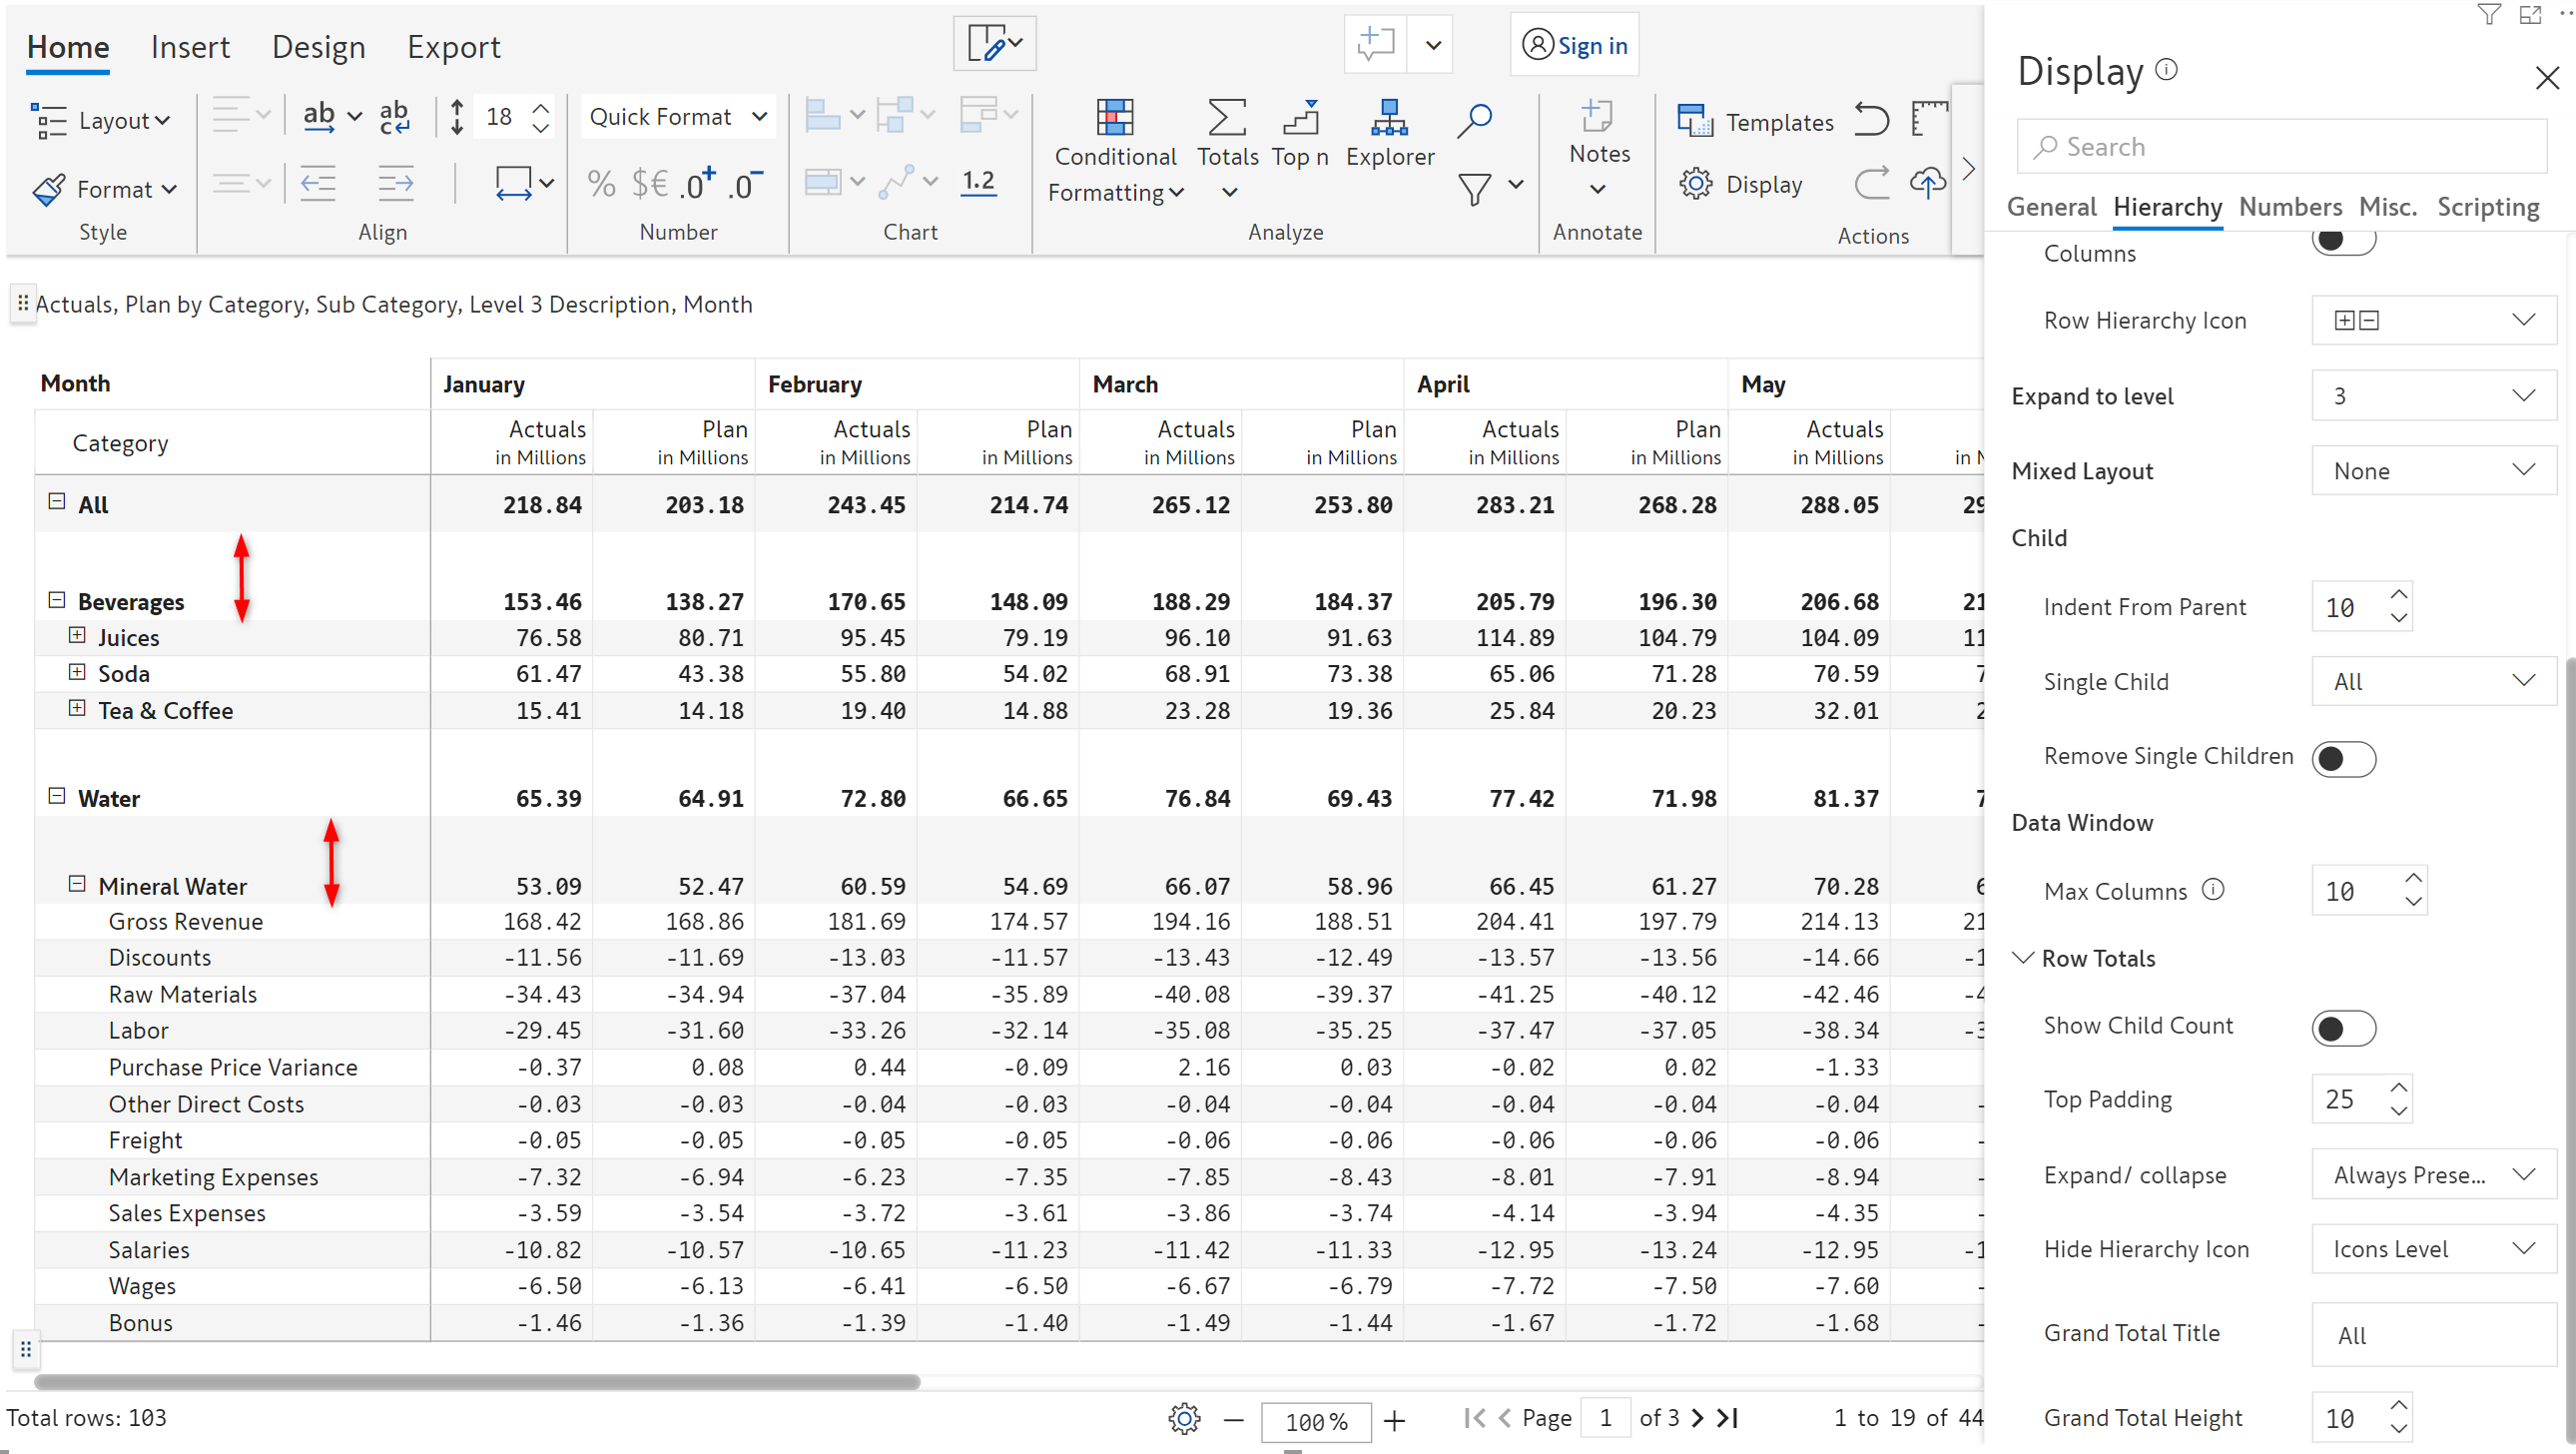
#### 6.2. Top padding&#x20;

Using this option, you can configure the spacing/padding between row hierarchies.

<figure><img src="https://3062809325-files.gitbook.io/~/files/v0/b/gitbook-x-prod.appspot.com/o/spaces%2FEbkCXCUXmtUq5tcnUtZE%2Fuploads%2Fqsw7R6uwDe5CVzf3Q3Ld%2Fimage.png?alt=media&amp;token=6e4de481-4fac-4c10-b78b-5d0a75be42b7" alt=""><figcaption><p>Top padding</p></figcaption></figure>

#### 6.3. Expand/collapse&#x20;

This option lets you specify when the expand/collapse icons for the hierarchies have to be displayed.

* **Always present** - Expand/collapse icon will be always present
* **Only on hover** - The expand/collapse icons are displayed only when you hover over the rows

<figure><img src="https://3062809325-files.gitbook.io/~/files/v0/b/gitbook-x-prod.appspot.com/o/spaces%2FEbkCXCUXmtUq5tcnUtZE%2Fuploads%2FgGLfweGiQ50lVCNeSl2Z%2Fimage.png?alt=media&amp;token=d481b246-d4fd-41f9-8d00-17a2b73ea424" alt=""><figcaption><p>Expand/Collapse icons</p></figcaption></figure>

#### 6.4. Hide hierarchy icon

With this option, you can specify the fields for which you want to hide the hierarchy icon. All the fields are selected by default, and unselecting any field will hide the hierarchy icon for that field. In the below image, the 'Sub Category' field has been unselected, therefore the hierarchy icon for that field has been hidden.

<figure><img src="https://3062809325-files.gitbook.io/~/files/v0/b/gitbook-x-prod.appspot.com/o/spaces%2FEbkCXCUXmtUq5tcnUtZE%2Fuploads%2Fk8hGrds9R68oQDlzD4Ay%2Fimage.png?alt=media&amp;token=036809f1-bf57-4246-a8ee-72398c67e4fc" alt=""><figcaption><p>Hide hierarchy icon</p></figcaption></figure>

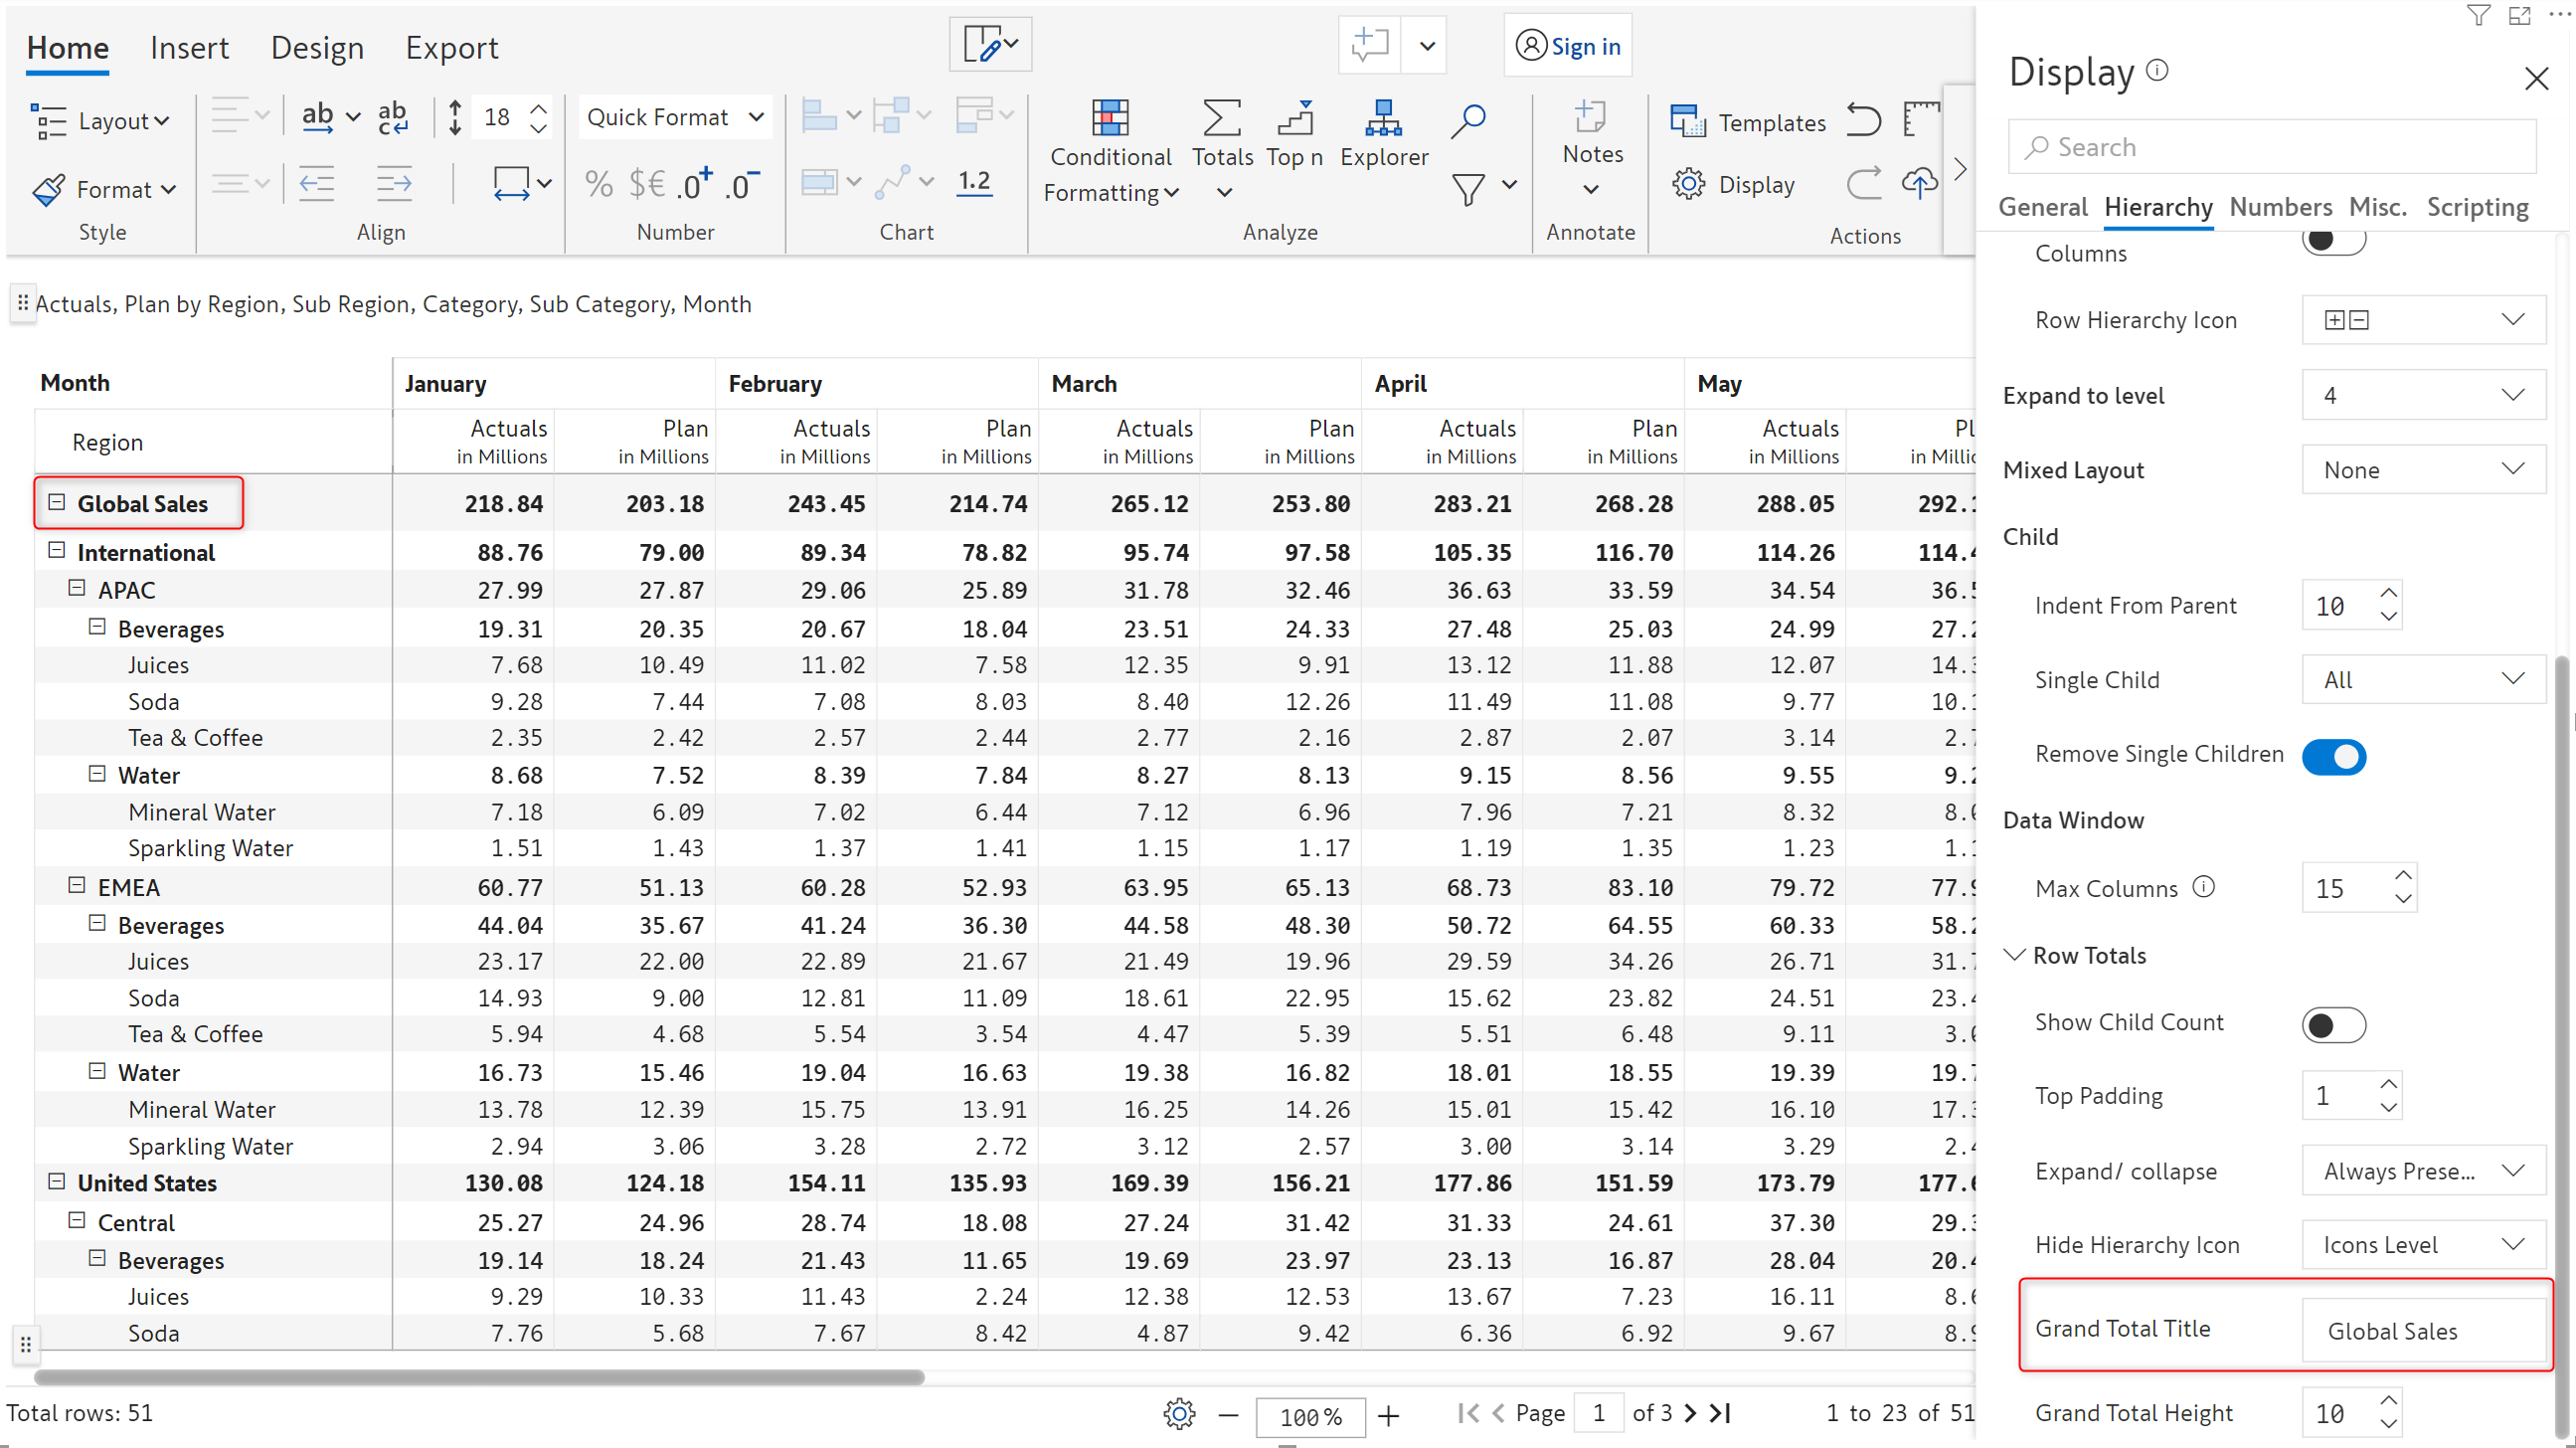
#### 6.5. Grand total title&#x20;

{% hint style="info" %}
The options related to Grand total can be seen only if the Row/Column Grand Total value has not been set to ‘Off’ under the ‘Totals’ option.&#x20;
{% endhint %}

You can set a custom title for the grand total in the textbox.

<figure><img src="https://3062809325-files.gitbook.io/~/files/v0/b/gitbook-x-prod.appspot.com/o/spaces%2FEbkCXCUXmtUq5tcnUtZE%2Fuploads%2Fc3HpLIE3OKZNcCyFH4r7%2Fimage.png?alt=media&amp;token=5156841d-f562-4c52-845e-2ff8011df5fa" alt=""><figcaption><p>Grand total title</p></figcaption></figure>

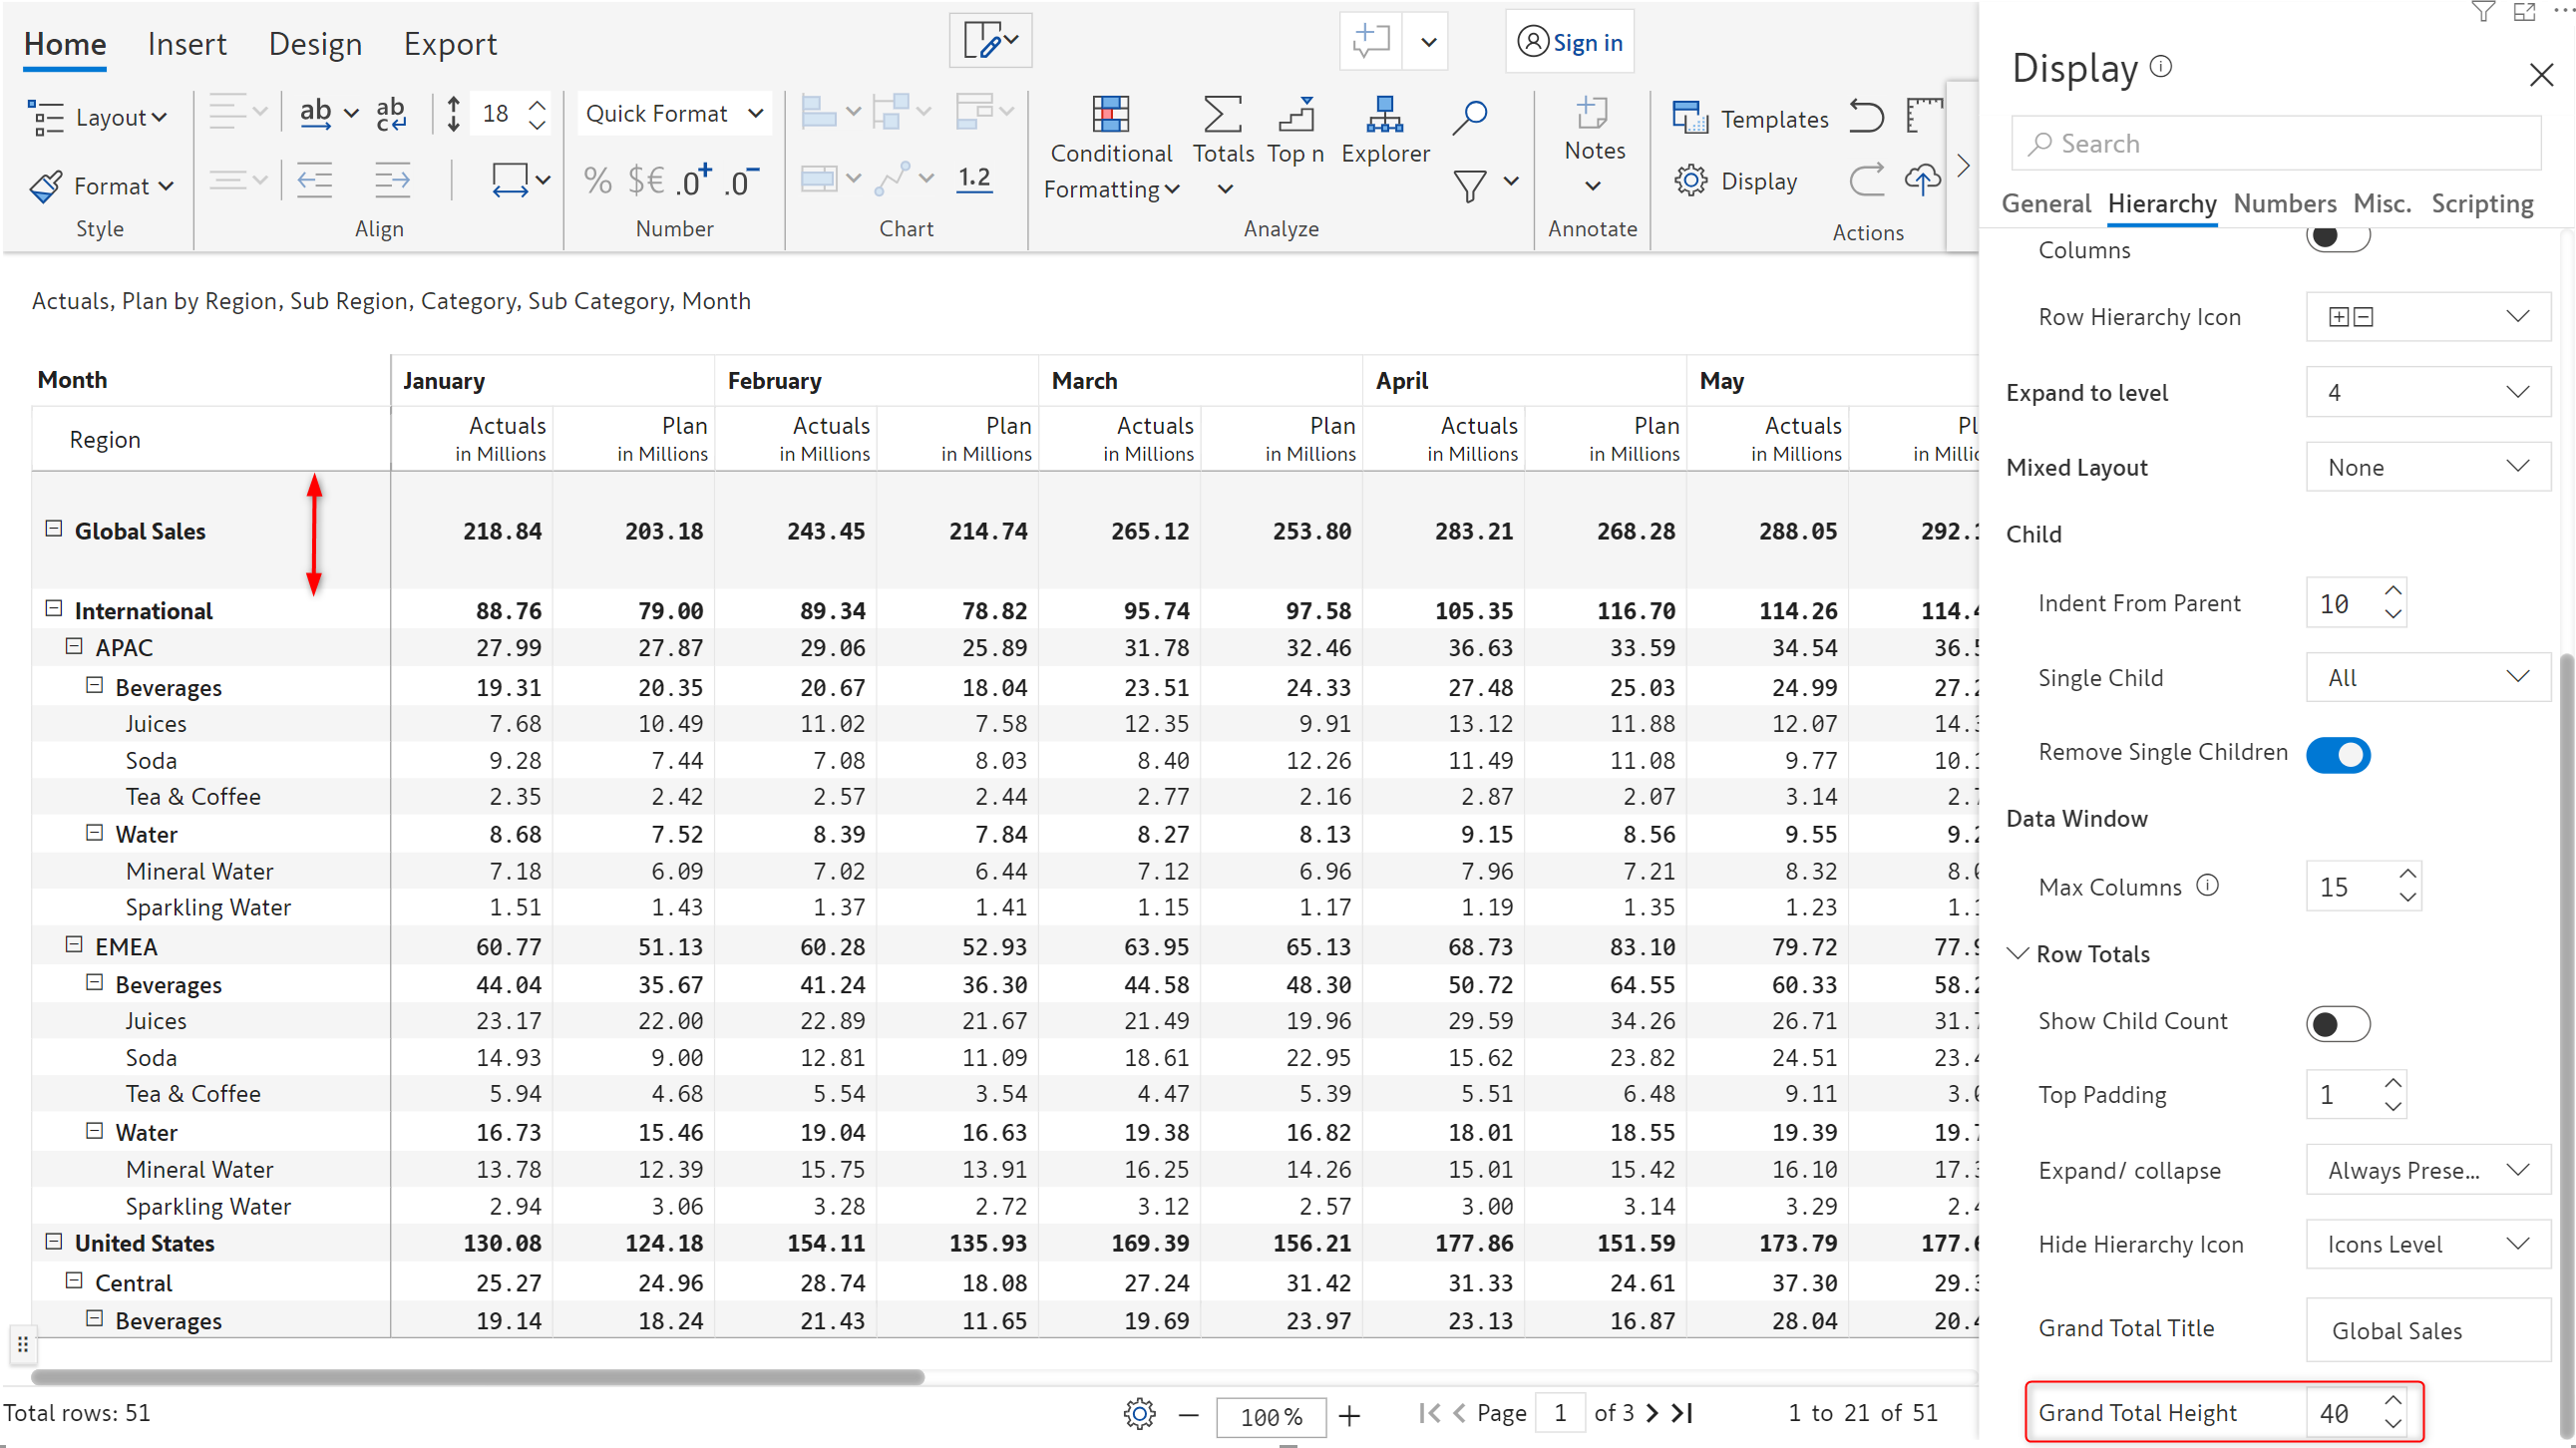
#### 6.6. Grand total height&#x20;

The value that you specify here will override the default height of the grand total row.

{% hint style="info" %}
The minimum and maximum values for grand total height are 5 and 45 respectively.
{% endhint %}

<figure><img src="https://3062809325-files.gitbook.io/~/files/v0/b/gitbook-x-prod.appspot.com/o/spaces%2FEbkCXCUXmtUq5tcnUtZE%2Fuploads%2F4Xne1afWC7paqUeWcPOY%2Fimage.png?alt=media&amp;token=5ad42206-8e9b-44d6-8442-3d51755a9fc7" alt=""><figcaption><p>Grand Total Height</p></figcaption></figure>

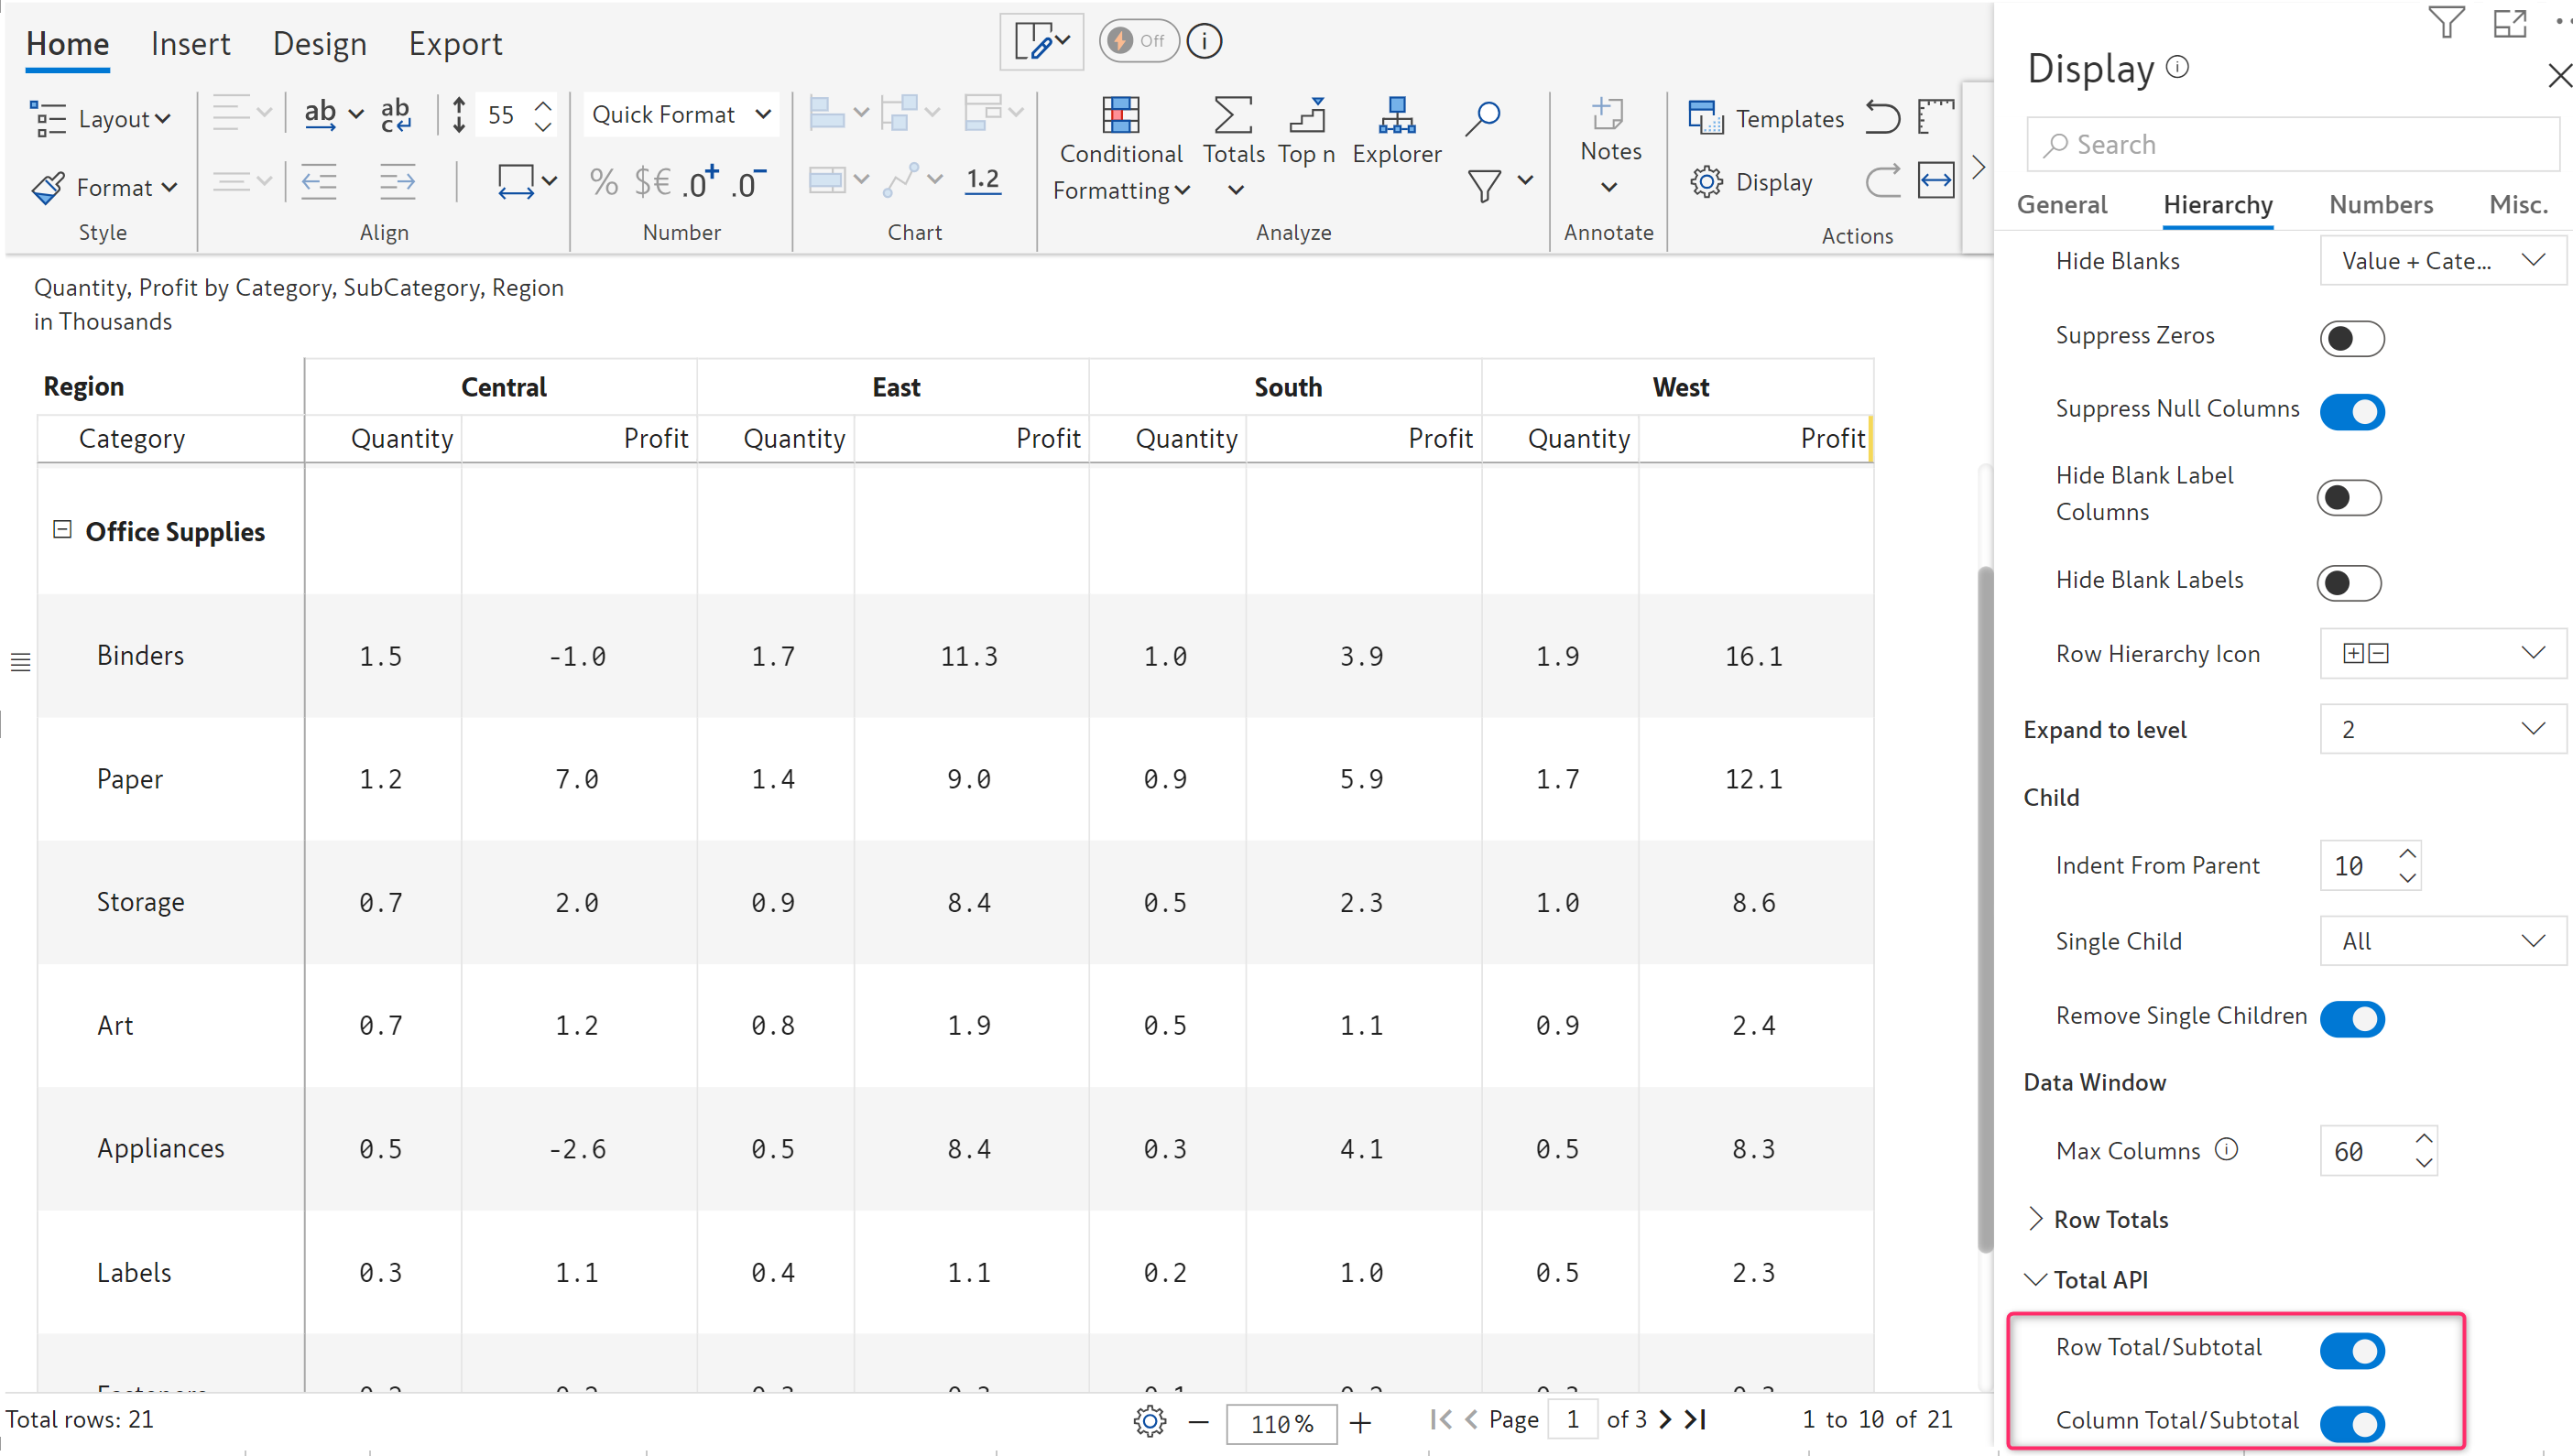
## 7. Total API

Inforiver pre-calculates the totals and subtotals for your data while loading the report. If your dataset is large and you do not require totals in your reports, you can substantially reduce the loading time of your report and boost its performance with the Total API option.&#x20;

You can disable the total and sub-total calculations for rows and columns separately.

<figure><img src="https://3062809325-files.gitbook.io/~/files/v0/b/gitbook-x-prod.appspot.com/o/spaces%2FEbkCXCUXmtUq5tcnUtZE%2Fuploads%2Fg1eyzVPsfANa4J7Ghcv3%2Fimage.png?alt=media&amp;token=38fd8774-81be-48f7-bc91-294530d66dcf" alt=""><figcaption><p>Total API</p></figcaption></figure>

#### 7.1. Row Total/Subtotal

Disable this to stop row-level total and sub-total calculations while loading your report.

#### 7.2. Column Total/Subtotal

Disable this to stop column-level total and sub-total calculations while loading your report.

Notice the time taken when Inforiver pre-calculates the totals and subtotals:&#x20;

<figure><img src="https://3062809325-files.gitbook.io/~/files/v0/b/gitbook-x-prod.appspot.com/o/spaces%2FEbkCXCUXmtUq5tcnUtZE%2Fuploads%2FlhAZDA1IfPkEqR5IVmon%2Fimage.png?alt=media&amp;token=1bf639ed-e335-4775-8048-639d3be58f5c" alt=""><figcaption><p>When Totals are pre-calculated</p></figcaption></figure>

When the total calculation is disabled, even large datasets can be fetched in milliseconds as shown in the screengrab below.

<figure><img src="https://3062809325-files.gitbook.io/~/files/v0/b/gitbook-x-prod.appspot.com/o/spaces%2FEbkCXCUXmtUq5tcnUtZE%2Fuploads%2FFptqlmkR6EgdKZ1otLFZ%2Fimage.png?alt=media&amp;token=cc3c9788-3b2c-44b3-871e-a1a37f5ee9ea" alt=""><figcaption><p>After Disabling the Total API</p></figcaption></figure>

**Resources**

[Implementing tables with 100+ columns (wide tables) in Power BI](https://inforiver.com/blog/general/implementing-wide-tables-with-more-than-100-columns-in-power-bi/)

In this section, we covered the hierarchy display settings. Navigate to the next section to learn more about [advanced number formatting](/~/changes/mS6jwvARNLHpKqBa4cT9/display-settings/number-settings.md).<br>


---

# Agent Instructions
This documentation is published with GitBook. GitBook is the documentation platform designed so that both humans and AI agents can read, navigate, and reason over technical content effectively. Learn more at gitbook.com.

## Querying This Documentation
If you need additional information that is not directly available in this page, you can query the documentation dynamically by asking a question.

Perform an HTTP GET request on the current page URL with the `ask` query parameter, and the optional `goal` query parameter:

```
GET https://docs.inforiver.com/~/changes/mS6jwvARNLHpKqBa4cT9/display-settings/hierarchy-settings.md?ask=<question>&goal=<endgoal>
```

`ask` is the immediate question: it should be specific, self-contained, and written in natural language.
`goal` is optional and describes the broader end goal you are ultimately trying to accomplish on behalf of the user. GitBook uses it to tailor the answer towards what is most useful for that goal.

The response will contain a direct answer to the question and relevant excerpts and sources from the documentation.

Use this mechanism when the answer is not explicitly present in the current page, you need clarification or additional context, or you want to retrieve related documentation sections.