Inforiver
Premium Table
Premium Table
  • Introduction to Premium Table
    • Get Started
      • Installing from AppSource
      • Installing Inforiver for your organization (Org visual)
      • Inforiver Writeback Matrix pre-requisites
        • Whitelist Inforiver IPs
        • Admin consent for Inforiver's Entra ID
          • Basic consent
          • Full admin consent
      • Inforiver Customer Portal
        • Billing Admin
          • Update Profile
          • Update Subscriptions
        • License Admin
      • Licensing
        • License renewal
      • Registering Inforiver on Azure AD (Entra ID)
  • Working with Premium Table
    • 1. Build your first Inforiver Table report
    • 2. Displaying information
      • Report interface
      • Templates
      • Basic formatting
        • Number formatting
        • Cell, header & value formatting
        • Totals & subtotals
        • Insert blank rows
      • Basic inline charts
    • 3. Basic interactions
      • Explore & filter data
        • Search & Filter
        • Explorer
        • Top N + others
      • Sort & reorder data
      • Show/hide values
      • Manage column widths
      • Manage hierarchies
      • Create visual hierarchies
      • Pin rows & columns
      • Blend measures
      • Dynamic measure headers
      • Context menus
        • Column gripper
        • Row gripper
      • Actions
        • Rails
        • Toolbar options
        • Keyboard shortcuts
        • Reset
    • 4. Adding business logic and formulae
      • Insert calculated rows
        • Template rows
      • Insert calculated columns
      • Insert manual input rows
      • Insert manual input columns
        • Number
        • Dropdown
          • Dropdown options from semantic models
          • Lookup visuals for dropdowns
        • Text, checkbox & date
        • Writeback Matrix features
        • Importing data
      • Invert sign
      • Editing cells
      • Quick formula
      • Visual column inside visual measures
      • Manage inserted rows
      • Manage inserted measures & columns
      • Pivot data
      • Insert image URLs
    • 6. Working with charts
      • Sparkline charts
      • Stacked charts
      • Bullet charts and clustered bar charts
      • Waterfall charts
      • Bar and pin charts
      • Change/deviation charts
    • 5. Conditional formatting
      • One-click options
      • Create rule
        • Rules (If conditions)
        • Color scale & data bars
        • Classification
        • Ranking
      • Manage rules
    • 7. Planning, budgeting & forecasting
      • What-if analysis & simulations
      • Goal Seek
      • Budgeting & allocations
      • Set version
    • 8. Paginated reporting
      • Pagination
      • Header & footer
        • Text
        • Images
        • Charts
        • KPI cards
      • Report layouts (Report+)
      • Display and themes
    • 10. Exporting reports
      • Export to PDF & Excel
        • Excel export - operational boundaries
      • Ad hoc emails
    • 11. Scheduling reports
      • Create new subscription
        • Select a report
        • Set subscription frequency
        • Select destination(s)
          • Email
          • OneDrive
          • Microsoft Teams
          • SharePoint
        • Review & save subscription
      • Manage your subscriptions
      • Administration
    • 12. Data writeback
      • Settings
        • General Settings
        • Data Settings
        • Destination Settings
        • Writeback security settings
        • Writeback time-out & batch size settings
        • Advanced Settings
      • Destinations
        • Azure SQL (Managed DB)
        • Azure SQL
        • Microsoft SQL Server
        • Synapse Dedicated SQL Pool
        • Azure Data Lake Storage
        • Databricks
        • Snowflake
          • Setting up Snowflake OAuth
        • Amazon Redshift
        • BigQuery
        • SingleStore
        • SAP HANA
        • Oracle
        • PostgreSQL
        • MySQL
        • OneDrive
        • SharePoint
        • Dataverse
        • Fabric Warehouse
        • Fabric lakehouse
        • Fabric SQL
        • URL as destination
      • Logs
      • Reading mode
    • 14. Manage aggregation
      • Row aggregation
      • Column aggregation
    • 18. Variables
      • Variable types
        • Number
        • Select
        • Text
        • Date
        • Date range
        • Boolean
        • Button
      • Variable bookmarks
  • Admin Console
    • Manage Profile
    • User management
      • User Roles and Permissions
      • Create custom roles and policies
    • Settings
      • General
      • Generate builds - on prem
      • Forecast
      • Holidays
      • API token
      • Writeback
      • Managed DB
      • Assets
    • Onboarding actions
    • Writeback
  • Display settings
    • General settings
    • Hierarchy settings
    • Number settings
    • Miscellaneous settings
    • On-load scripting
  • Formula syntax
    • Conditional statements
      • IF
      • IFNA
      • SWITCH
      • FILTERIF
    • Logical functions
      • AND
      • IN
      • ISBLANK
      • ISEMPTY
      • ISNUMBER
      • NOT
      • OR
      • XOR
    • Math functions
      • ABS
      • AVERAGE
      • AVERAGEEXNEG
      • AVERAGEEXZERO
      • AVERAGEEXZERONEG
      • AVERAGEIF
      • CEILING
      • COUNT
      • COUNTIF
      • DIVIDE
      • EVEN
      • EXP
      • FLOOR
      • INDEXOF
      • LOG
      • ODD
      • MAX
      • MIN
      • NORMDIST
      • NORMSDIST
      • NORMINV
      • NORMSINV
      • PCT
      • POWER
      • RAND
      • RANDBETWEEN
      • ROUND
      • ROUNDDOWN
      • ROUNDUP
      • MROUND
      • SORT
      • SQRT
      • SUM
      • PMT
    • Text formatting functions
      • CONCATENATE
      • HYPERLINK
      • LEFT
      • LOWER
      • MID
      • PROPER
      • REPLACE
      • REPT
      • RIGHT
      • TEXT
      • TRIM
      • UPPER
      • VALUE
    • Date functions
      • DATEADD
      • DATEDIFF
      • DAY
      • DATE
      • DATE.SET
      • DATE.FORMAT
      • SOWEEK
      • SOMONTH
      • SOQTR
      • SOYEAR
      • EOWEEK
      • EOMONTH
      • EOQTR
      • EOYEAR
      • NETWORKDAYS
      • ADDDAYS
      • ADDWEEKS
      • ADDMONTHS
      • ADDQTRS
      • ADDYEARS
      • FROMEXCELDATE
      • MONTH
      • NOW
      • PERIOD_RANGE
      • TODAY
      • TOEXCELDATE
      • YEAR
    • Time intelligence functions
      • AGGREGATE
      • FILTER
      • COLUMN_PERIOD
      • LASTNDAY
      • LASTNMONTH
      • LASTNQTR
      • LASTNYEAR
      • MONTHPERIOD
      • MOVINGAVERAGE
      • MOVINGSUM
      • MTD
      • NEXTNDAY
      • NEXTNMONTH
      • NEXTNQTR
      • NEXTNYEAR
      • QTD
      • QTRPERIOD
      • SHIFT
      • TOTALYTD
      • TOTALQTD
      • TOTALMTD
      • VALUEAT
      • YEARPERIOD
      • YTD
    • Other operators
    • Identifiers
      • CLOSEDPERIOD
      • COLUMN.DATE
      • COLUMN.PARENT
      • COLUMNS
      • CURRENT_PERIOD
      • DESCENDANTS
      • FORECAST.CLOSED_END
      • FORECAST.CLOSED_START
      • FORECAST.OPEN_END
      • FORECAST.OPEN_START
      • GROUP INDEX
      • HAS
      • HAS_ALL
      • HAS_SOME
      • LEAVES
      • LEVEL
      • LOGGEDIN_EMAIL
      • LOGGEDIN_NAME
      • MATCH
      • MAXDATE
      • MEMBERS
      • MINDATE
      • RELATIVE
      • RELATIVE_COLUMN
      • ROW.PARENT
      • ROW.LABEL
    • Scripting functions
      • DISPLAYTOAST
      • EXPORT
      • LAYOUT
      • SETCFRULE
      • SETFILTER
      • SETFILTERBYINDEX
      • SETVISIBILITY
      • SHOWBETWEENPERIOD
      • SHOWCLOSEDFORECAST
      • TOPN
      • DISPLAY SETTINGS
        • SETBLANKLABEL
        • SETSUPPRESSZEROS
        • SETRAGGEDHIERARCHY
        • SEPARATOR
        • SETCOMBINECOLUMNHEADER
        • SEMANTICFORMAT
        • SHOWNULLAS
        • SHOWZEROAS
        • SINGLECHILD
    • Statistical Functions
      • RANK
      • RANKEQ
      • RANKAVG
    • Miscellaneous functions
      • FETCH
      • LOOKUP
    • Measure/Column selection functions
      • GETCOLBETWEENPERIODS
      • GETMEASURE
  • Advanced topics
    • Audit log
    • Backup & restore report config
    • Enterprise themes
    • PowerPoint integration
    • Drill down and roll up in performance mode
  • Accessibility shortcut keys
Powered by GitBook
On this page
  • 1. Number scaling
  • 1.1. Measure level scaling
  • 1.2. Uniform scaling
  • 1.3 Auto scaling
  • 1.4. Native scaling
  • 2. Percentage, prefix/suffix, and decimals
  • 2.1. Percentage
  • 2.2. Prefix/suffix
  • 4.3 Decimals
  • 3. Semantic formatting
  1. Working with Premium Table
  2. 2. Displaying information
  3. Basic formatting

Number formatting

PreviousBasic formattingNextCell, header & value formatting

Last updated 2 days ago

Premium Table for Power BI comes pre-equipped with intelligent number formatting and automatic scaling detection, ensuring your data is presented clearly and intuitively in tabular reports.

1. Number scaling

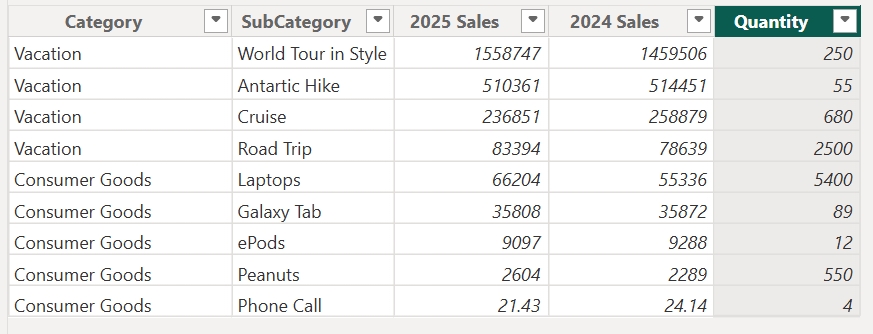
Let's take a sample dataset. You can immediately spot data of mixed granularity – with values in millions, thousands, and even just a few dollars worth.

Let's see how we can handle a dataset of varying granularities & formats using Inforiver Table.

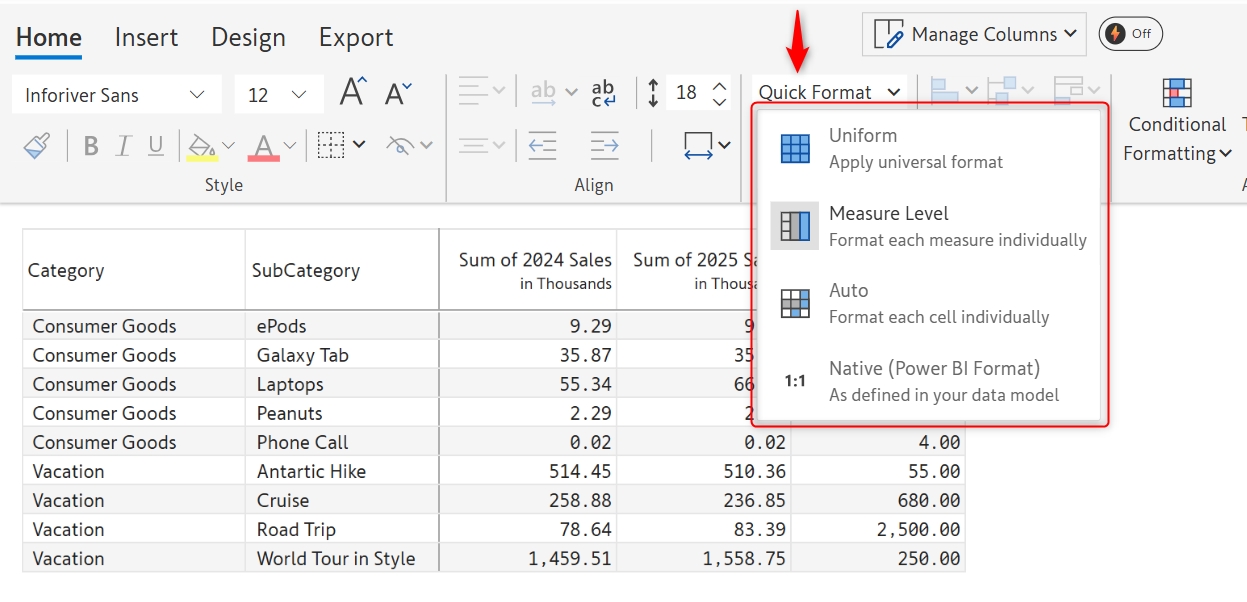
In the Home tab, click on the Quick format dropdown. There are several options; we'll explore each of them in detail.

1.1. Measure level scaling

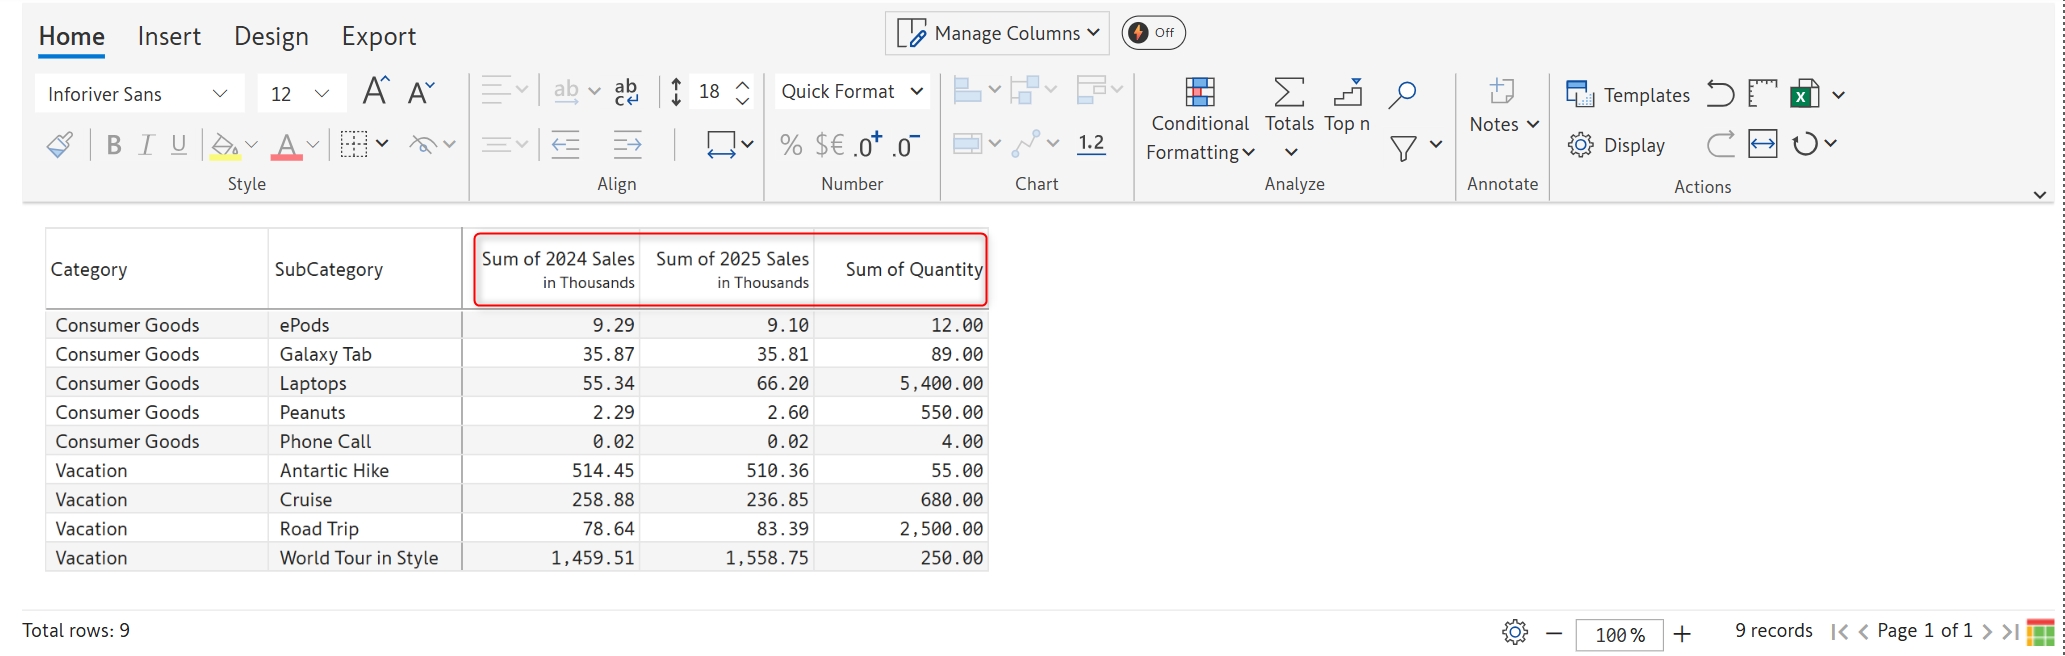
By default, when you assign this dataset to Premium Table, each measure is formatted using an individual scale. The scaling for each measure is shown in the column header. This is useful to show measures of varying granularities (e.g., Revenue & Quantity) in the same table.

1.2. Uniform scaling

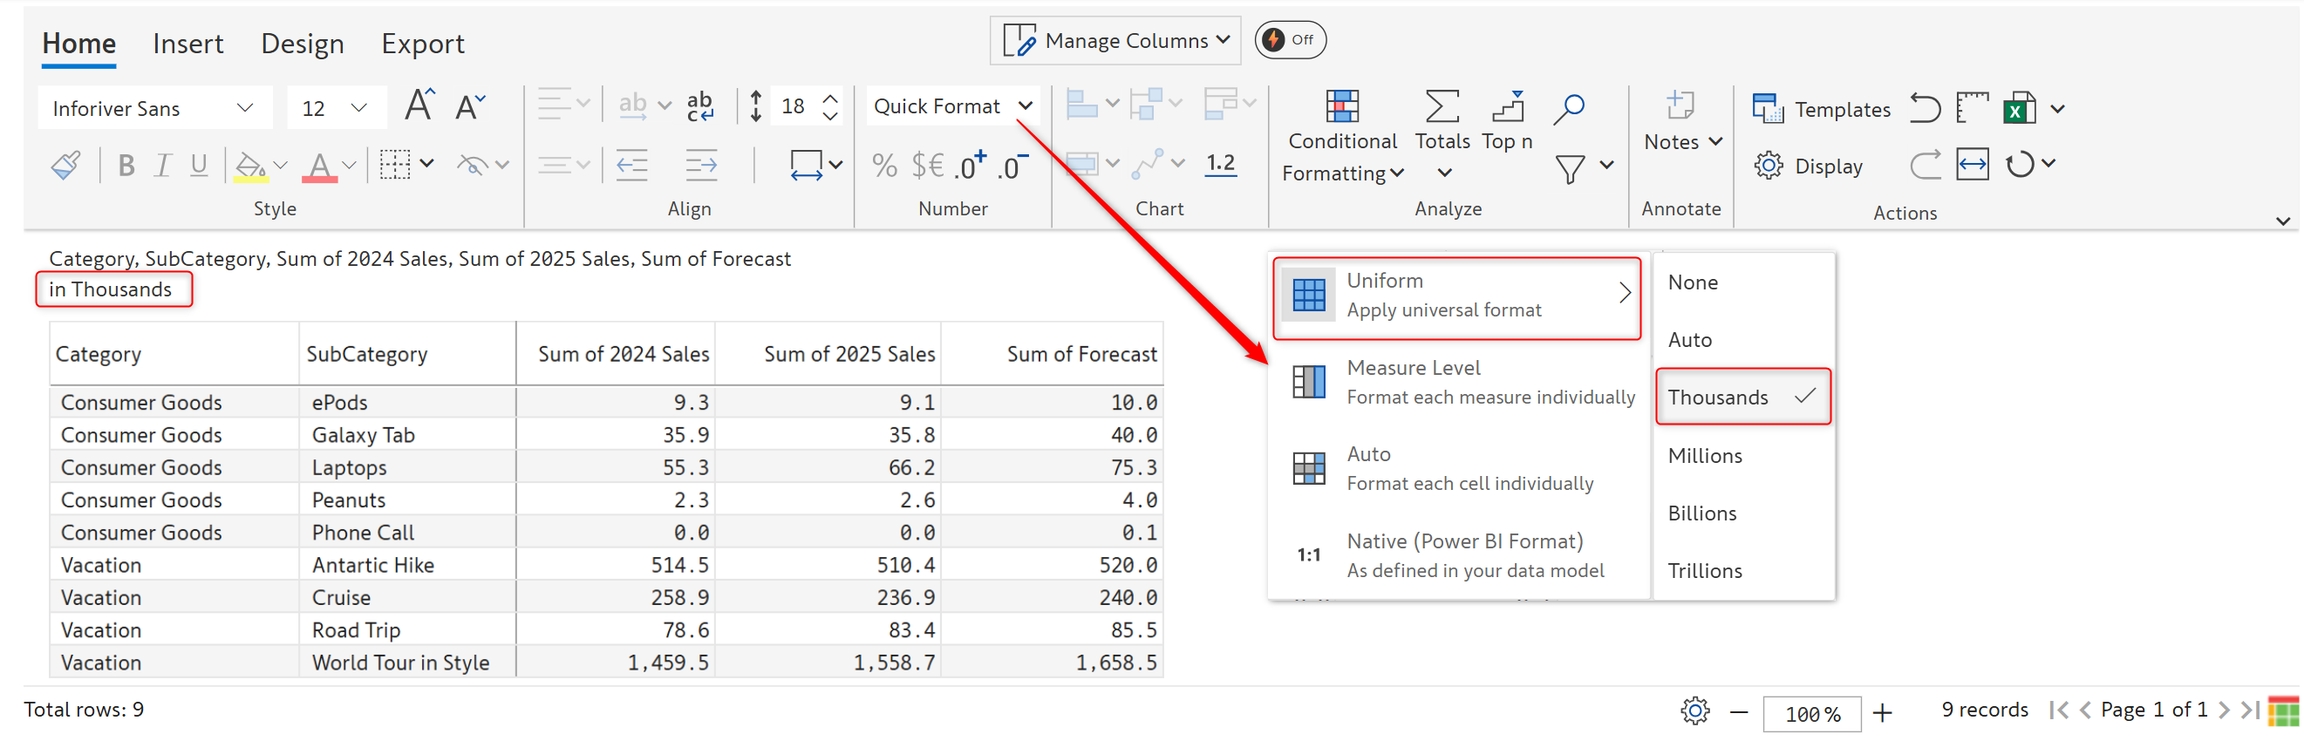
The 'Uniform' option applies a single fixed scale to the entire table and moves the scaling unit display to the header. This is useful when all the measures are of comparable magnitude (e.g., Sales vs Forecast) in the same table.

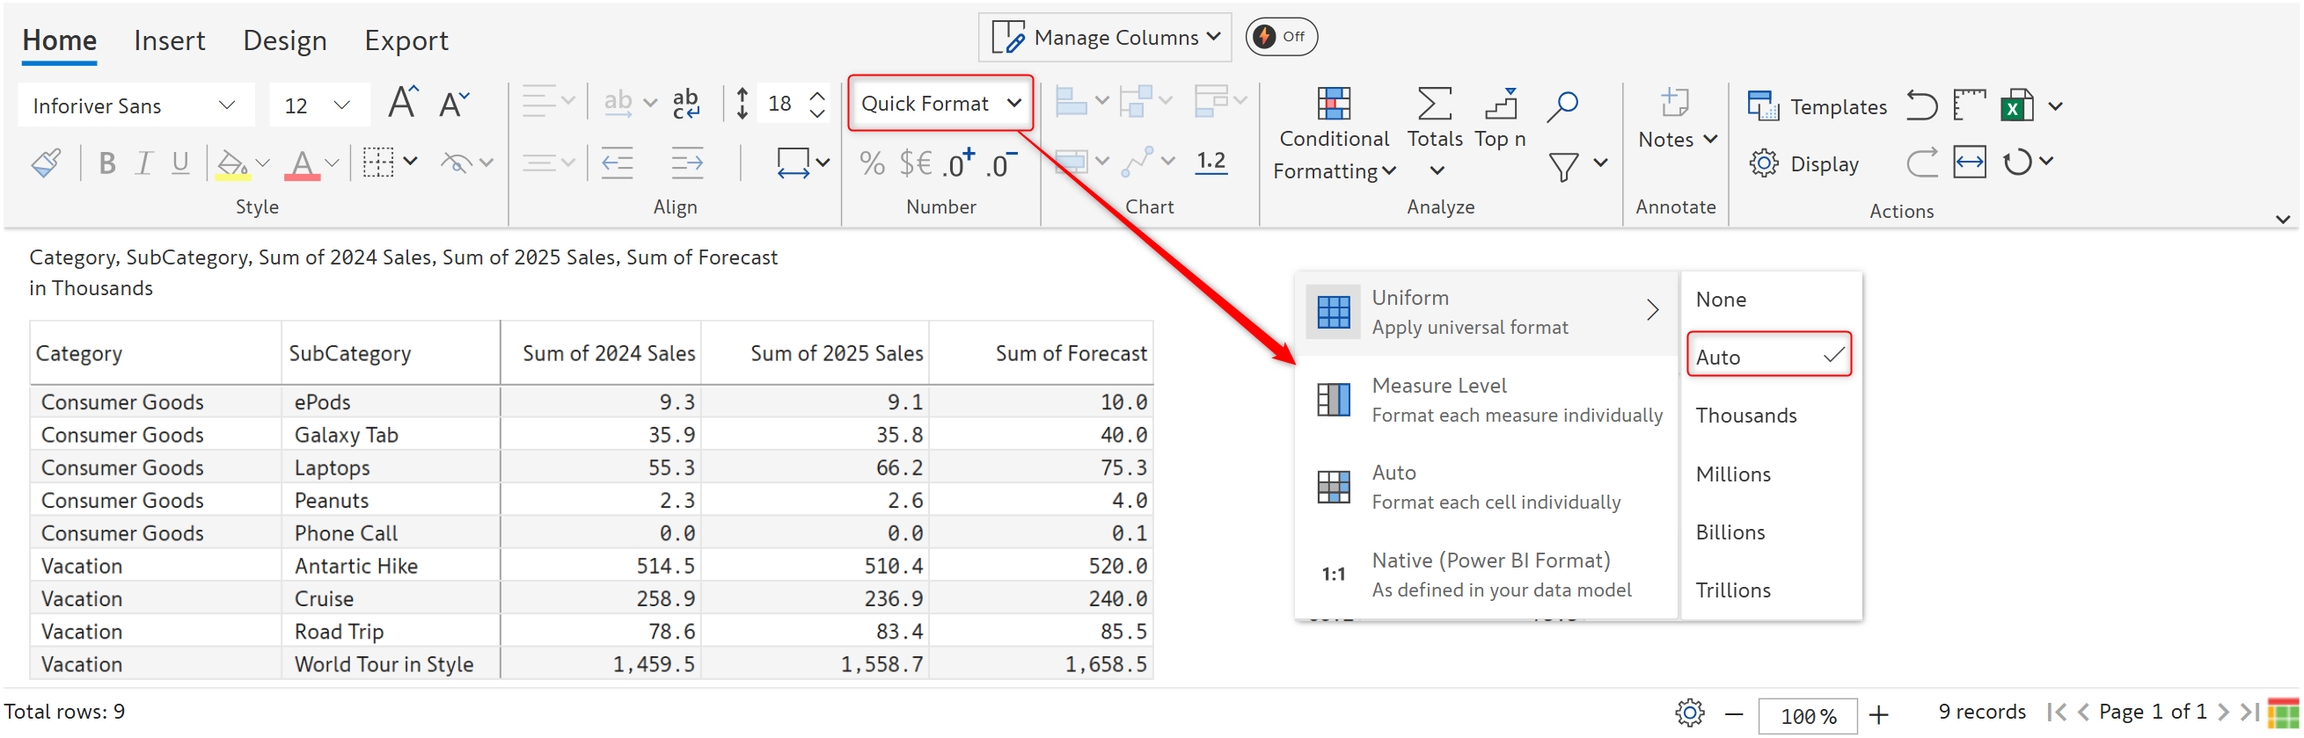
Premium Table automatically chooses the scaling based on the values. But you can change it if needed. When you expand the dropdown again, you can see more options. You can select millions, billions, etc., as needed.

1.3 Auto scaling

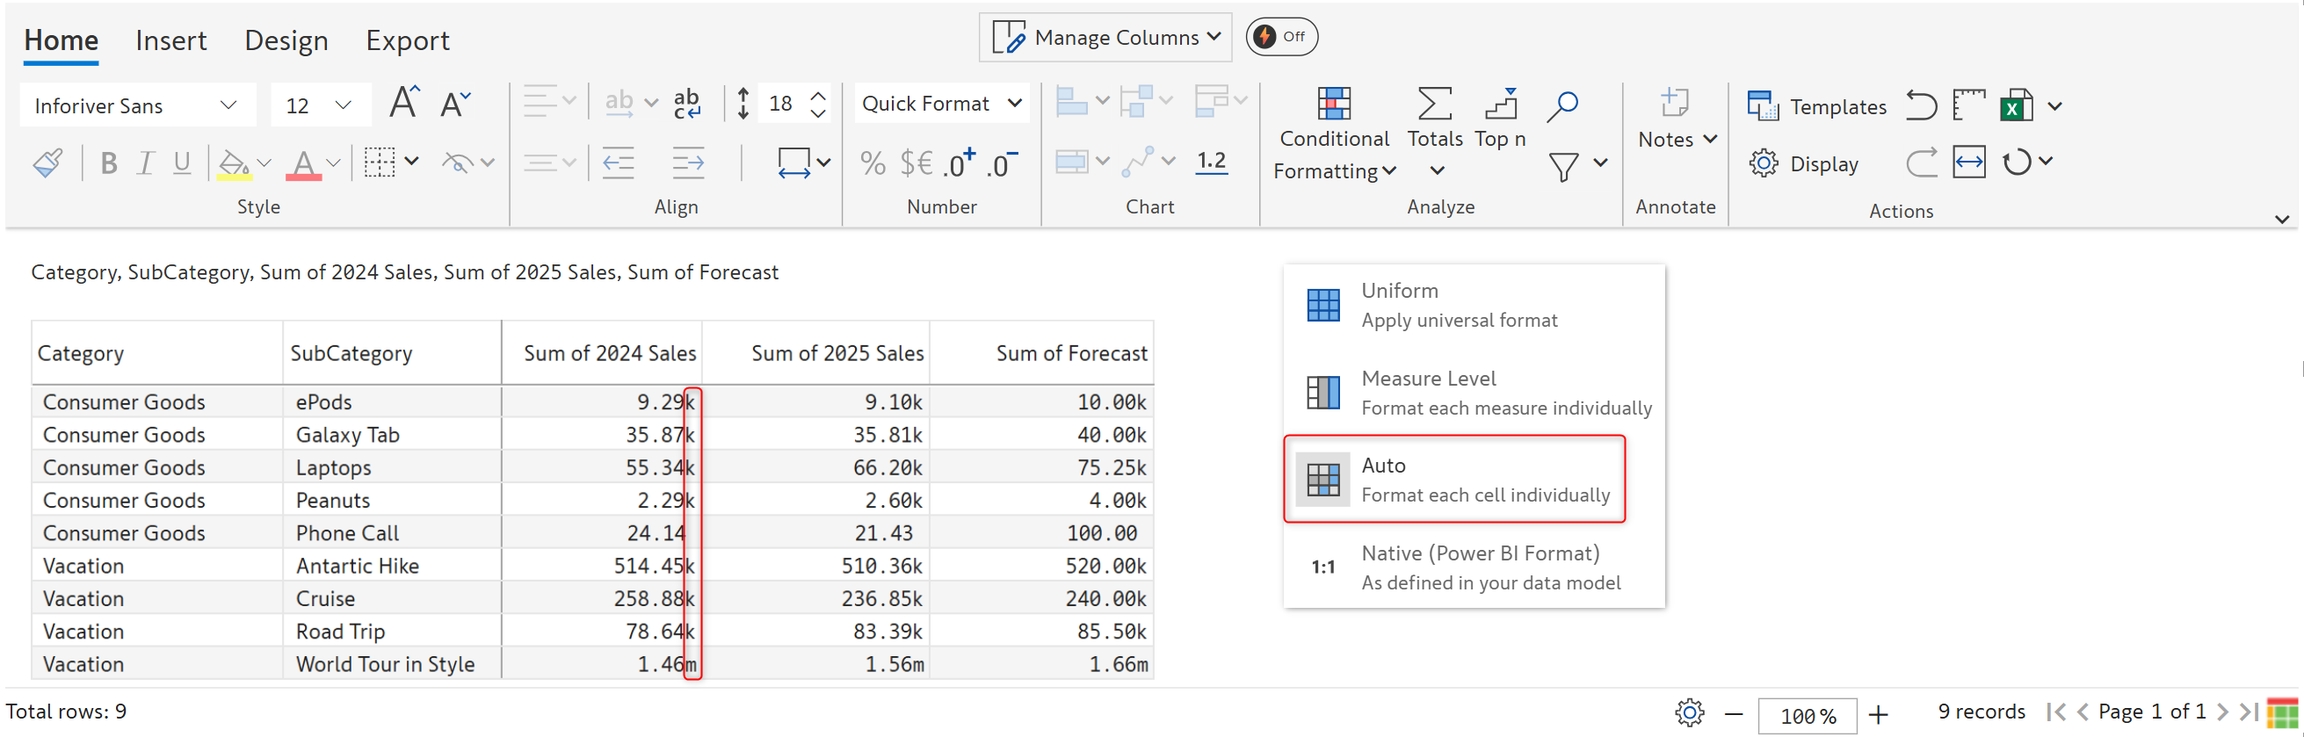
When using the 'Auto' option, each cell is formatted individually. In the image below, you can see the suffixes - m and k to denote millions and thousands.

1.4. Native scaling

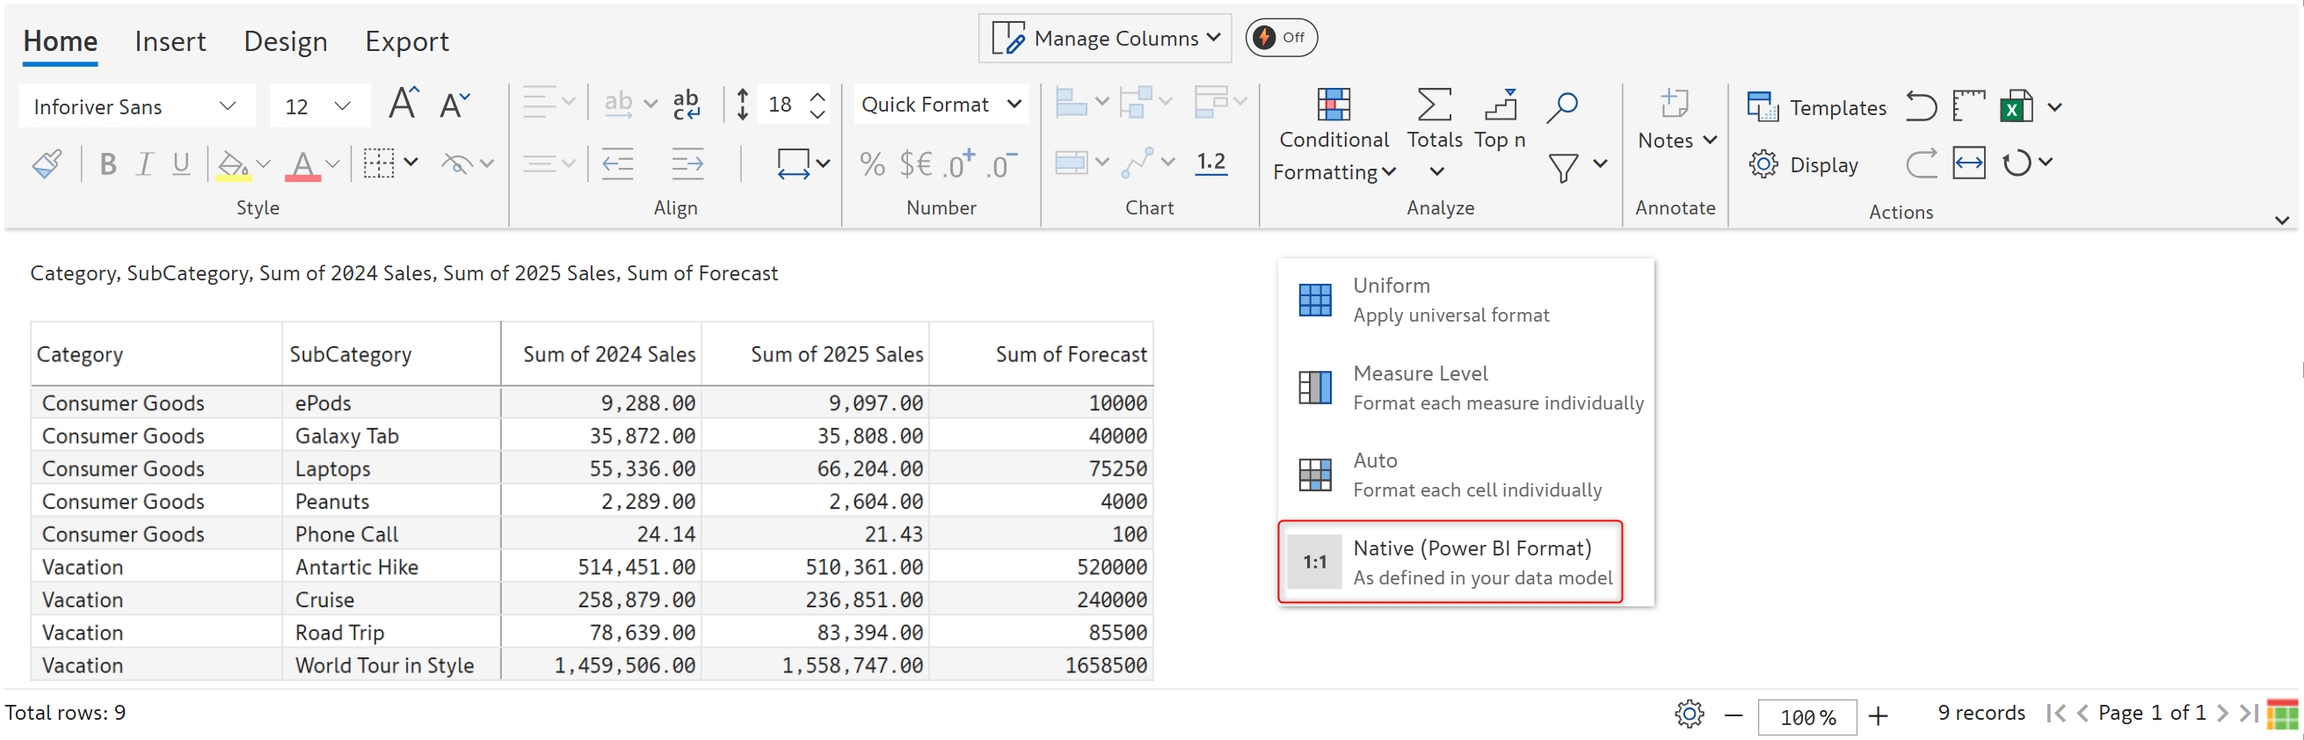
If you do not want any fancy formatting and need the numbers just as they are in the source data, select the ‘Native’ option.

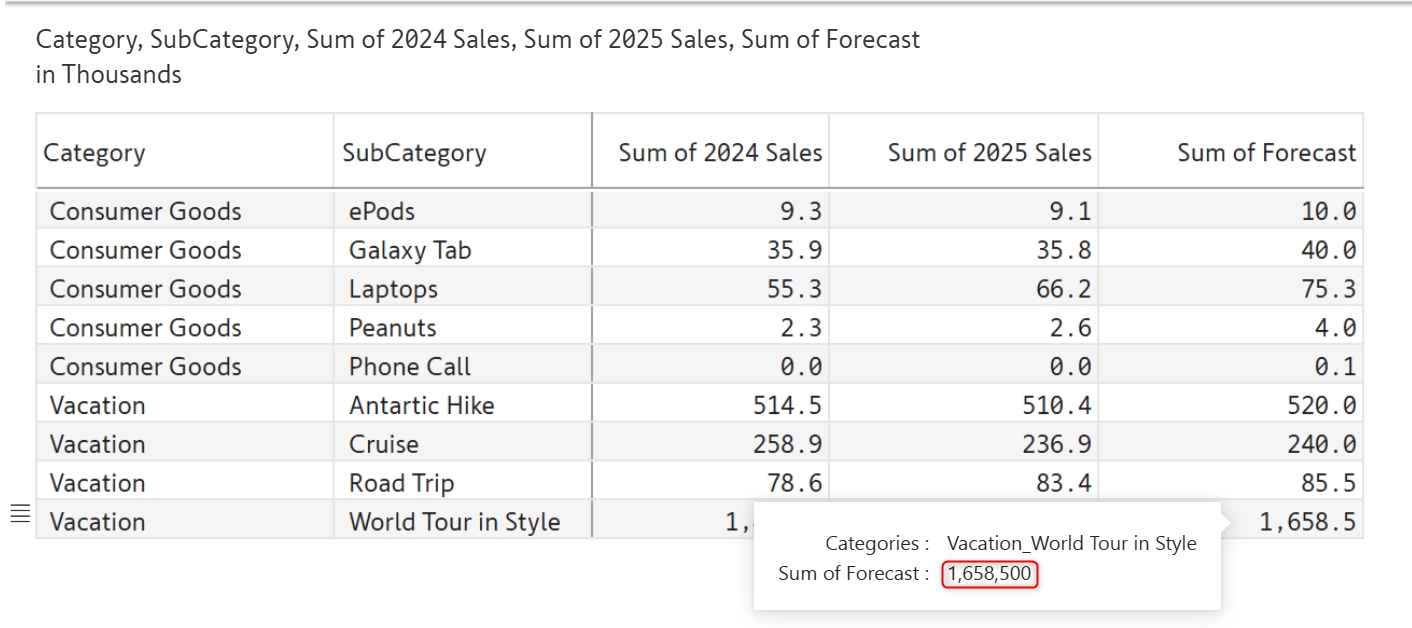
Premium Table also shows the unscaled values in the tooltip (available upon publishing to service). This helps you scale values without losing the ability to look up the unscaled value whenever required.

2. Percentage, prefix/suffix, and decimals

Inforiver provides options to fine-tune the format at a row, column/measure, or cell level using the icons just below the 'Quick format' dropdown. These options include conversion to % format, attaching a prefix/suffix, and increasing/decreasing decimal spaces.

2.1. Percentage

The YoY Sales measure is actually YoY Sales% and needs to be converted to a percentage.

To do this, let's select the column. Notice how the % icon gets enabled. Once you click on the icon, the values get converted to percentages.

2.2. Prefix/suffix

With Premium Table, you can insert prefixes such as currency or suffixes like units.

In the example, the price is $ per unit. Select the column and click on the highlighted icon. Enter the prefix and suffix as shown.

Click Apply to add a prefix and suffix.

4.3 Decimals

You can increase or decrease decimal places at a cell/row/column level.

3. Semantic formatting

Premium Table brings a range of options to customize numbers.

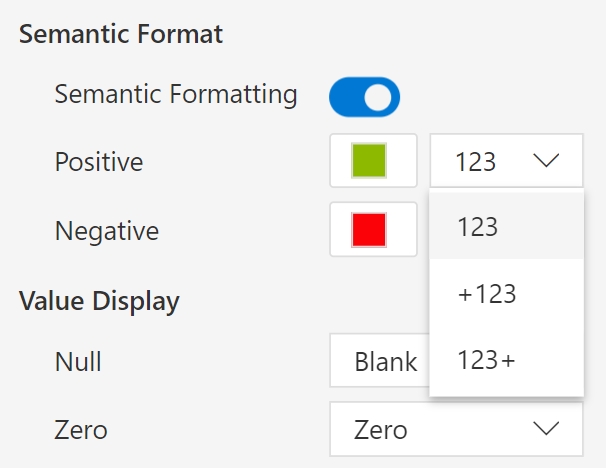
Click Display Settings in the Home Ribbon. In the Numbers tab, you'll find options like Semantic formatting, Value display, Sign, and more. In this section, we'll talk about semantic formatting.

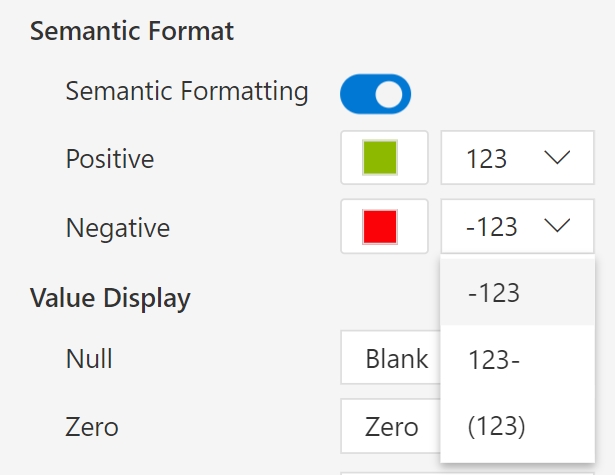
You can see the positive and negative options on enabling the toggle, as shown below. By default, they are shown in green and red, but they can be customized using the color picker.

You can also display positive and negative numbers in the formats shown below.

Resources

Let's remove the decimals for the Sales and Price columns. Use Shift+Select to select the two columns and click the icon twice. The decimals are removed. The option can be used similarly to increase decimal places.

In the next section, we'll be covering .

Cell & value formatting
Intelligent number formatting & scaling in Power BI
Sample dataset with mixed granularities
Measure level scaling
Uniform scaling in thousands
Uniform - Auto scaling
Auto scaling
Native scaling
Unscaled tooltip in reading view
YoY Sales before converting to percentage
YoY Sales after converting to percentage
Adding a prefix and suffix
Prefix and suffix added
Select measures and click the decrease decimal icon
Decimal places removed
Semantic formatting enabled
Positive numbers formatting
Negative numbers formatting