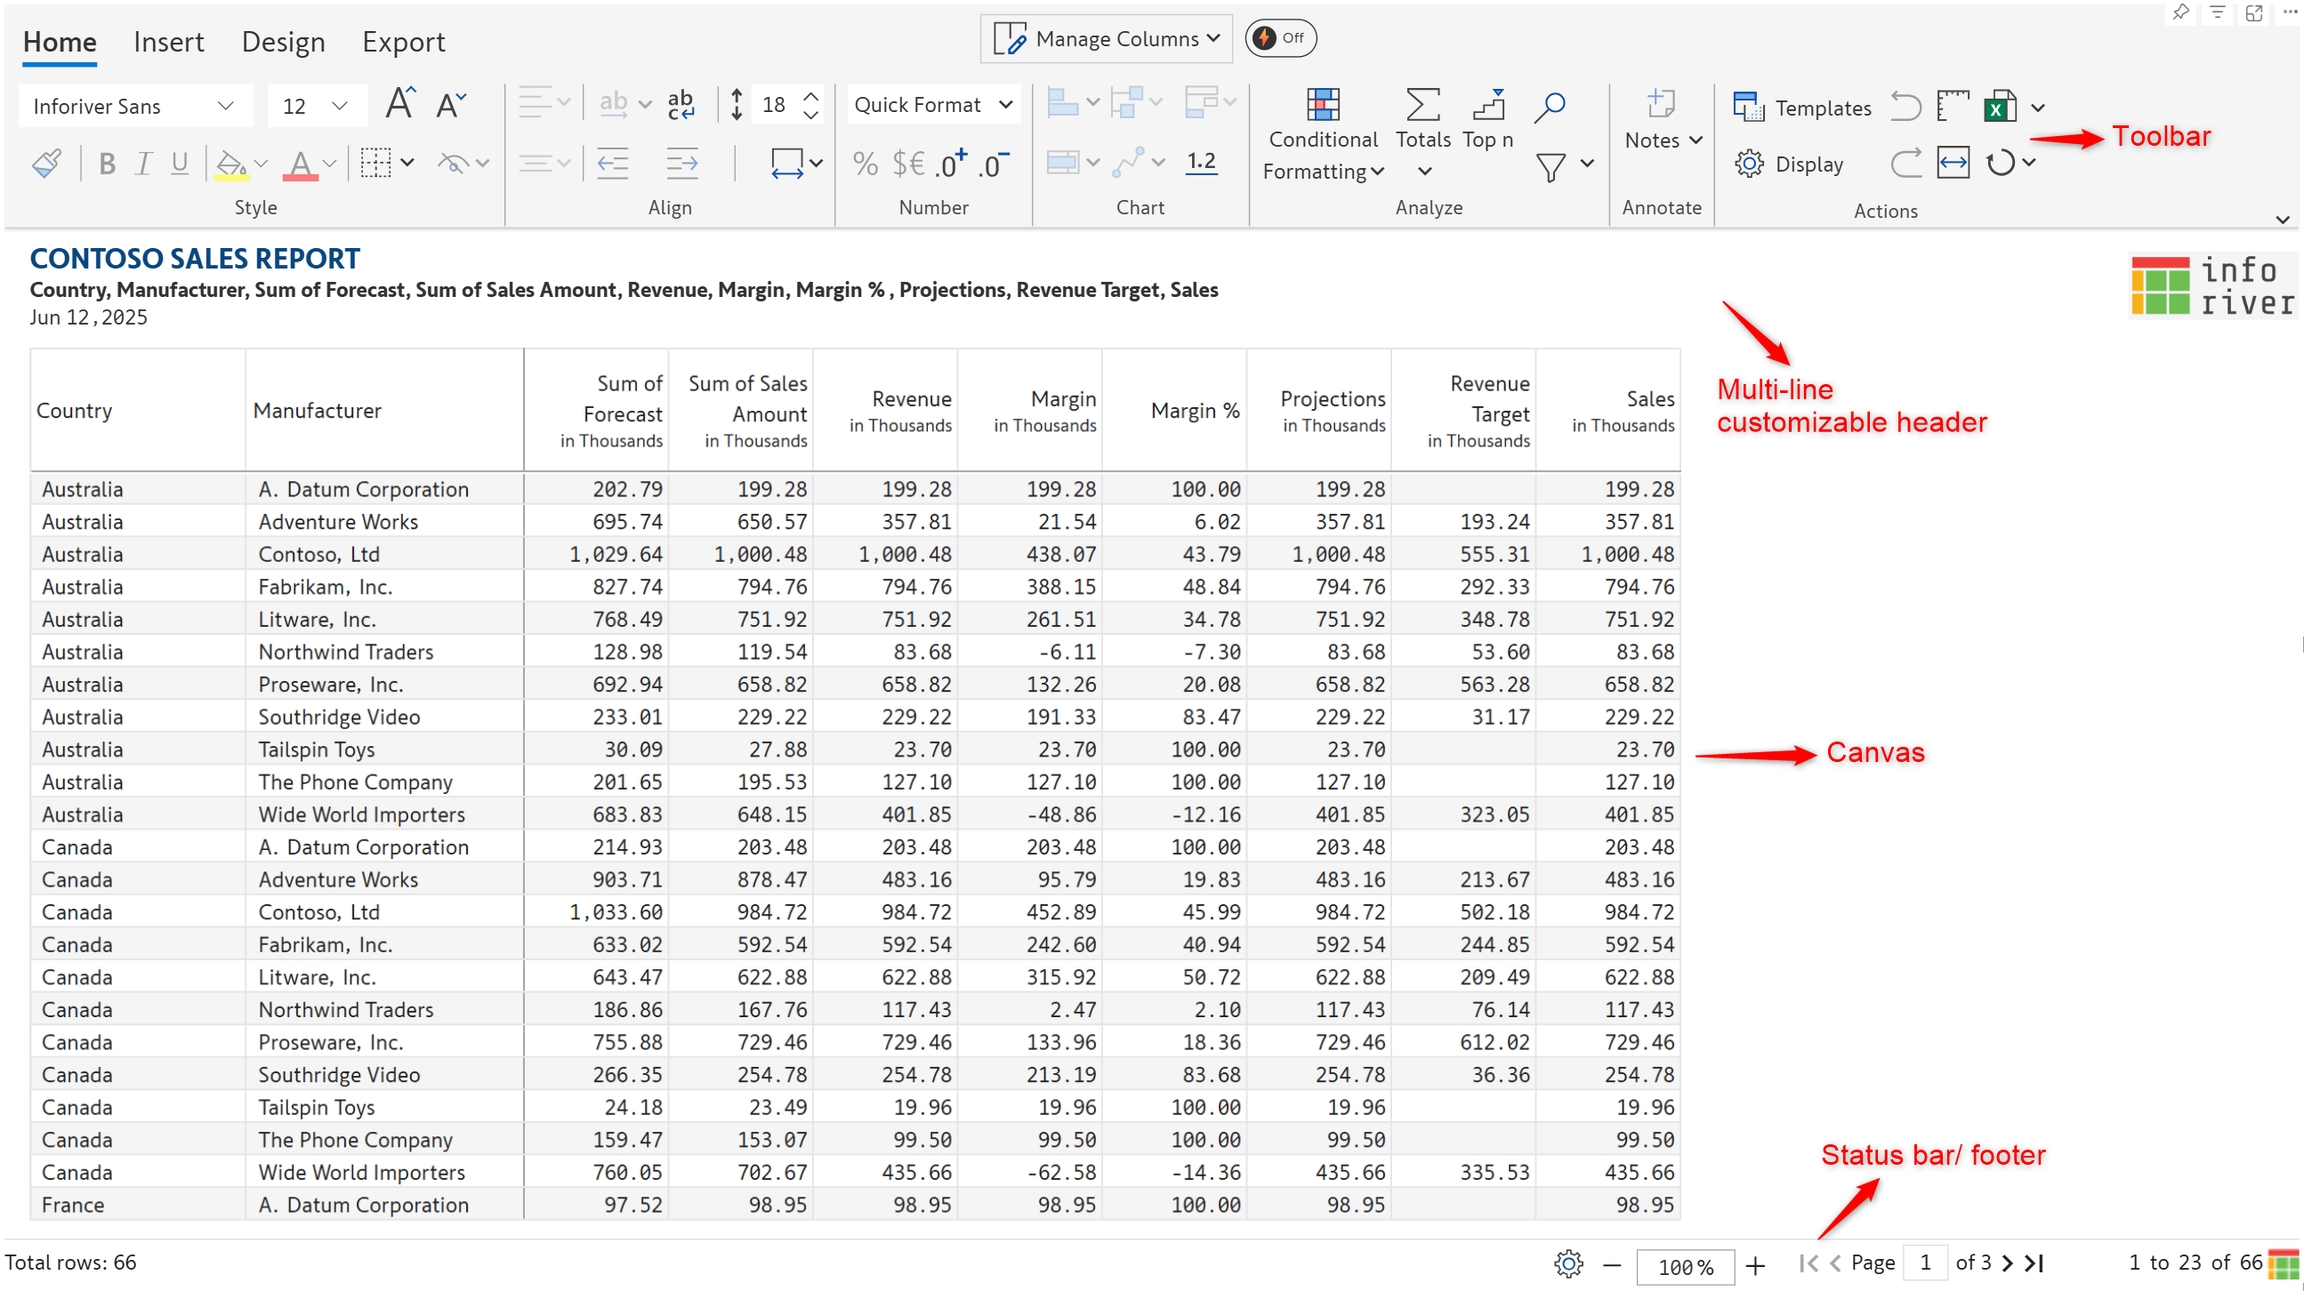
The Inforiver Table report interface contains the following sections:
Toolbar: The multi-tab toolbar has several action items that can be used to configure the report.
Report header: Use the multi-line, formattable report header to provide additional information on the report.
Report canvas: This section contains the body of the report, where information is displayed in tabular form
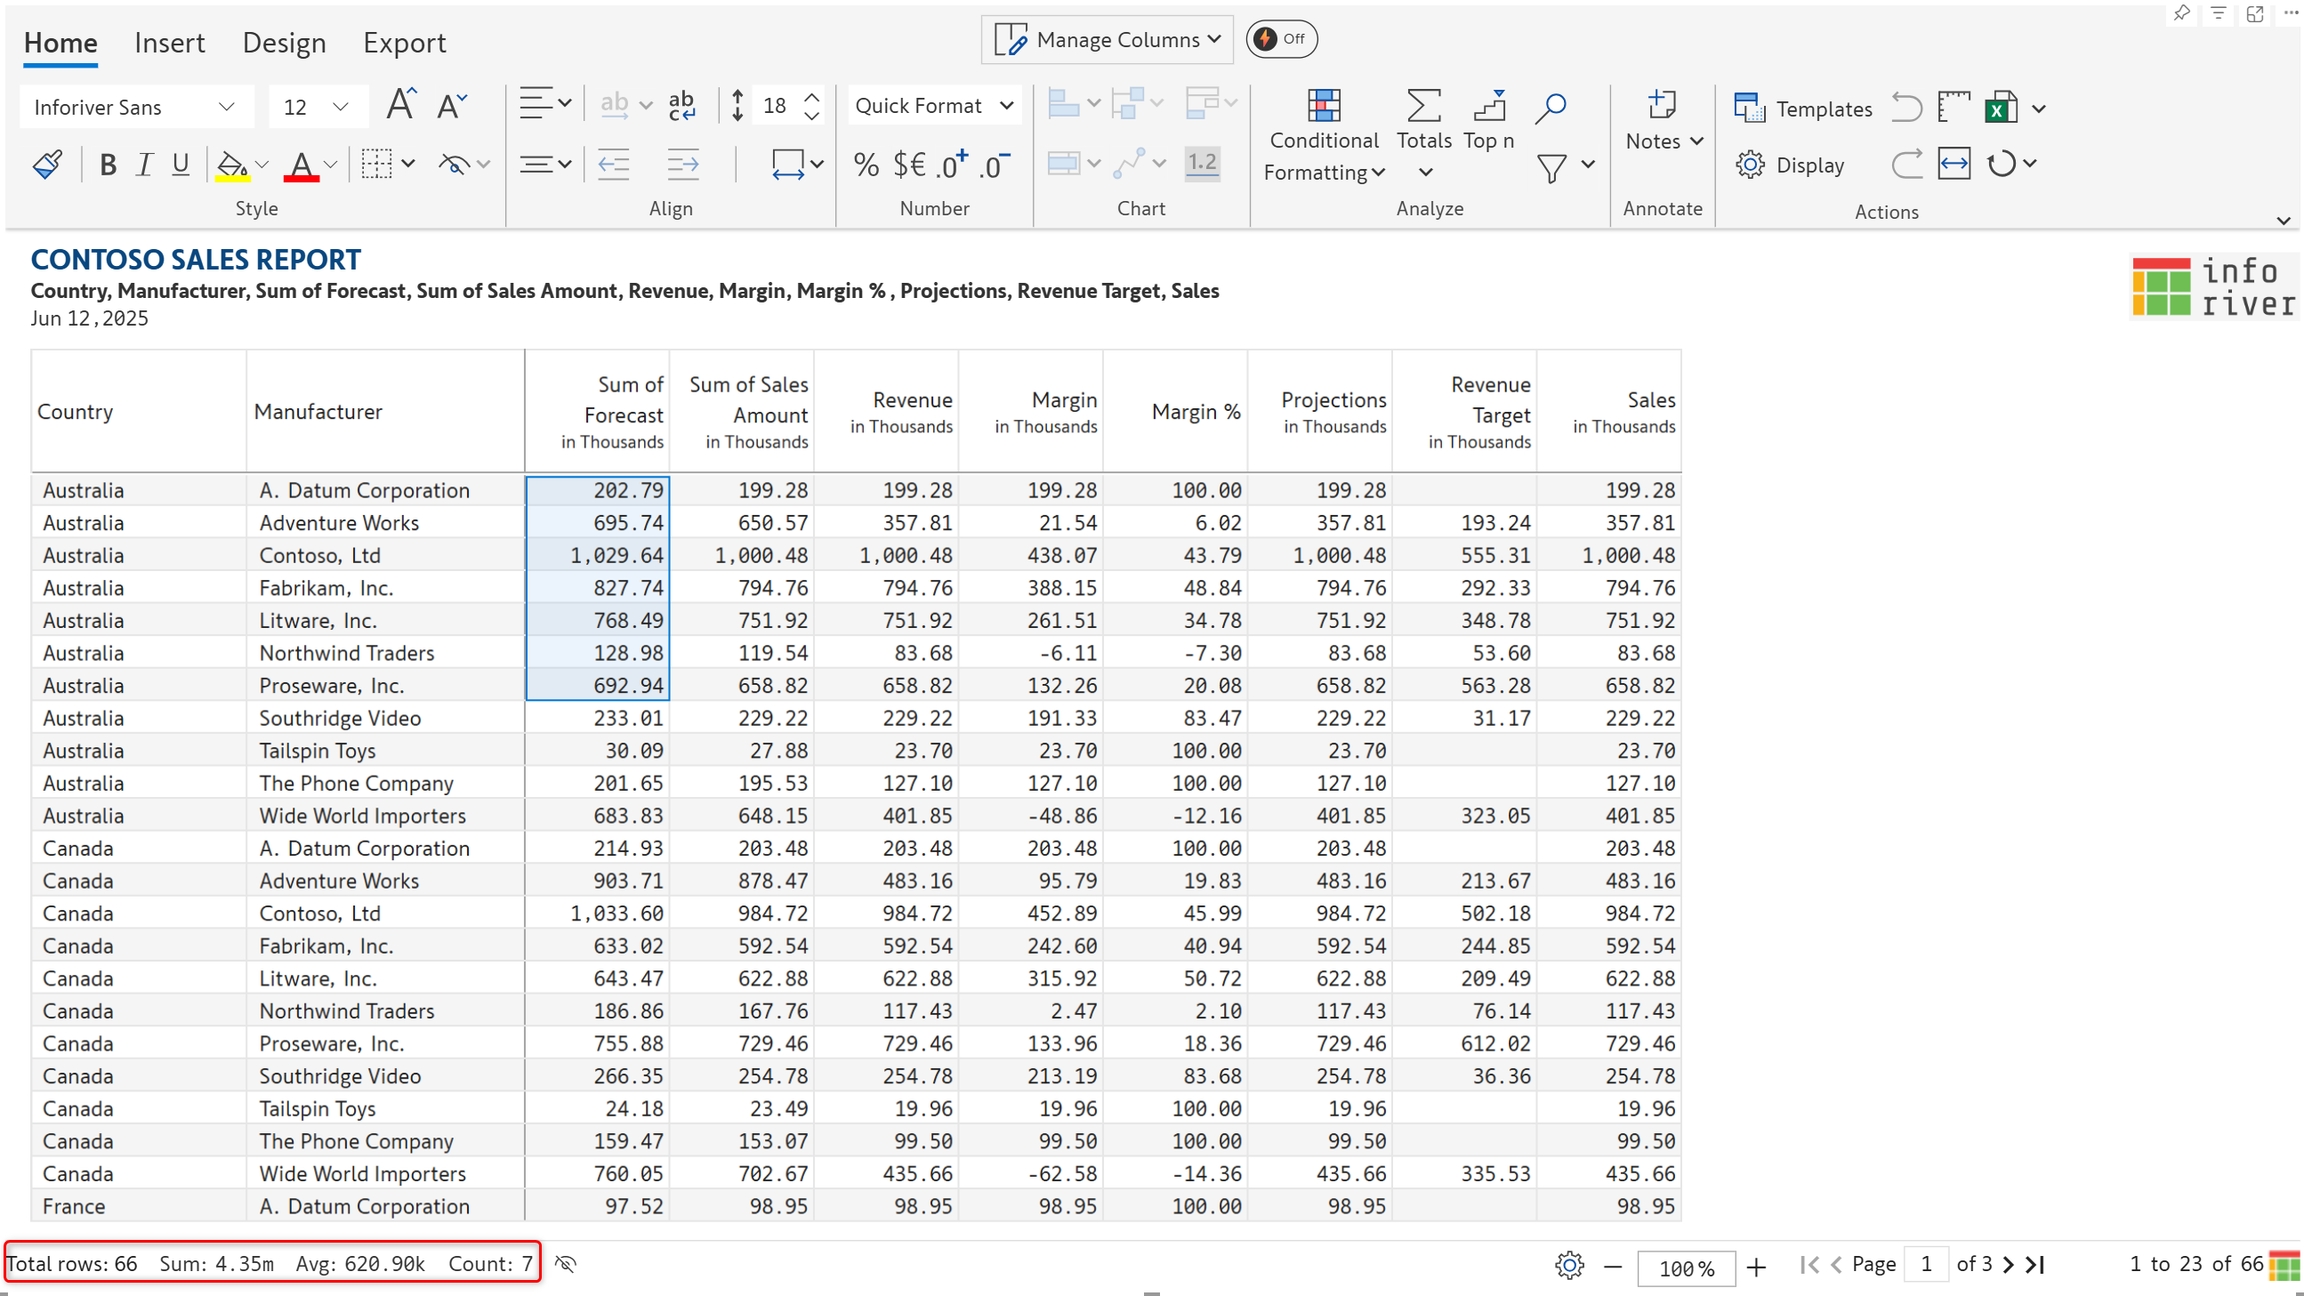
Status bar: The status bar contains information such as the following
Aggregation information: Displays the number of rows. When a measure is selected, this section can also show metrics such as sum, average, and count.
Zoom/Unzoom controls: You can use the controls provided in the footer or use the keyboard shortcuts (Ctrl + / Ctrl -)
Pagination controls: You can use first-previous-next-last navigation controls, and also set the number of rows per page.