Inforiver
Premium Table
Premium Table
  • Introduction to Premium Table
    • Get Started
      • Installing from AppSource
      • Installing Inforiver for your organization (Org visual)
      • Inforiver Writeback Matrix pre-requisites
        • Whitelist Inforiver IPs
        • Admin consent for Inforiver's Entra ID
          • Basic consent
          • Full admin consent
      • Inforiver Customer Portal
        • Billing Admin
          • Update Profile
          • Update Subscriptions
        • License Admin
      • Licensing
        • License renewal
      • Registering Inforiver on Azure AD (Entra ID)
  • Working with Premium Table
    • 1. Build your first Inforiver Table report
    • 2. Displaying information
      • Report interface
      • Templates
      • Basic formatting
        • Number formatting
        • Cell, header & value formatting
        • Totals & subtotals
        • Insert blank rows
      • Basic inline charts
    • 3. Basic interactions
      • Explore & filter data
        • Search & Filter
        • Explorer
        • Top N + others
      • Sort & reorder data
      • Show/hide values
      • Manage column widths
      • Manage hierarchies
      • Create visual hierarchies
      • Pin rows & columns
      • Blend measures
      • Dynamic measure headers
      • Context menus
        • Column gripper
        • Row gripper
      • Actions
        • Rails
        • Toolbar options
        • Keyboard shortcuts
        • Reset
    • 4. Adding business logic and formulae
      • Insert calculated rows
        • Template rows
      • Insert calculated columns
      • Insert manual input rows
      • Insert manual input columns
        • Number
        • Dropdown
          • Dropdown options from semantic models
          • Lookup visuals for dropdowns
        • Text, checkbox & date
        • Writeback Matrix features
        • Importing data
      • Invert sign
      • Editing cells
      • Quick formula
      • Visual column inside visual measures
      • Manage inserted rows
      • Manage inserted measures & columns
      • Pivot data
      • Insert image URLs
    • 6. Working with charts
      • Sparkline charts
      • Stacked charts
      • Bullet charts and clustered bar charts
      • Waterfall charts
      • Bar and pin charts
      • Change/deviation charts
    • 5. Conditional formatting
      • One-click options
      • Create rule
        • Rules (If conditions)
        • Color scale & data bars
        • Classification
        • Ranking
      • Manage rules
    • 7. Planning, budgeting & forecasting
      • What-if analysis & simulations
      • Goal Seek
      • Budgeting & allocations
      • Set version
    • 8. Paginated reporting
      • Pagination
      • Header & footer
        • Text
        • Images
        • Charts
        • KPI cards
      • Report layouts (Report+)
      • Display and themes
    • 10. Exporting reports
      • Export to PDF & Excel
        • Excel export - operational boundaries
      • Ad hoc emails
    • 11. Scheduling reports
      • Create new subscription
        • Select a report
        • Set subscription frequency
        • Select destination(s)
          • Email
          • OneDrive
          • Microsoft Teams
          • SharePoint
        • Review & save subscription
      • Manage your subscriptions
      • Administration
    • 12. Data writeback
      • Settings
        • General Settings
        • Data Settings
        • Destination Settings
        • Writeback security settings
        • Writeback time-out & batch size settings
        • Advanced Settings
      • Destinations
        • Azure SQL (Managed DB)
        • Azure SQL
        • Microsoft SQL Server
        • Synapse Dedicated SQL Pool
        • Azure Data Lake Storage
        • Databricks
        • Snowflake
          • Setting up Snowflake OAuth
        • Amazon Redshift
        • BigQuery
        • SingleStore
        • SAP HANA
        • Oracle
        • PostgreSQL
        • MySQL
        • OneDrive
        • SharePoint
        • Dataverse
        • Fabric Warehouse
        • Fabric lakehouse
        • Fabric SQL
        • URL as destination
      • Logs
      • Reading mode
    • 14. Manage aggregation
      • Row aggregation
      • Column aggregation
    • 18. Variables
      • Variable types
        • Number
        • Select
        • Text
        • Date
        • Date range
        • Boolean
        • Button
      • Variable bookmarks
  • Admin Console
    • Manage Profile
    • User management
      • User Roles and Permissions
      • Create custom roles and policies
    • Settings
      • General
      • Generate builds - on prem
      • Forecast
      • Holidays
      • API token
      • Writeback
      • Managed DB
      • Assets
    • Onboarding actions
    • Writeback
  • Display settings
    • General settings
    • Hierarchy settings
    • Number settings
    • Miscellaneous settings
    • On-load scripting
  • Formula syntax
    • Conditional statements
      • IF
      • IFNA
      • SWITCH
      • FILTERIF
    • Logical functions
      • AND
      • IN
      • ISBLANK
      • ISEMPTY
      • ISNUMBER
      • NOT
      • OR
      • XOR
    • Math functions
      • ABS
      • AVERAGE
      • AVERAGEEXNEG
      • AVERAGEEXZERO
      • AVERAGEEXZERONEG
      • AVERAGEIF
      • CEILING
      • COUNT
      • COUNTIF
      • DIVIDE
      • EVEN
      • EXP
      • FLOOR
      • INDEXOF
      • LOG
      • ODD
      • MAX
      • MIN
      • NORMDIST
      • NORMSDIST
      • NORMINV
      • NORMSINV
      • PCT
      • POWER
      • RAND
      • RANDBETWEEN
      • ROUND
      • ROUNDDOWN
      • ROUNDUP
      • MROUND
      • SORT
      • SQRT
      • SUM
      • PMT
    • Text formatting functions
      • CONCATENATE
      • HYPERLINK
      • LEFT
      • LOWER
      • MID
      • PROPER
      • REPLACE
      • REPT
      • RIGHT
      • TEXT
      • TRIM
      • UPPER
      • VALUE
    • Date functions
      • DATEADD
      • DATEDIFF
      • DAY
      • DATE
      • DATE.SET
      • DATE.FORMAT
      • SOWEEK
      • SOMONTH
      • SOQTR
      • SOYEAR
      • EOWEEK
      • EOMONTH
      • EOQTR
      • EOYEAR
      • NETWORKDAYS
      • ADDDAYS
      • ADDWEEKS
      • ADDMONTHS
      • ADDQTRS
      • ADDYEARS
      • FROMEXCELDATE
      • MONTH
      • NOW
      • PERIOD_RANGE
      • TODAY
      • TOEXCELDATE
      • YEAR
    • Time intelligence functions
      • AGGREGATE
      • FILTER
      • COLUMN_PERIOD
      • LASTNDAY
      • LASTNMONTH
      • LASTNQTR
      • LASTNYEAR
      • MONTHPERIOD
      • MOVINGAVERAGE
      • MOVINGSUM
      • MTD
      • NEXTNDAY
      • NEXTNMONTH
      • NEXTNQTR
      • NEXTNYEAR
      • QTD
      • QTRPERIOD
      • SHIFT
      • TOTALYTD
      • TOTALQTD
      • TOTALMTD
      • VALUEAT
      • YEARPERIOD
      • YTD
    • Other operators
    • Identifiers
      • CLOSEDPERIOD
      • COLUMN.DATE
      • COLUMN.PARENT
      • COLUMNS
      • CURRENT_PERIOD
      • DESCENDANTS
      • FORECAST.CLOSED_END
      • FORECAST.CLOSED_START
      • FORECAST.OPEN_END
      • FORECAST.OPEN_START
      • GROUP INDEX
      • HAS
      • HAS_ALL
      • HAS_SOME
      • LEAVES
      • LEVEL
      • LOGGEDIN_EMAIL
      • LOGGEDIN_NAME
      • MATCH
      • MAXDATE
      • MEMBERS
      • MINDATE
      • RELATIVE
      • RELATIVE_COLUMN
      • ROW.PARENT
      • ROW.LABEL
    • Scripting functions
      • DISPLAYTOAST
      • EXPORT
      • LAYOUT
      • SETCFRULE
      • SETFILTER
      • SETFILTERBYINDEX
      • SETVISIBILITY
      • SHOWBETWEENPERIOD
      • SHOWCLOSEDFORECAST
      • TOPN
      • DISPLAY SETTINGS
        • SETBLANKLABEL
        • SETSUPPRESSZEROS
        • SETRAGGEDHIERARCHY
        • SEPARATOR
        • SETCOMBINECOLUMNHEADER
        • SEMANTICFORMAT
        • SHOWNULLAS
        • SHOWZEROAS
        • SINGLECHILD
    • Statistical Functions
      • RANK
      • RANKEQ
      • RANKAVG
    • Miscellaneous functions
      • FETCH
      • LOOKUP
    • Measure/Column selection functions
      • GETCOLBETWEENPERIODS
      • GETMEASURE
  • Advanced topics
    • Audit log
    • Backup & restore report config
    • Enterprise themes
    • PowerPoint integration
    • Drill down and roll up in performance mode
  • Accessibility shortcut keys
Powered by GitBook
On this page
  • 1. From local system
  • 2. From the workspace
  1. Working with Premium Table
  2. 8. Paginated reporting
  3. Header & footer

Images

PreviousTextNextCharts

Images can be added to the header/footer either from your local files or from the assets in your organization's workspace. The second option is available only in Inforiver Writeback Matrix. Admins of the Inforiver Writeback Matrix workspace will be able to upload images using the which can be used by all the other users in the workspace.

Let's look at the steps to add images.

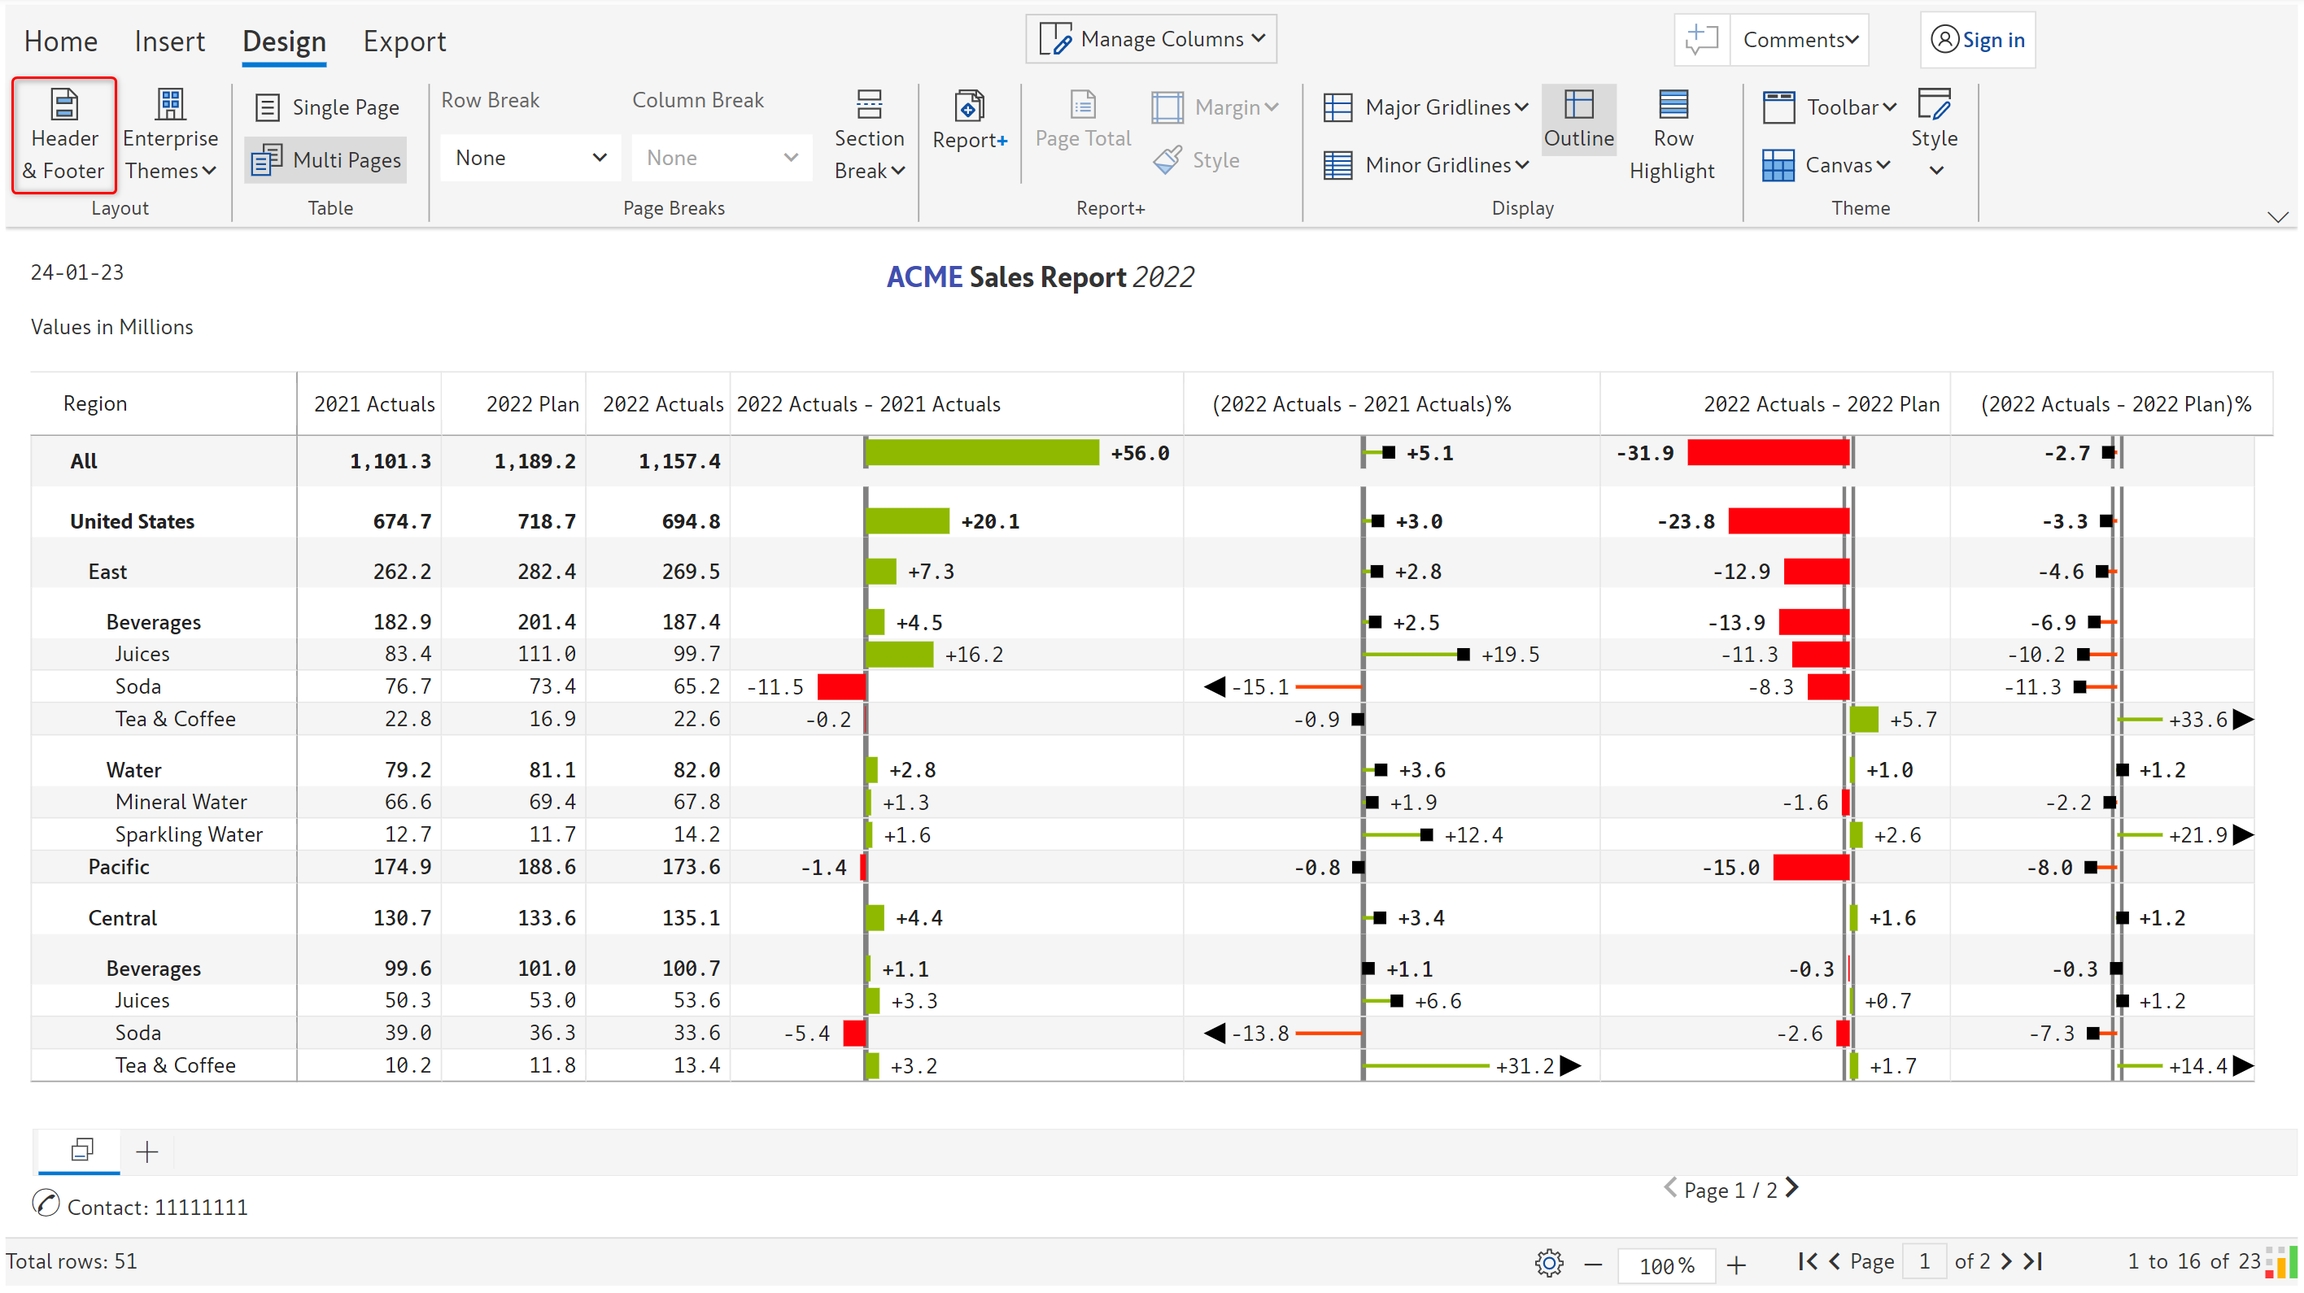
a) Click on 'Header & footer' in the 'Design' tab.

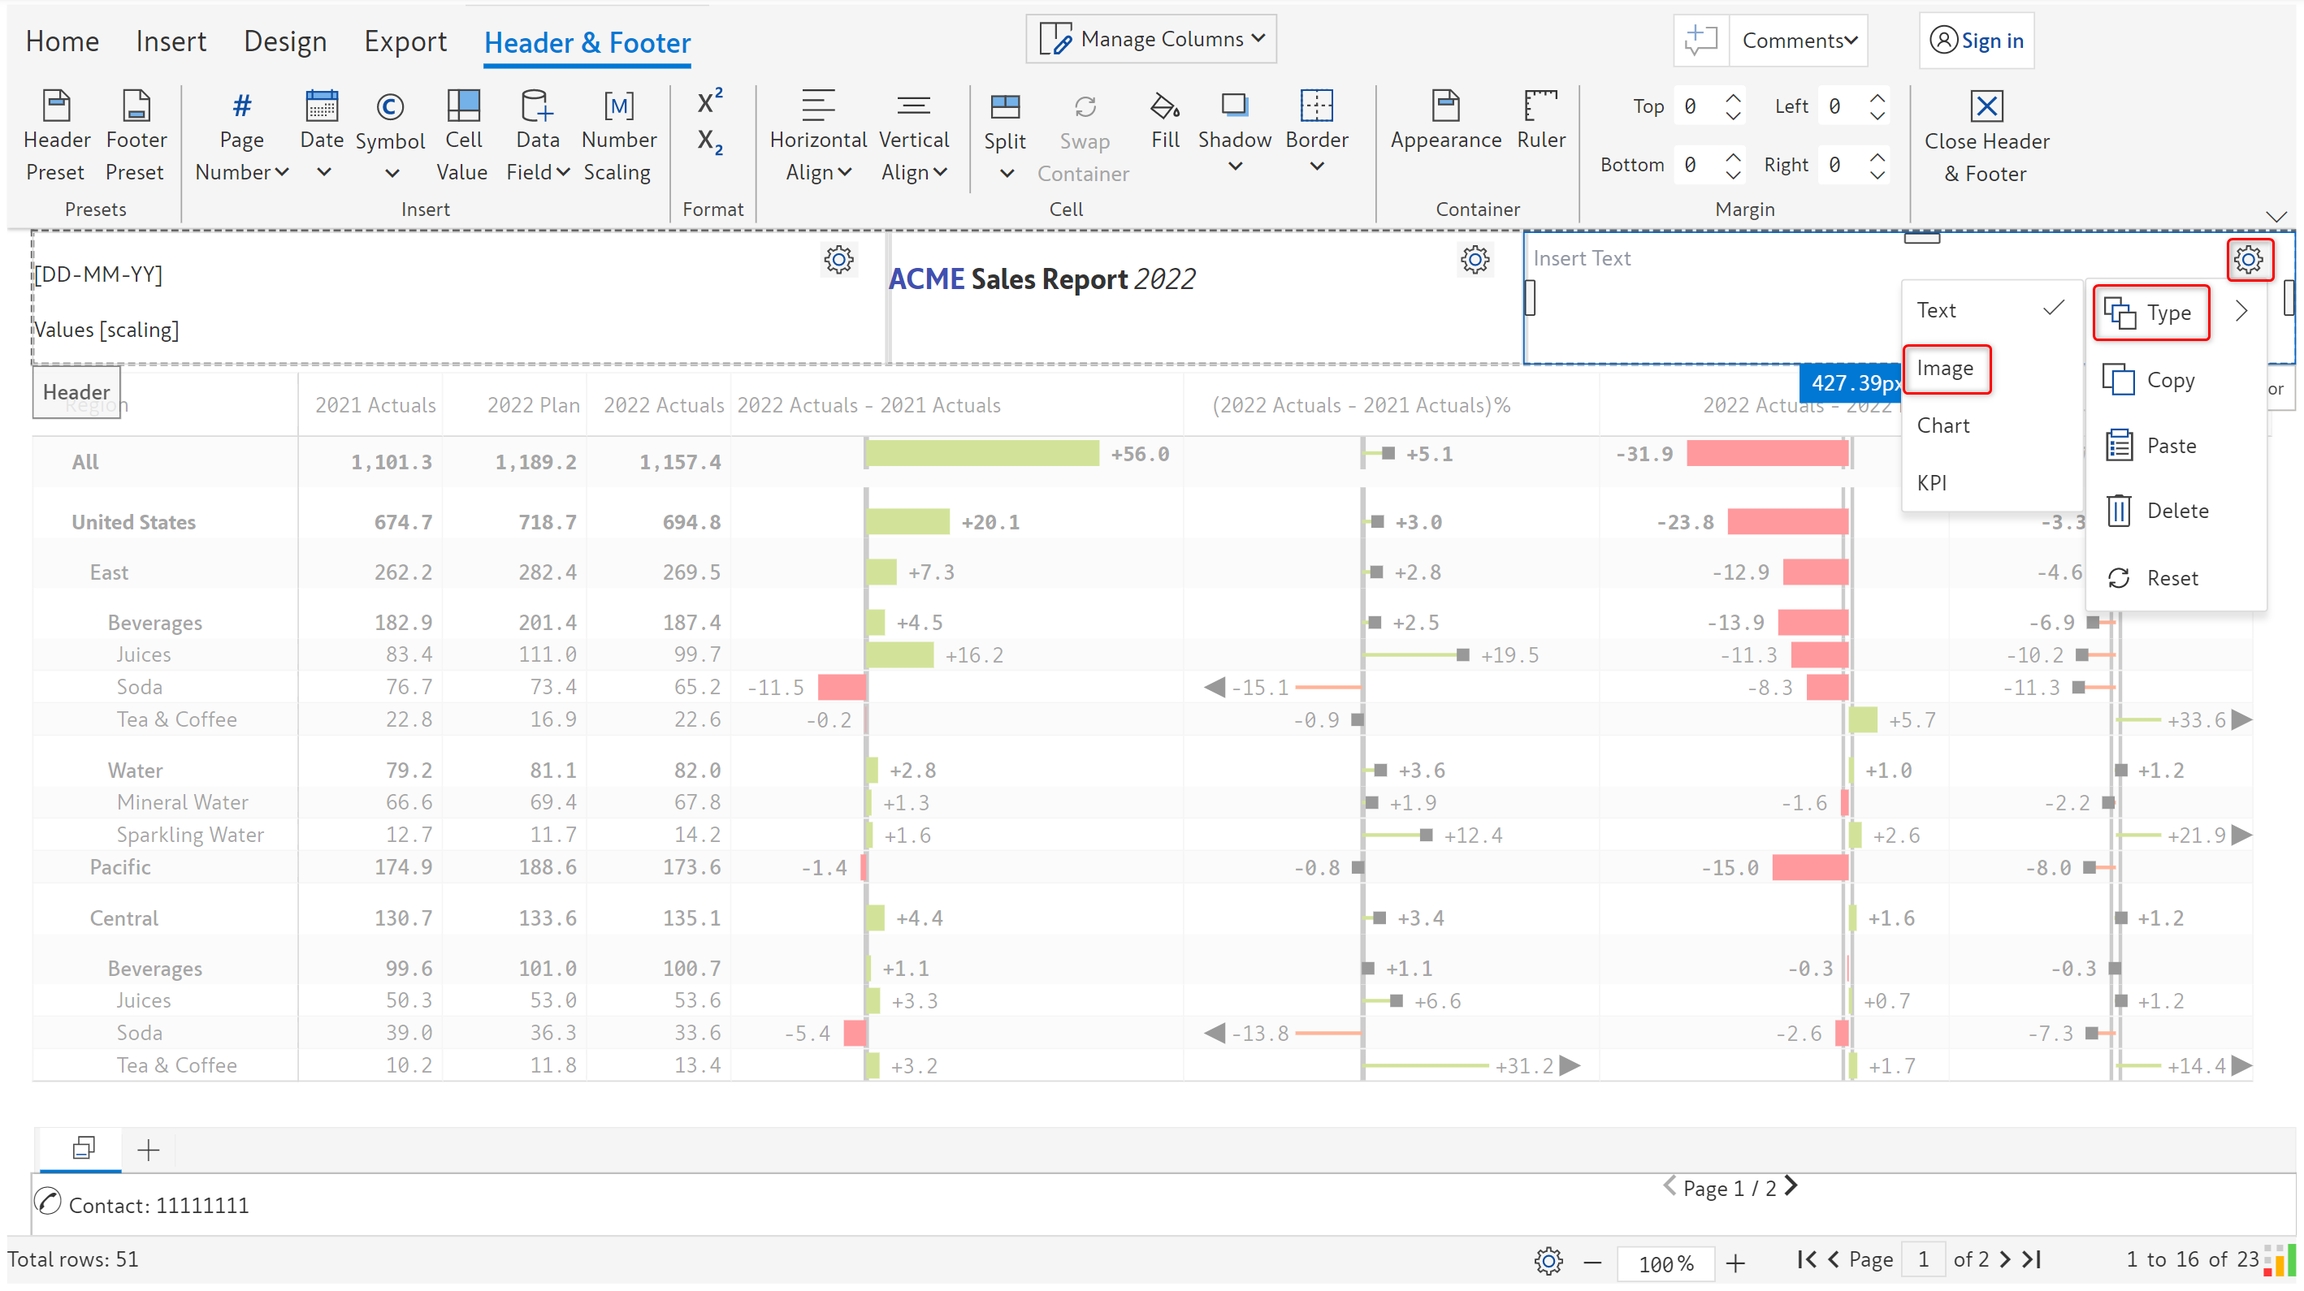
b) Select the 'Settings' icon in the cell where you want to add an image and select 'Type' -> 'Image'.

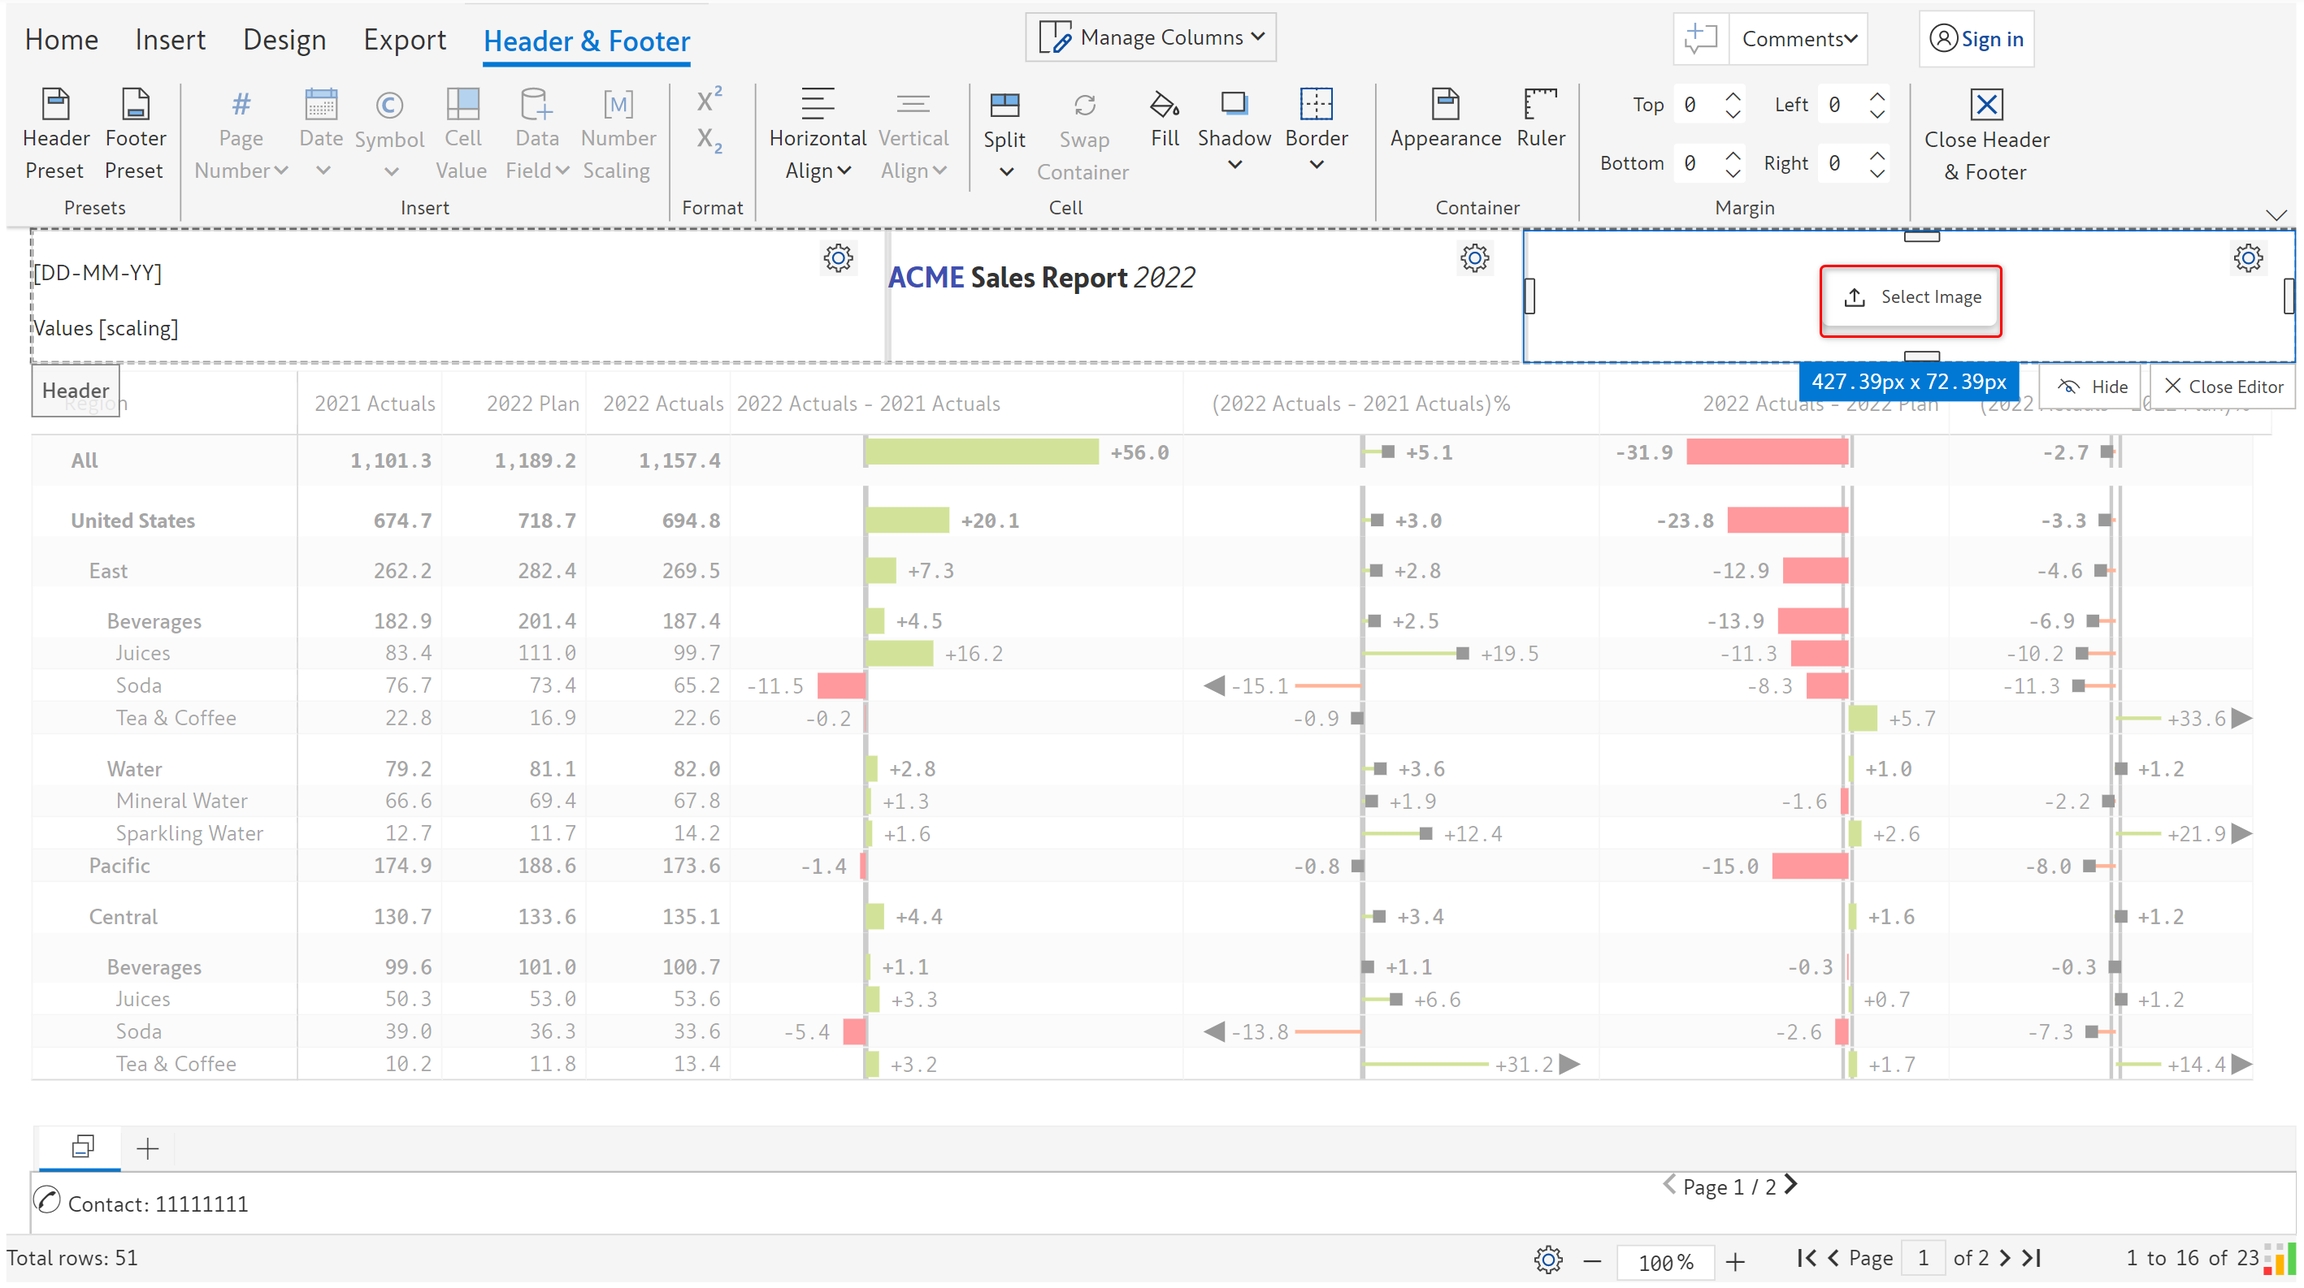
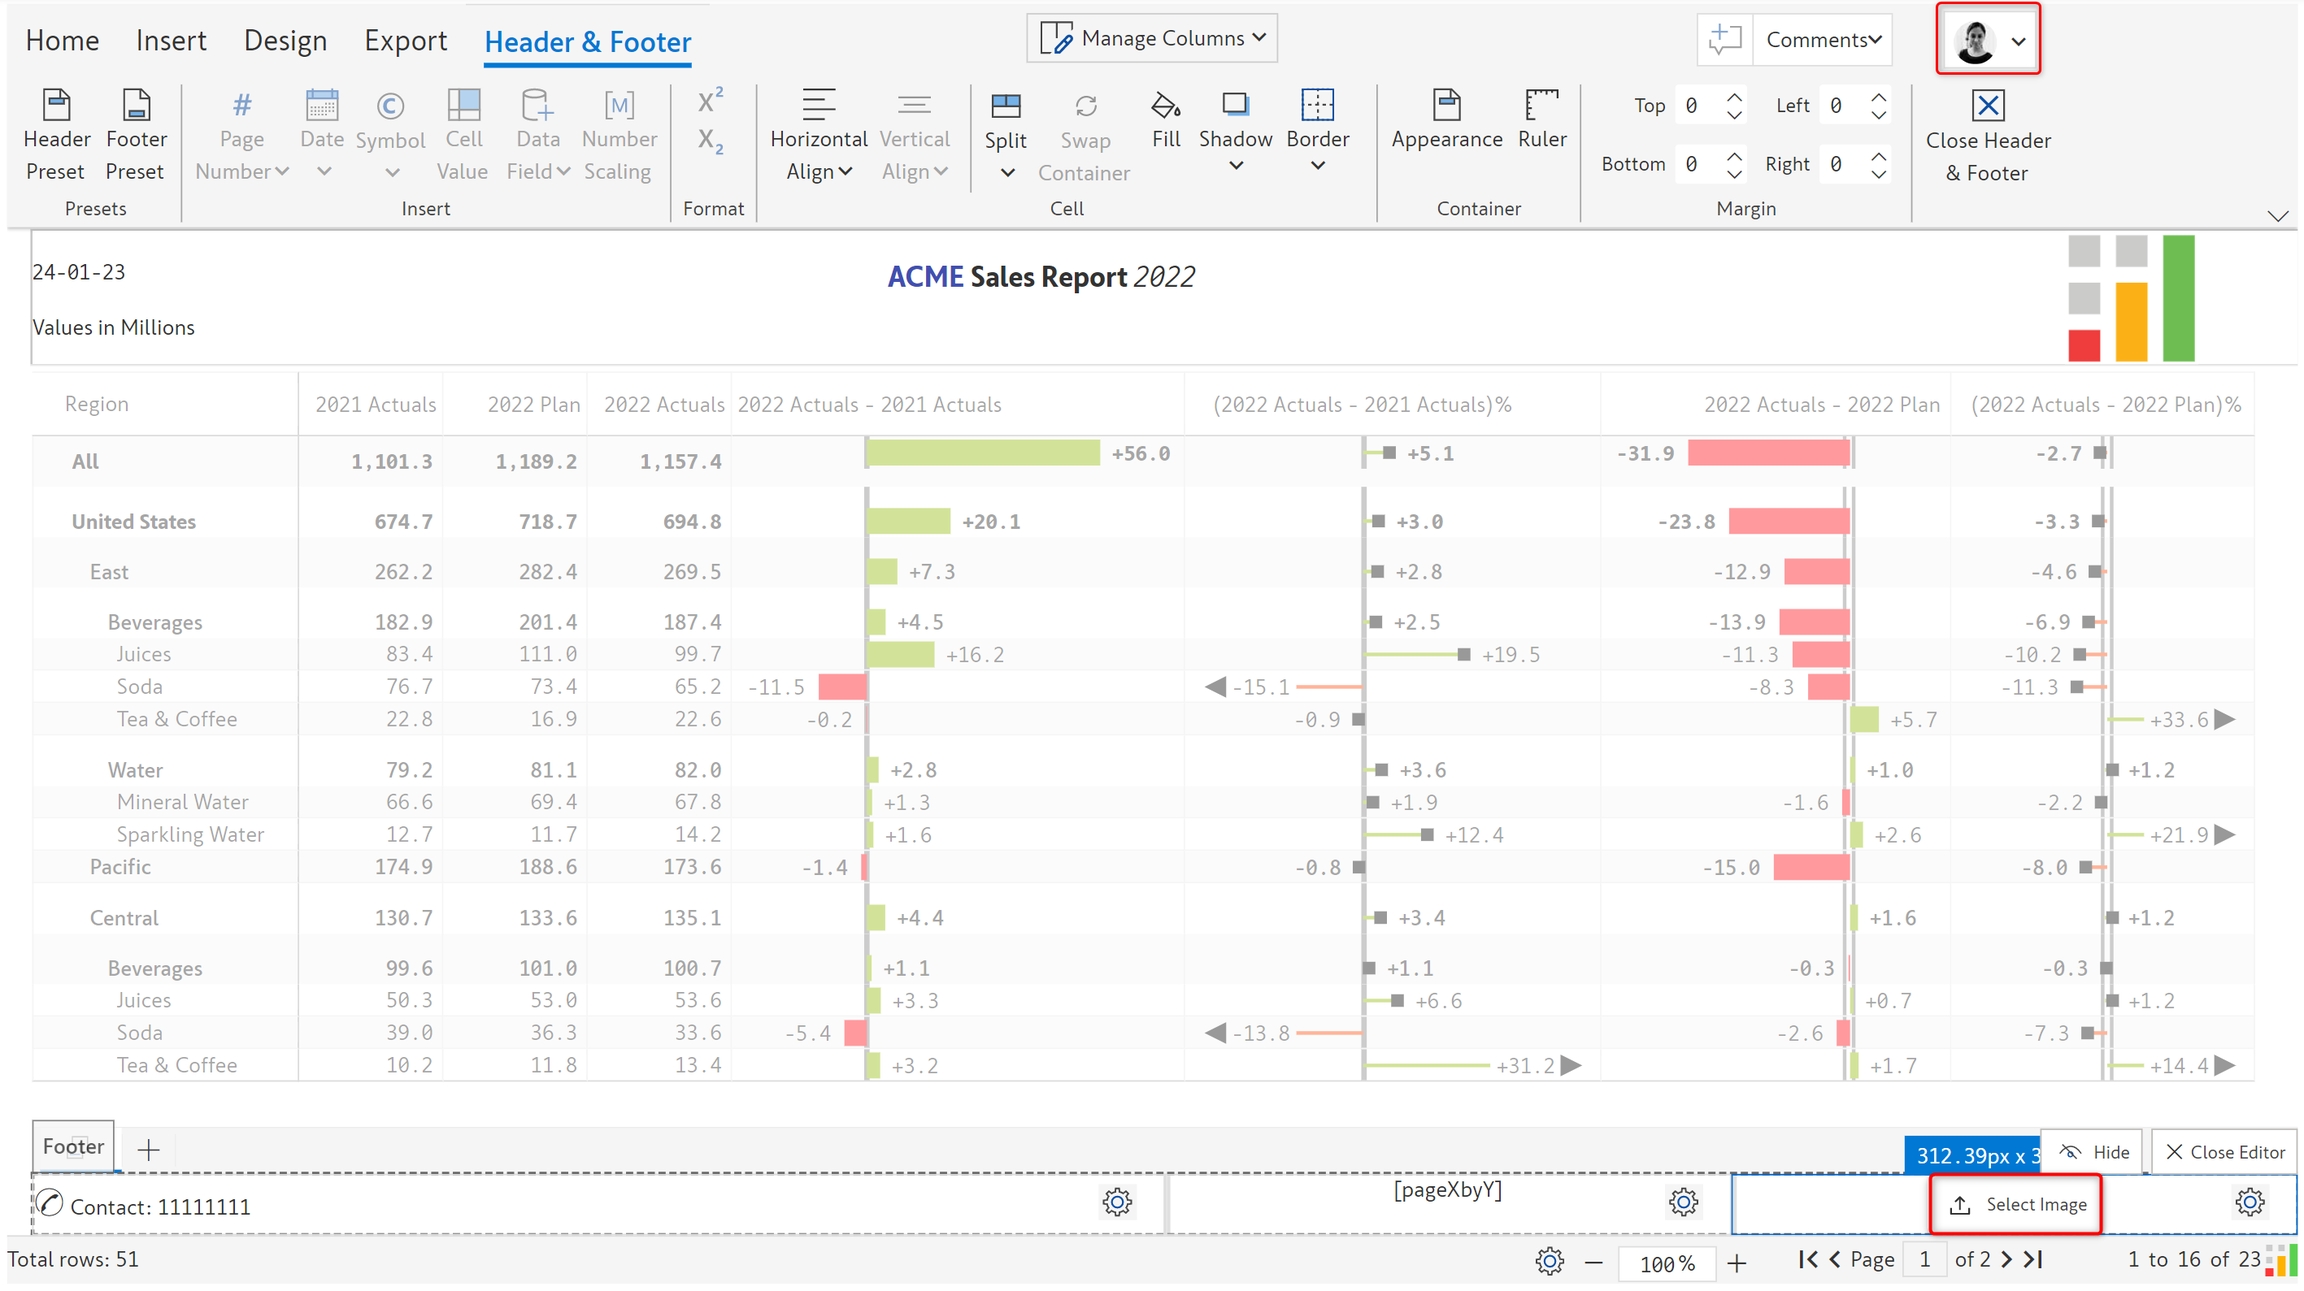
c) You can see an option to select the image as highlighted.

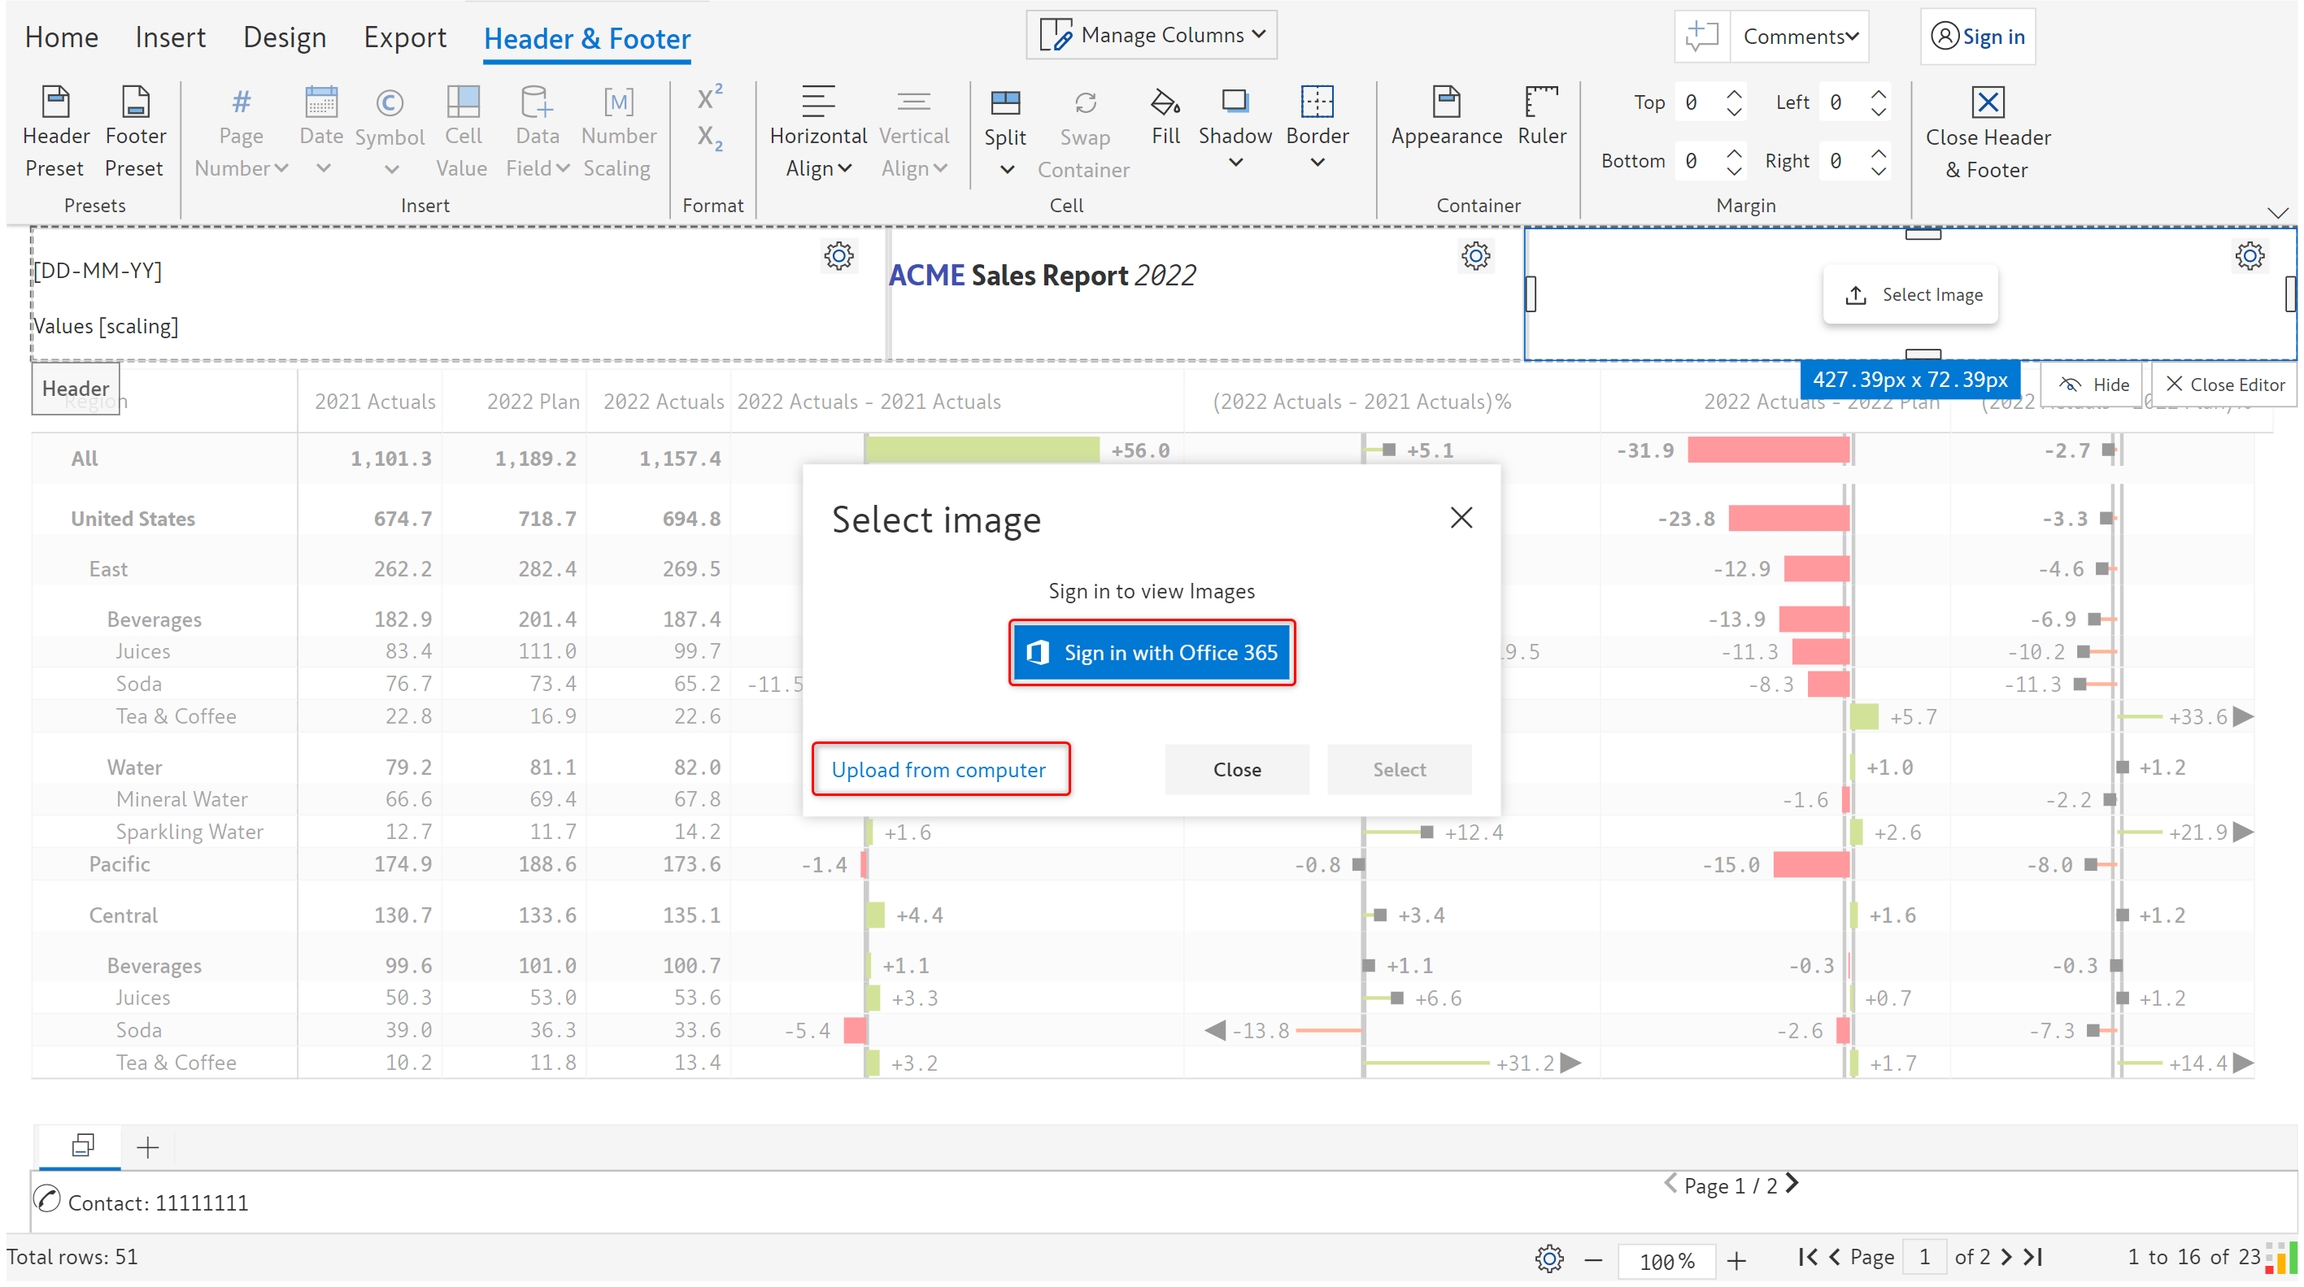
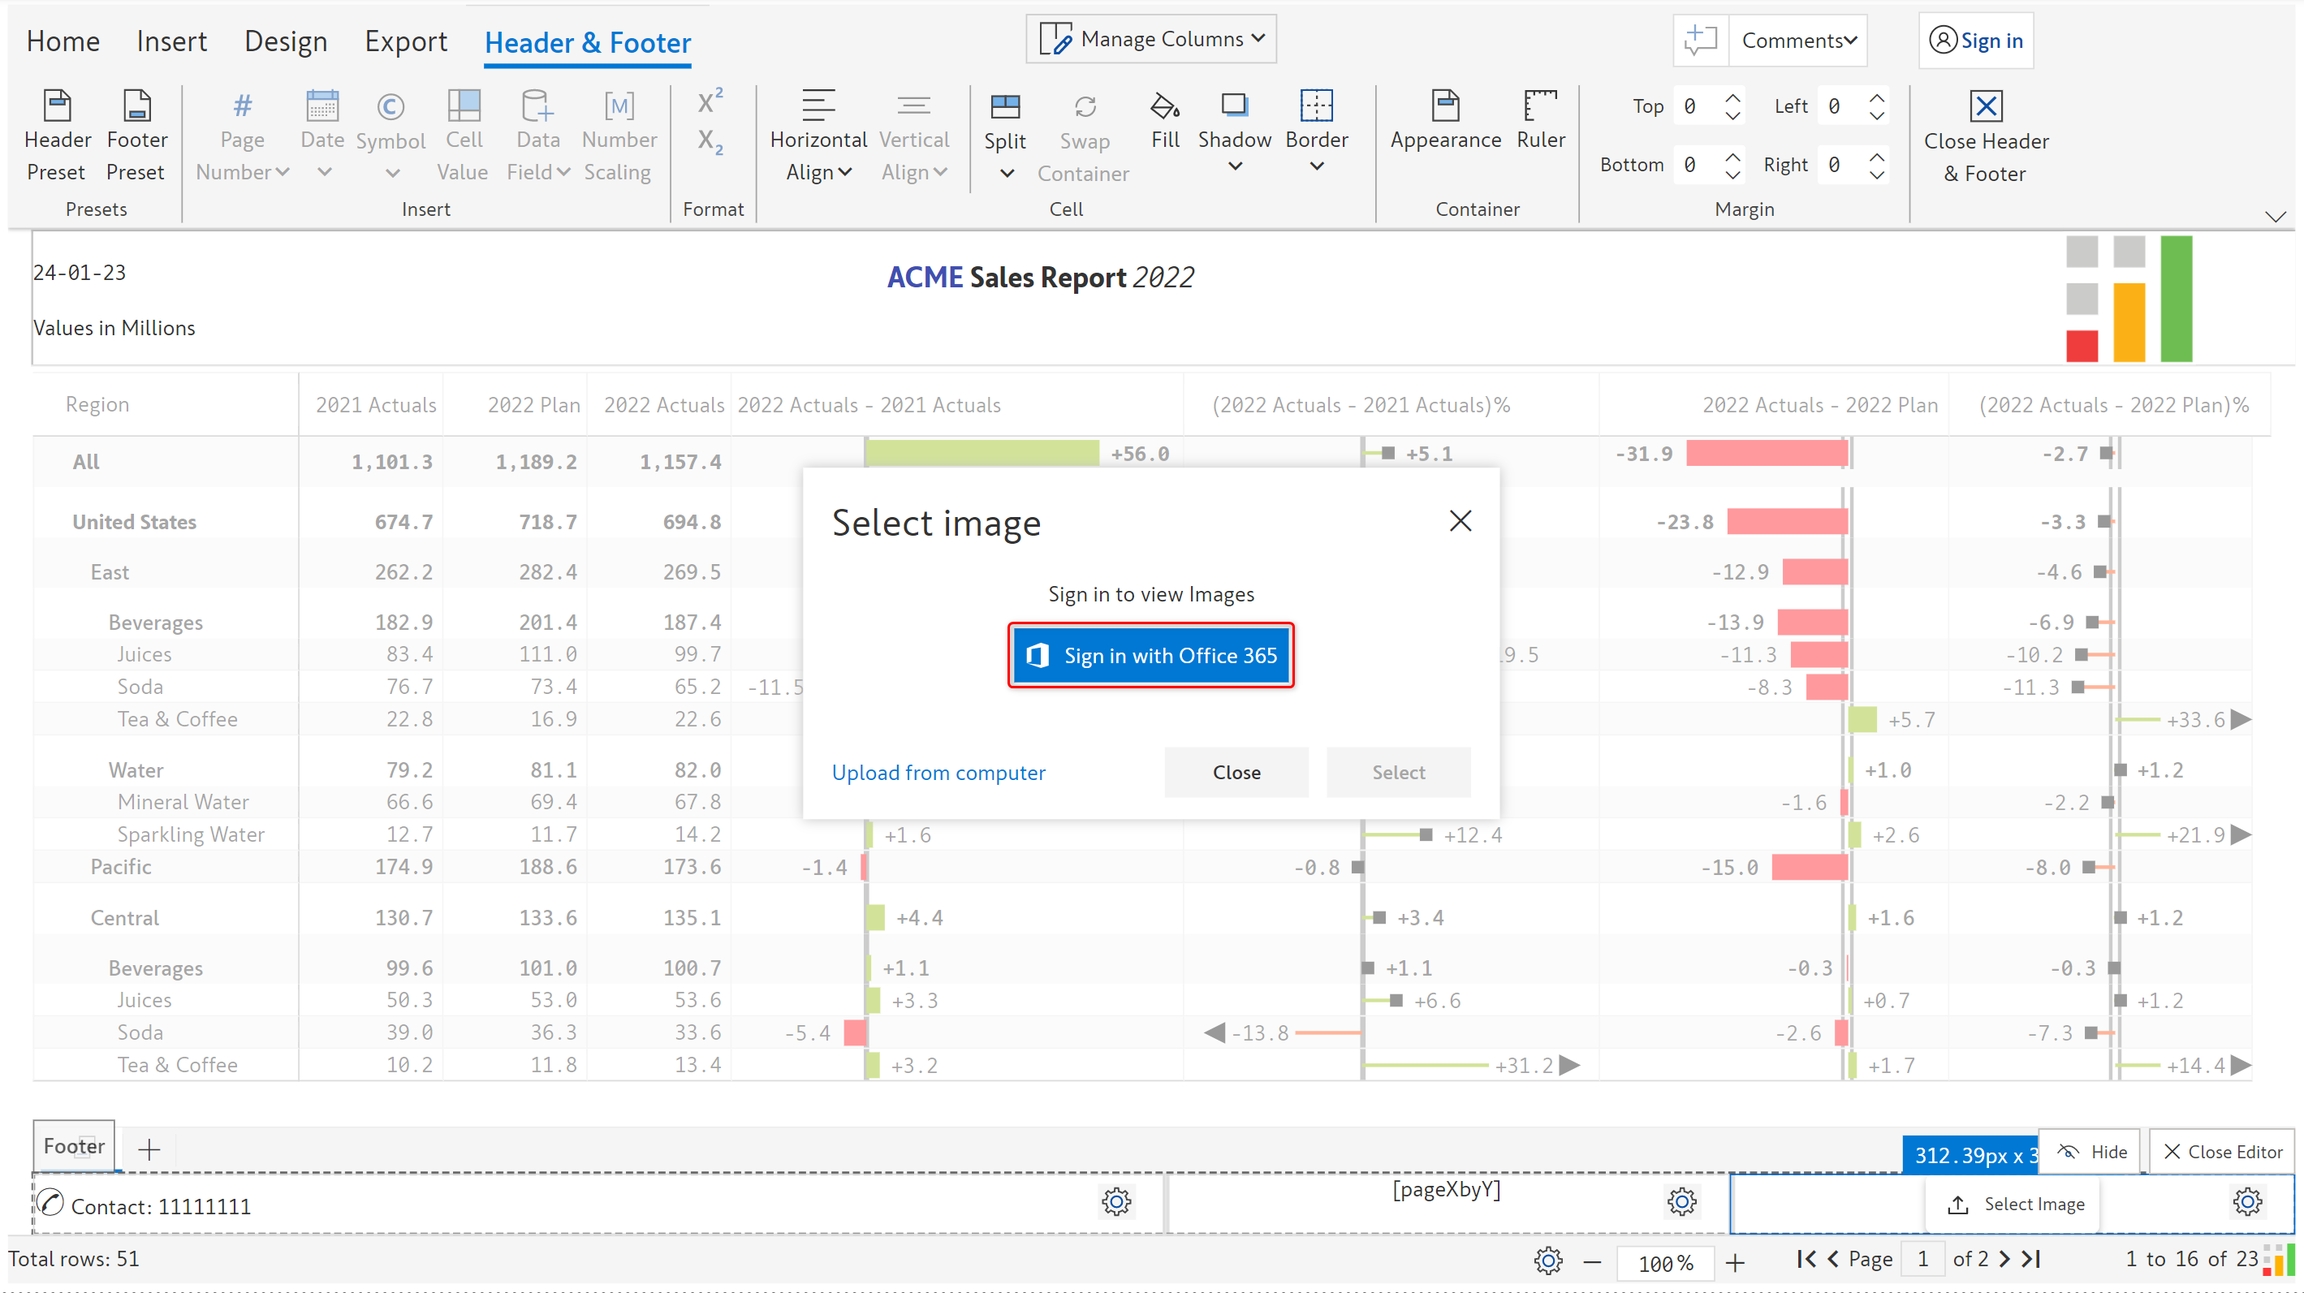
d) On clicking 'Select image', you can see a dialog box with two options - 'Sign in with O365' and 'Upload from computer'.

1. From local system

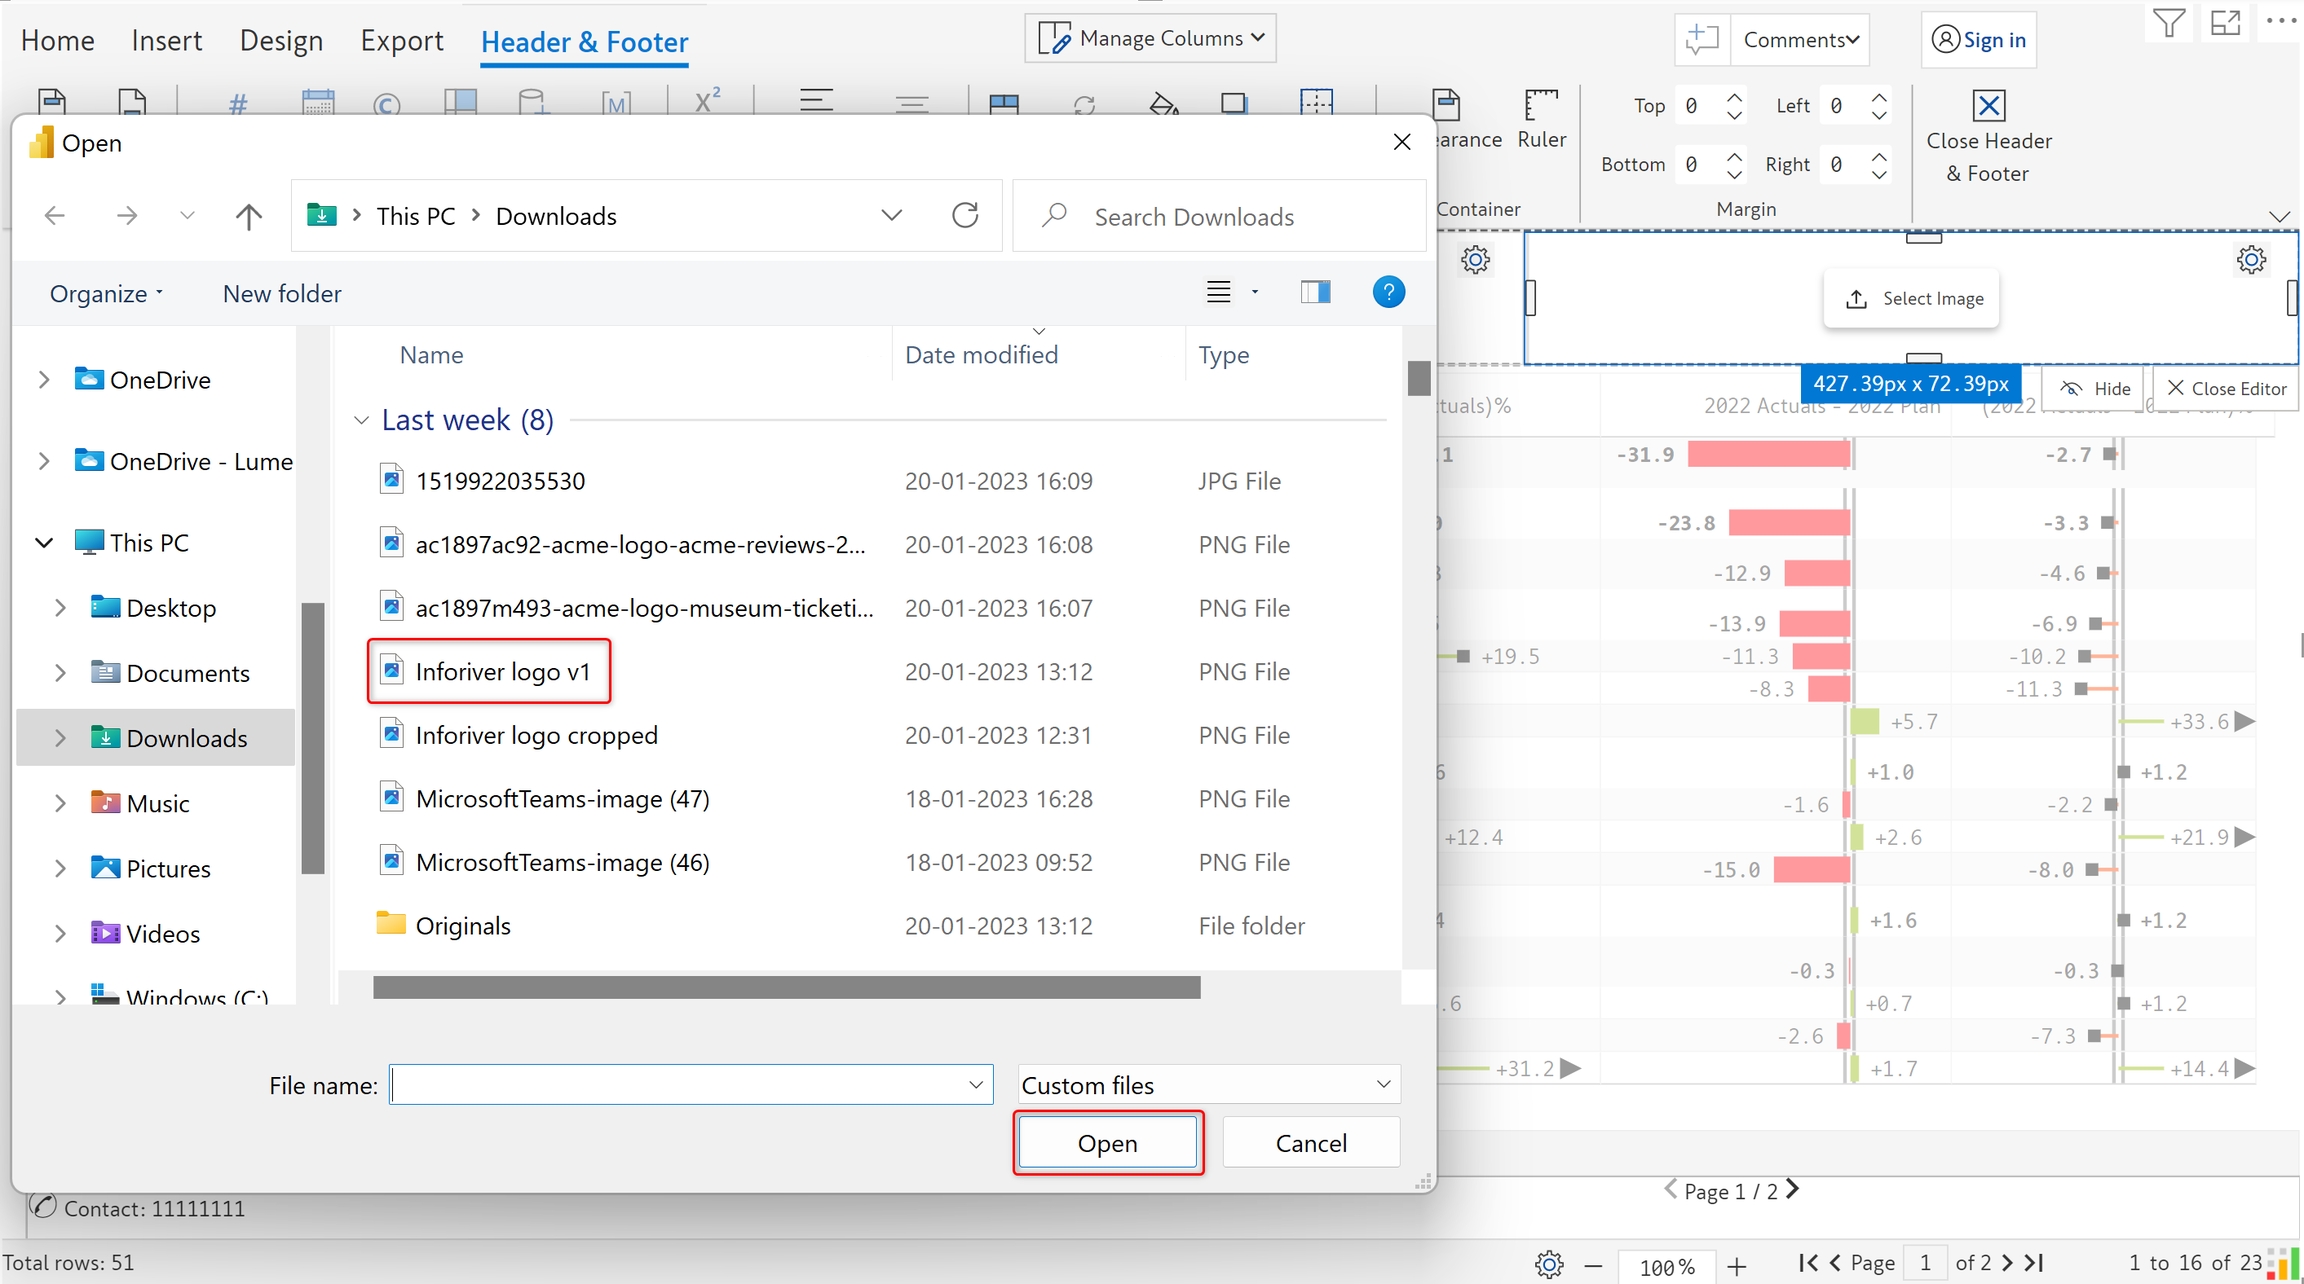
a) On selecting the 'Upload from computer' option in the 'Select image' dialog box, you'll be able to select a file from your system. Select the file and click 'Open'.

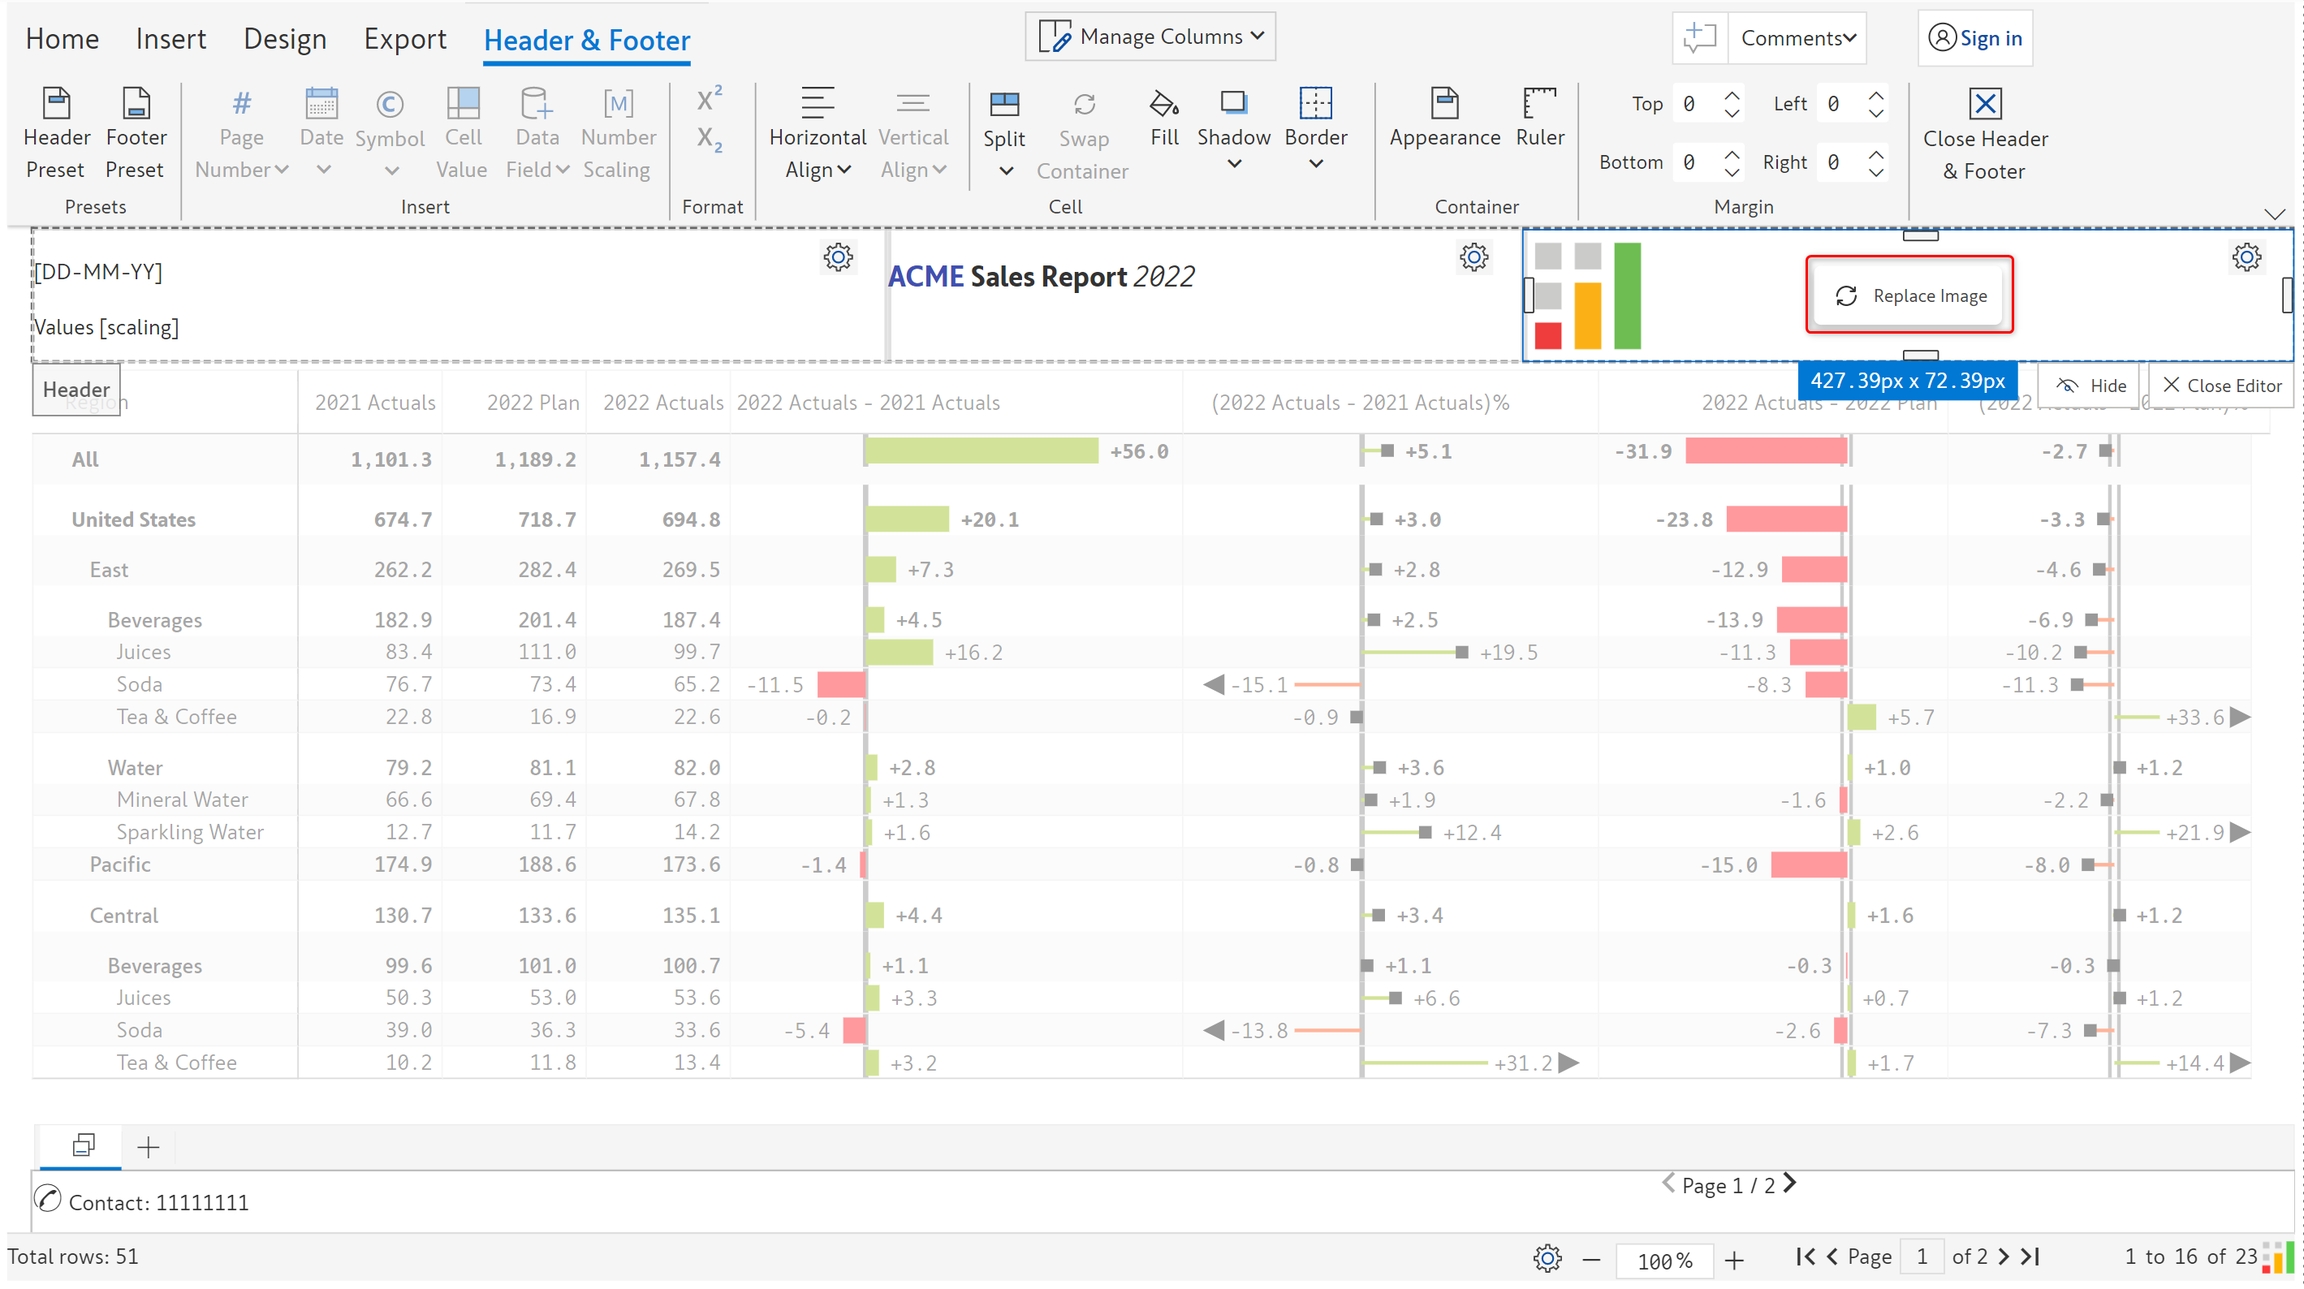
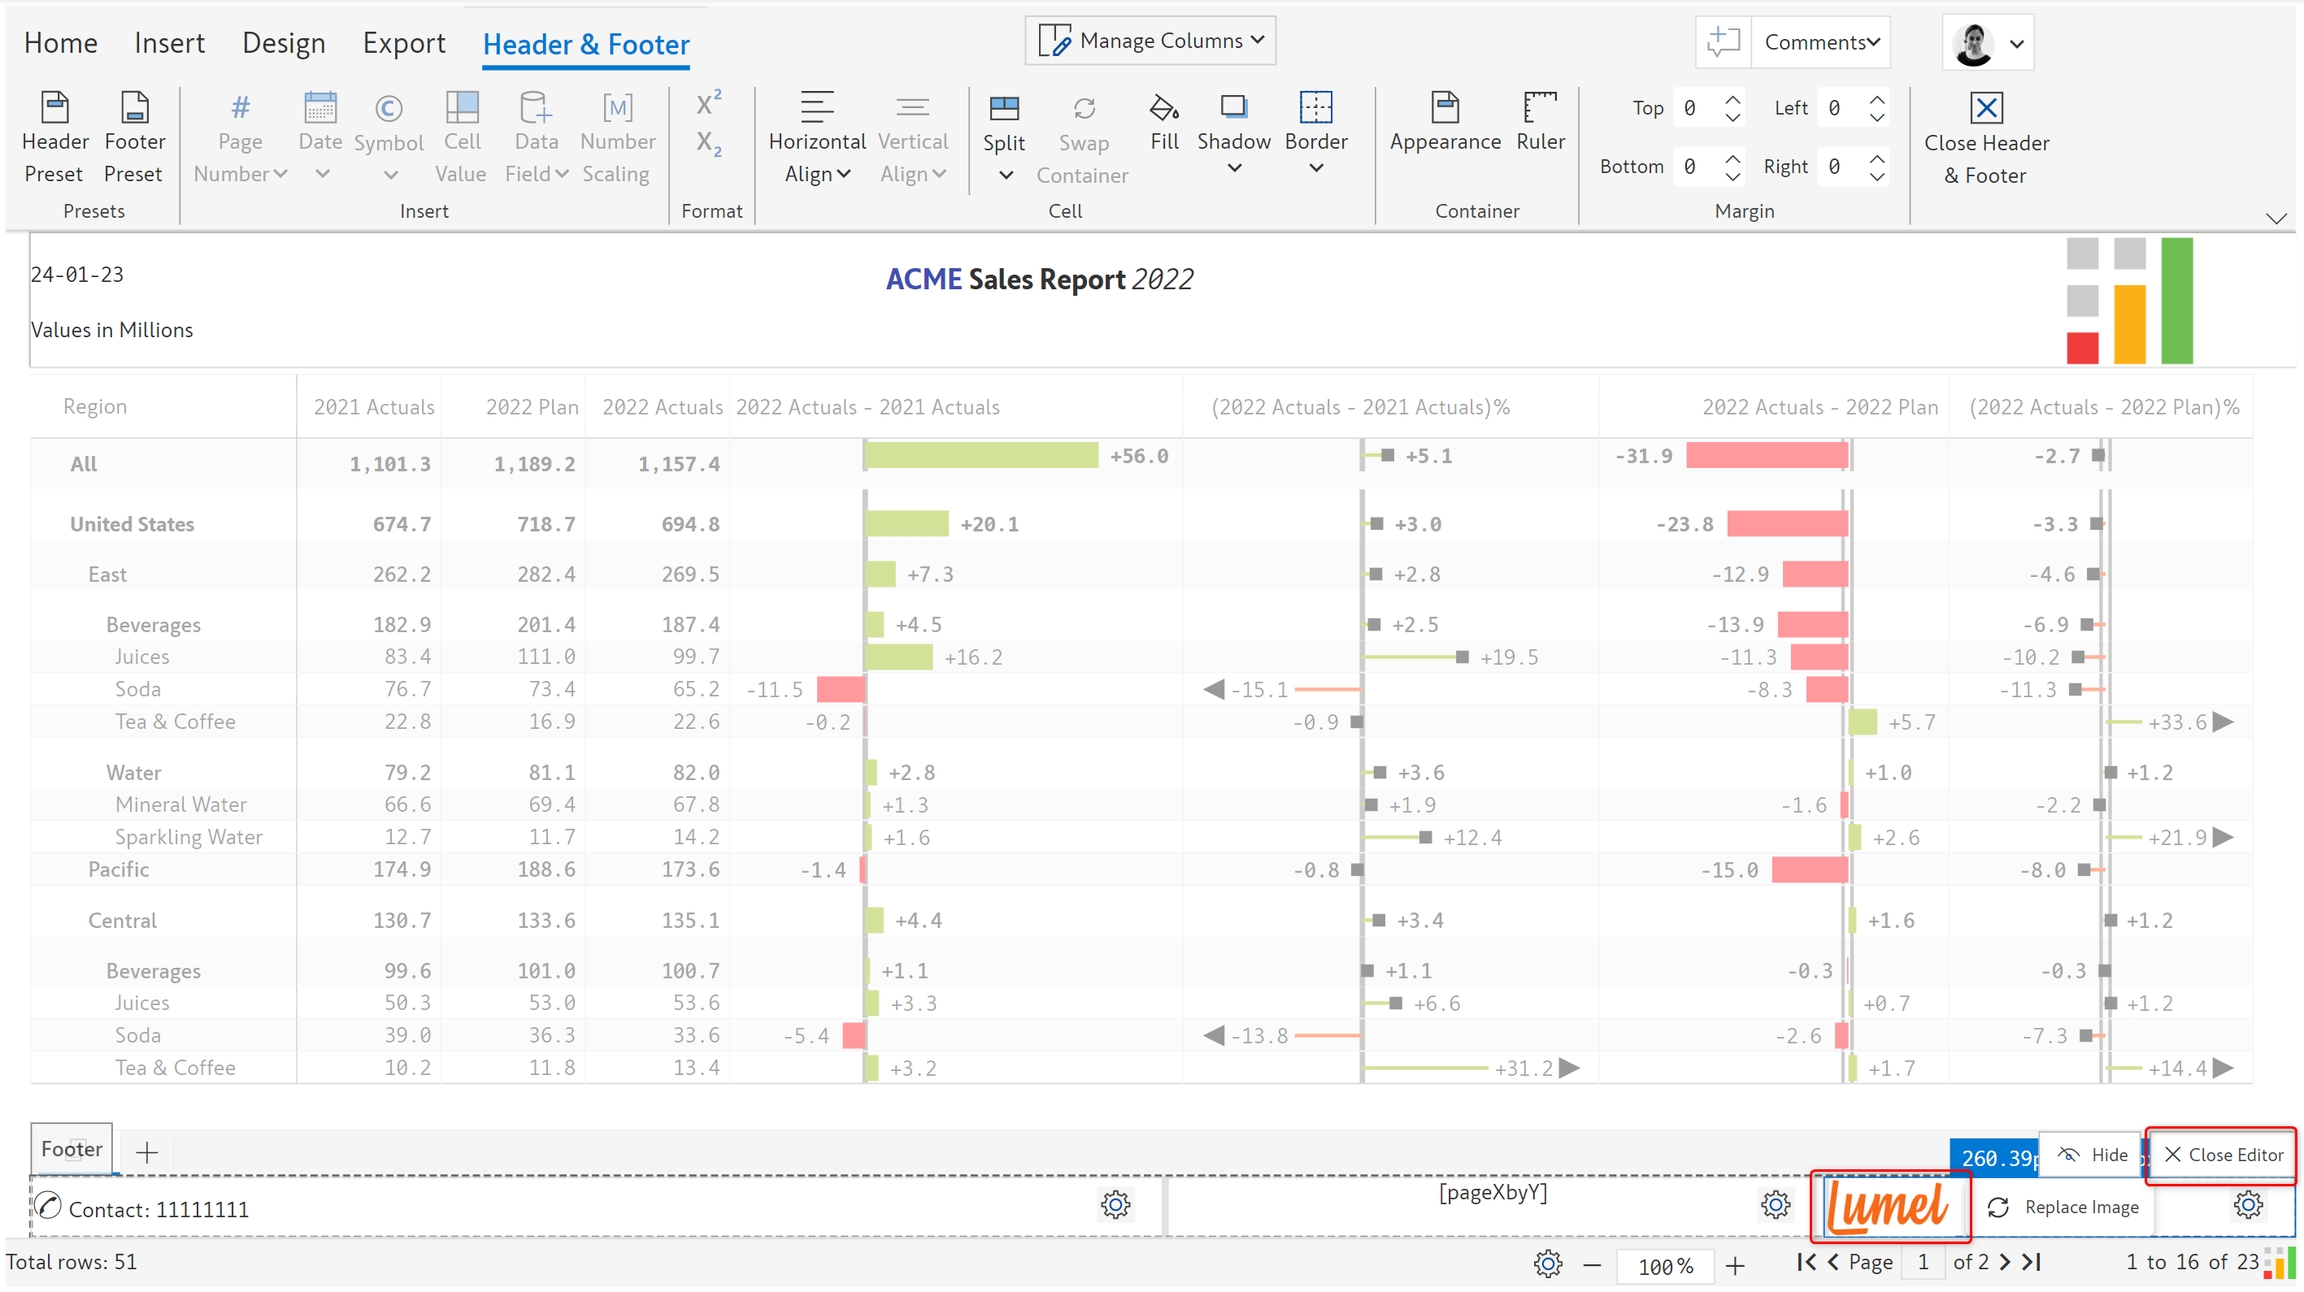
b) The image gets added as shown.

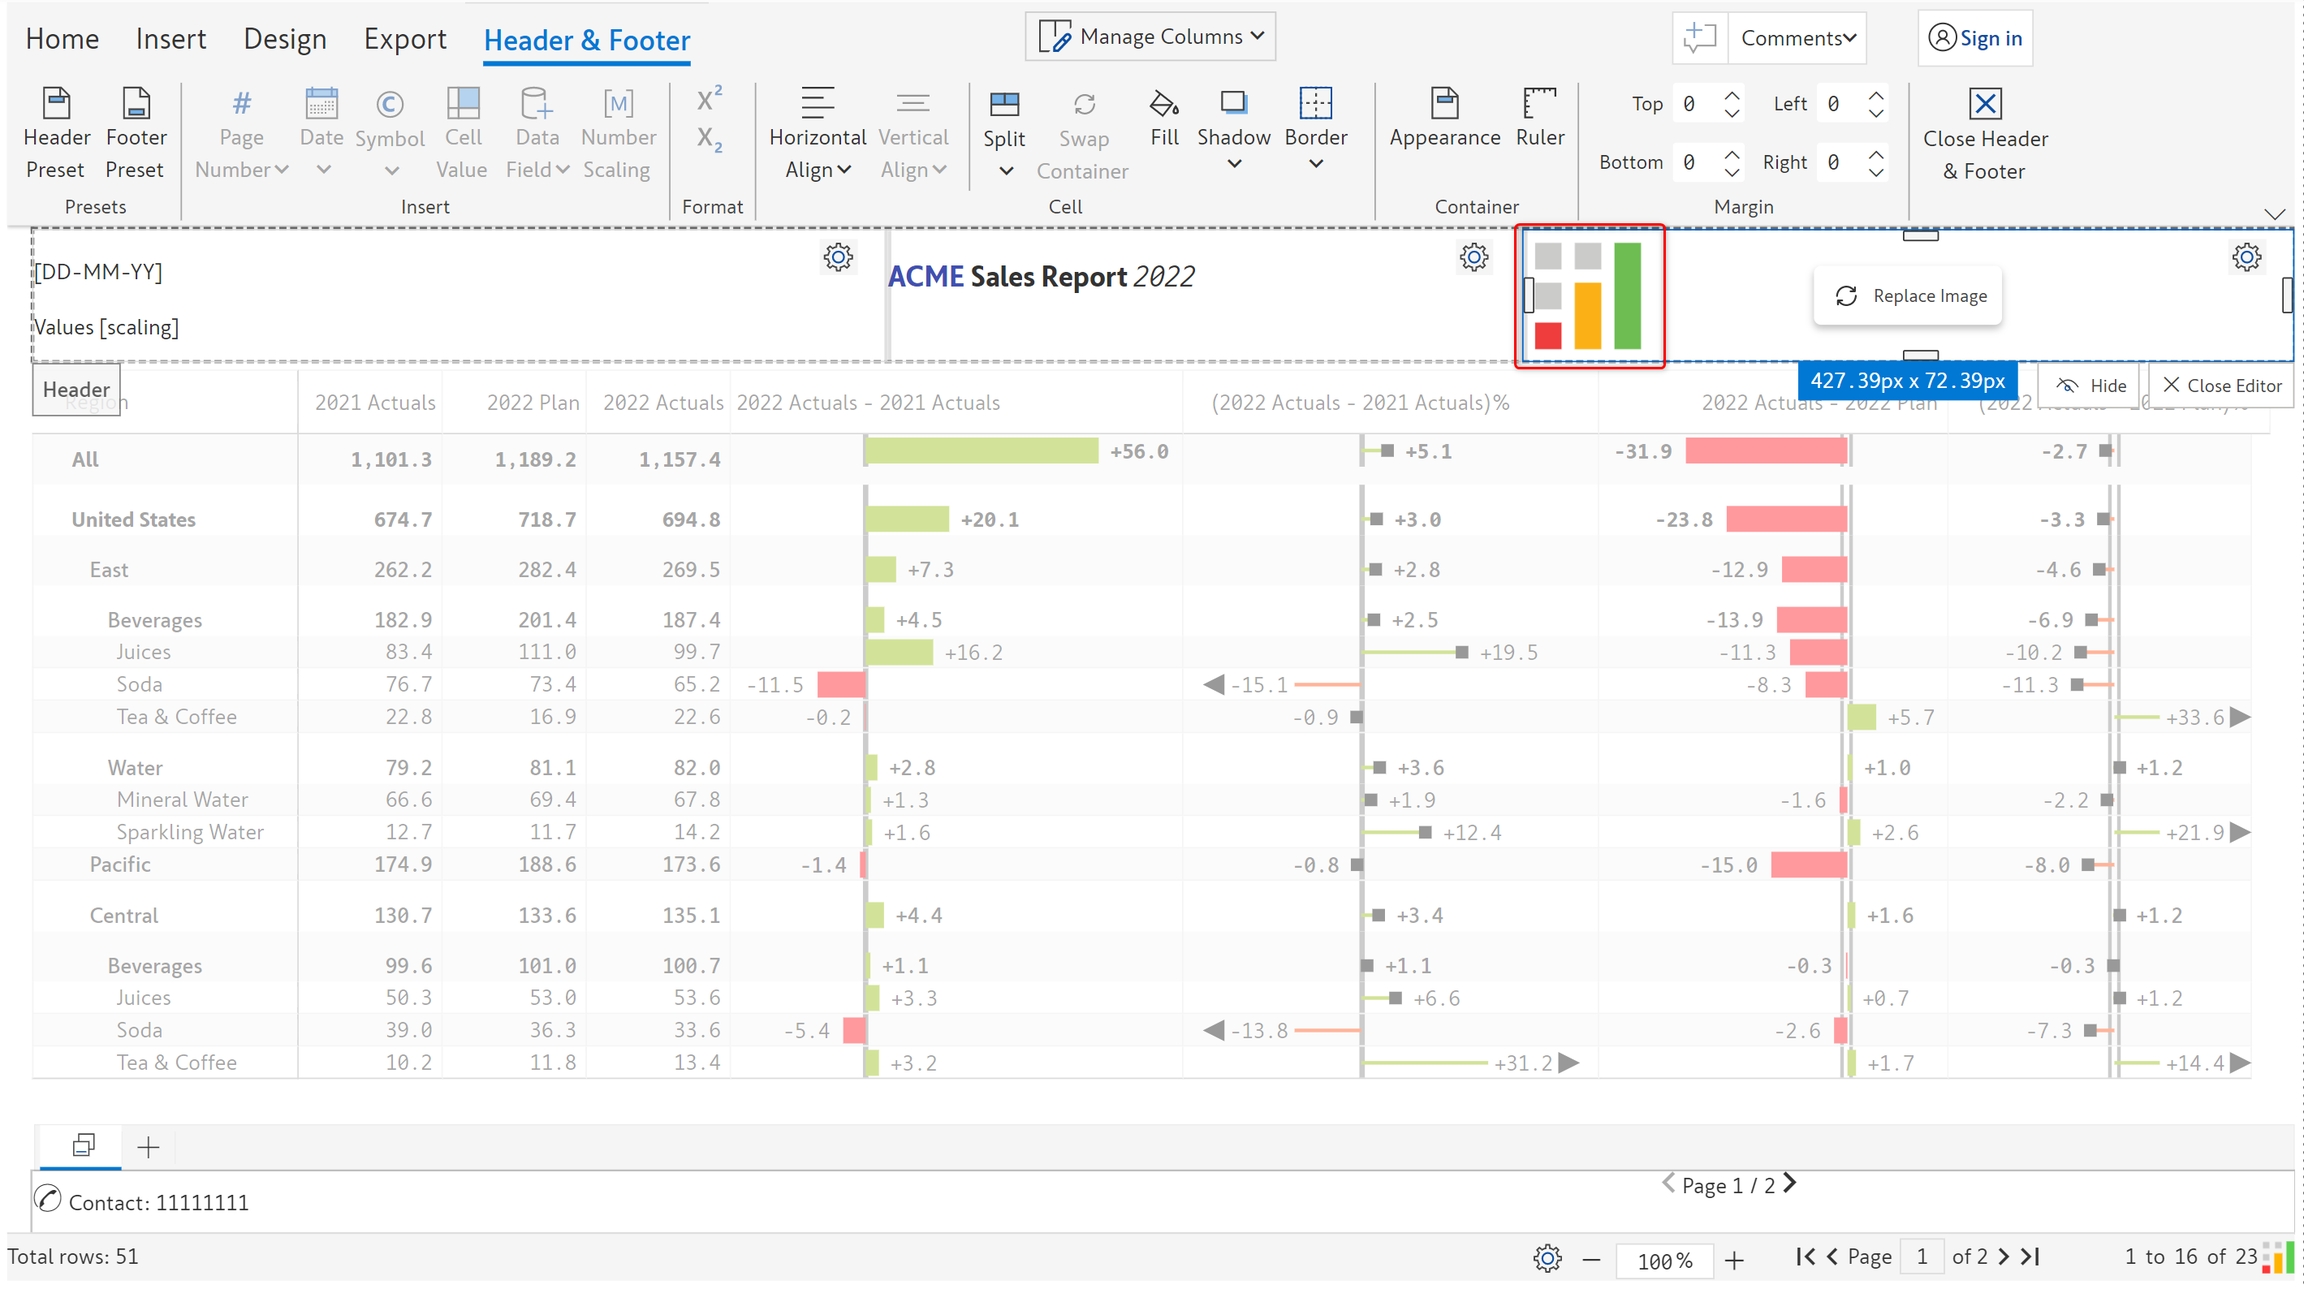
c) Once you add an image, if needed, you can replace the image using the 'Replace image' option.

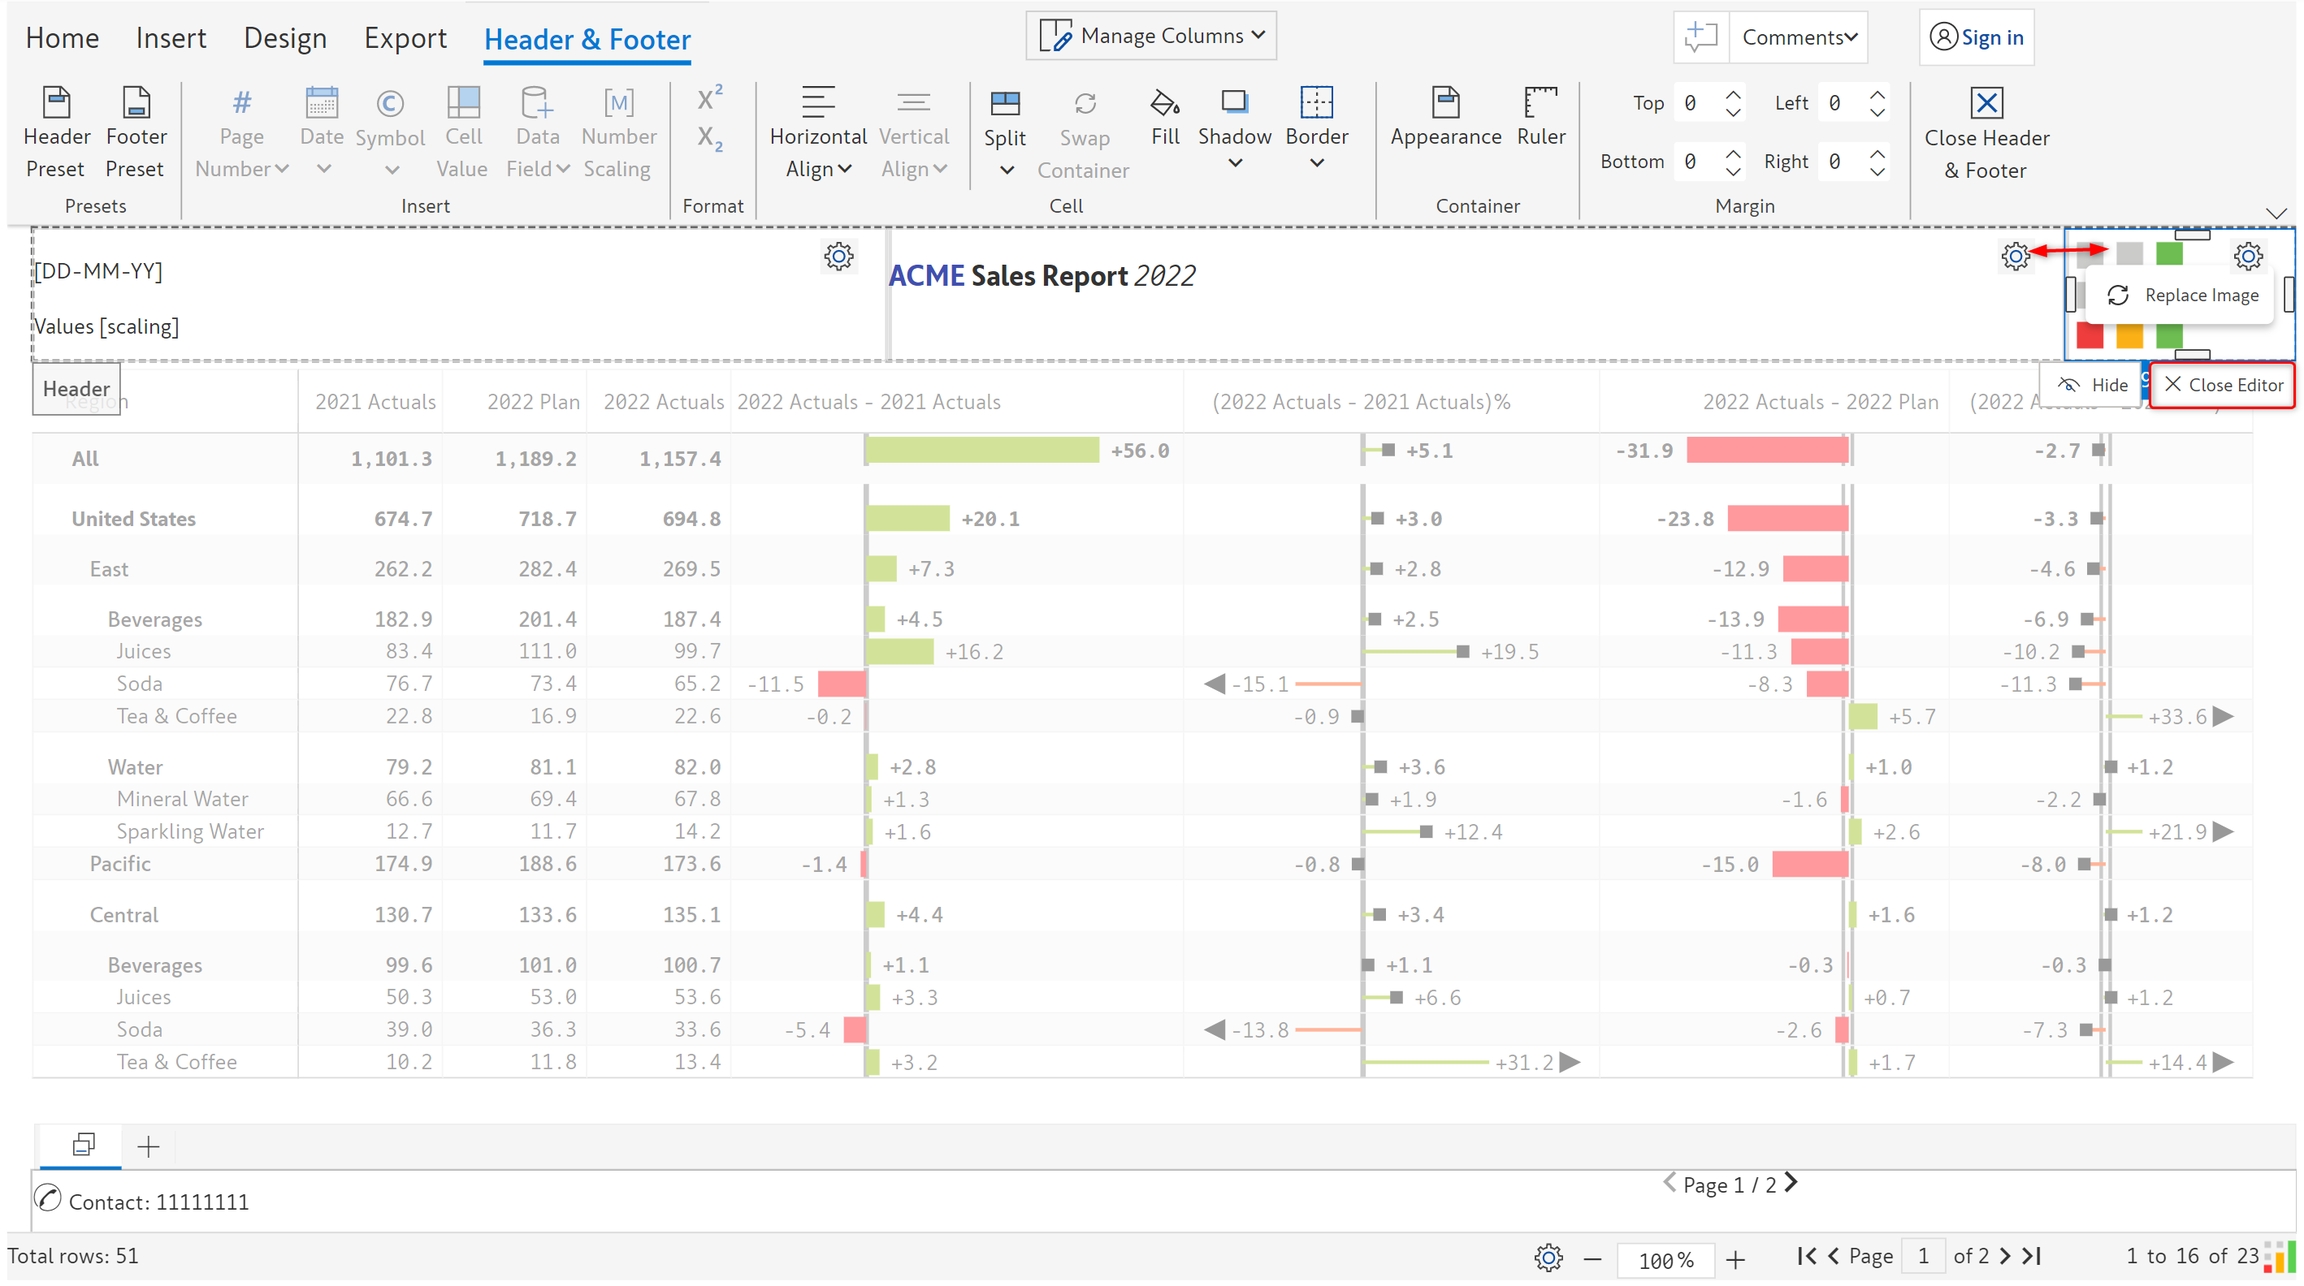
d) You can resize the cell as desired and click 'Close editor' to see the image in read mode.

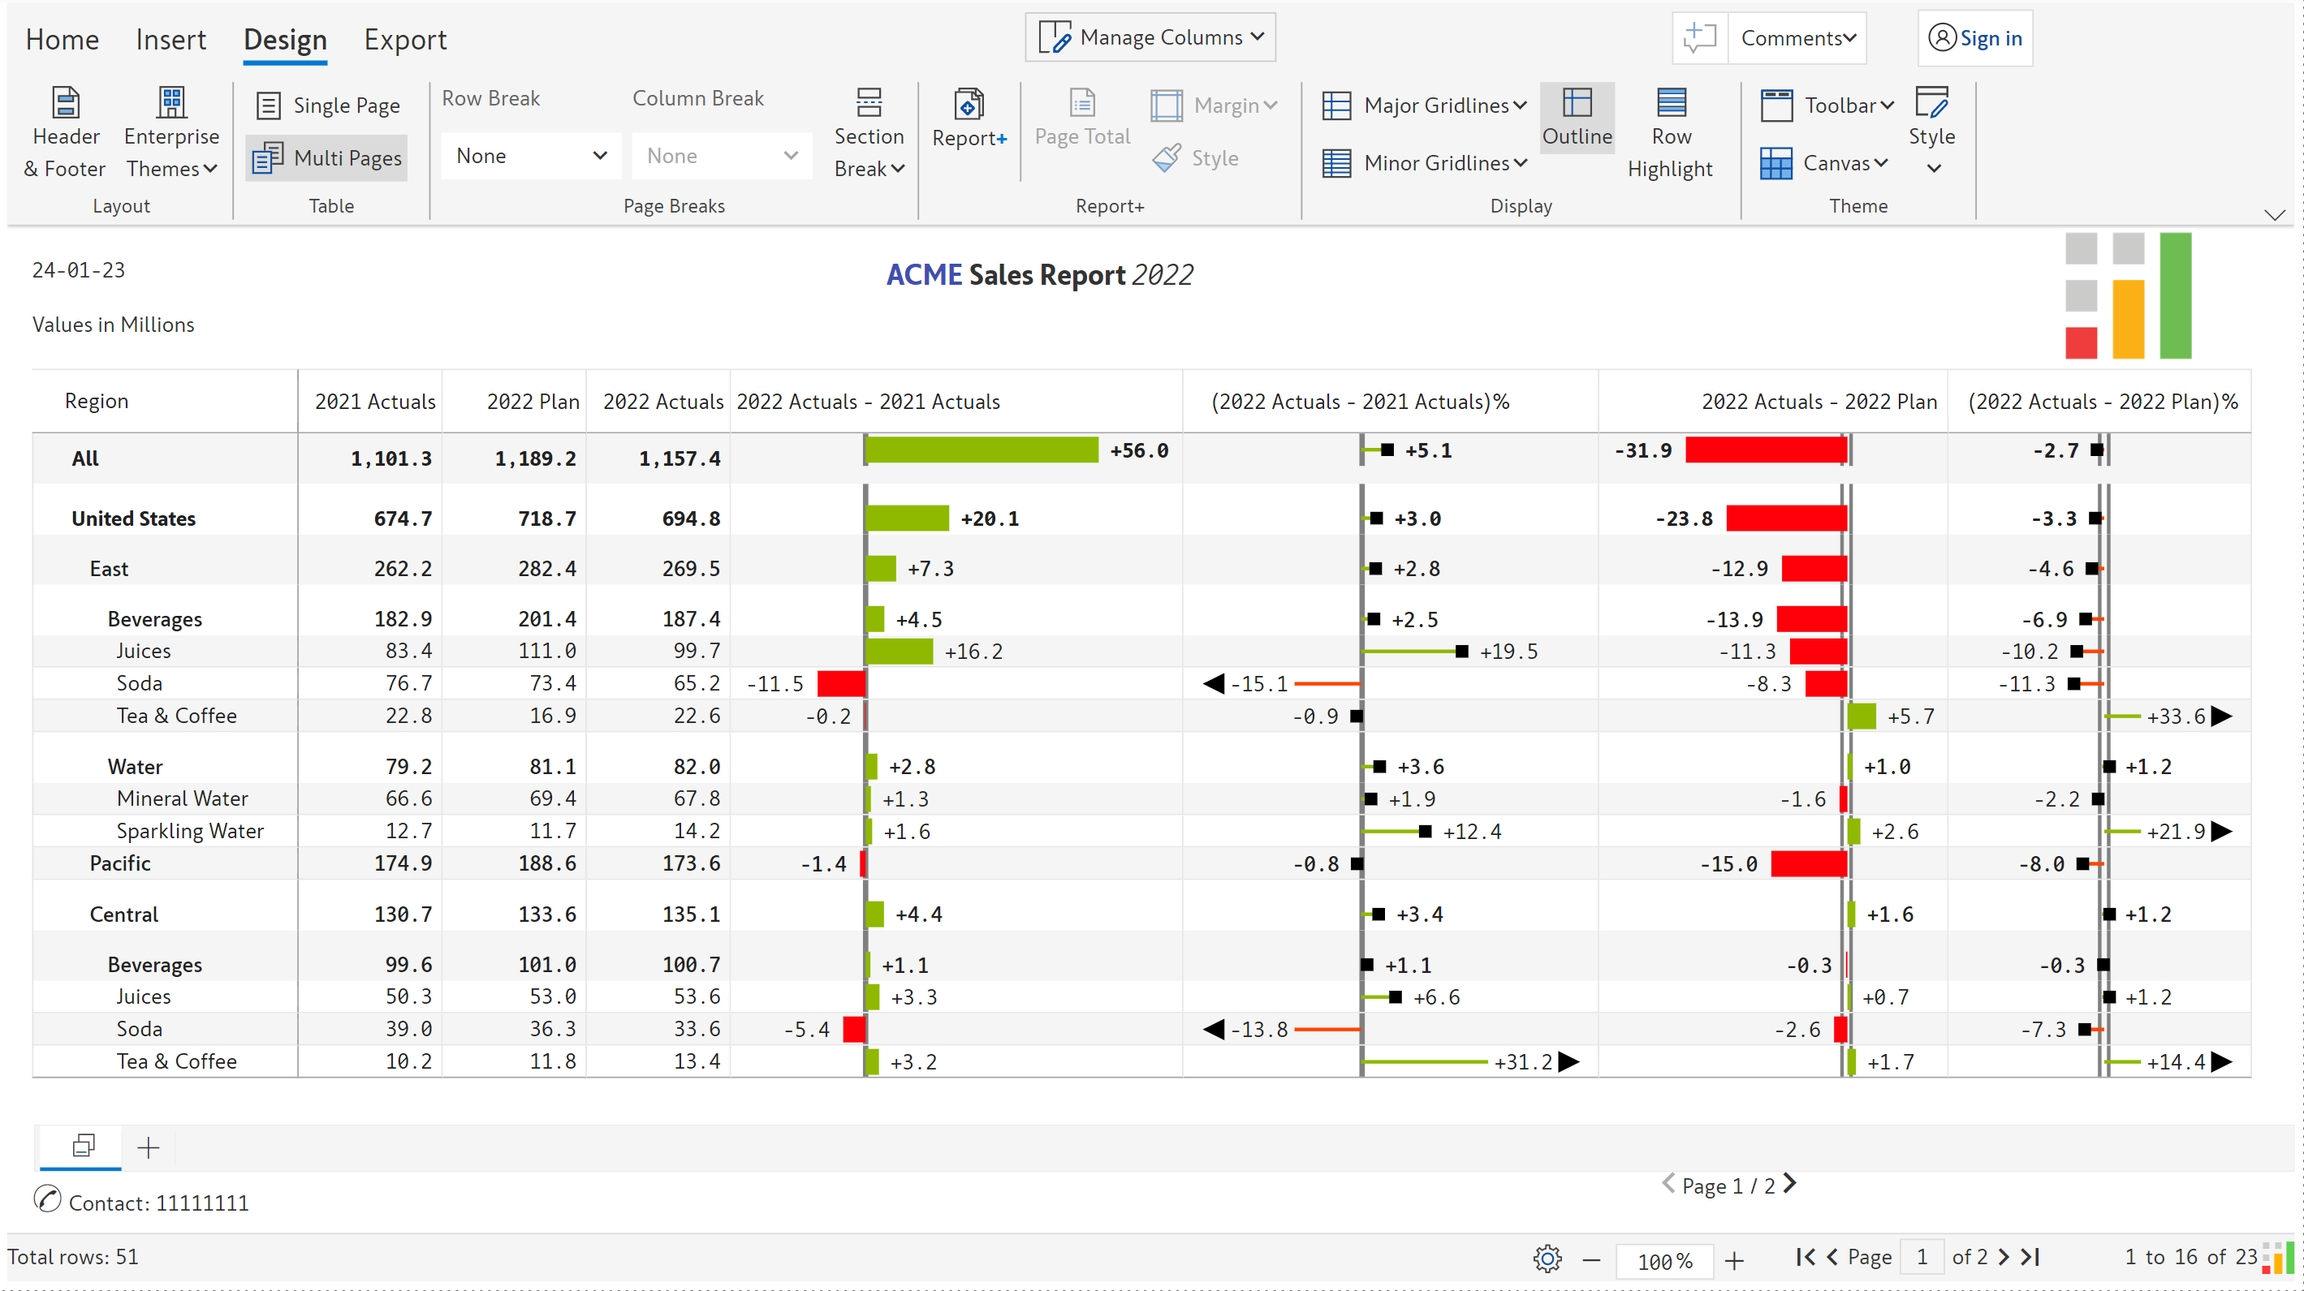
e) The image in the header in read mode is shown in the below image.

2. From the workspace

a) To access the images available in the workspace, you need to first sign in with your Office 365 account. Click on the 'Sign in with Office 365' button.

b) Once you are logged in as indicated by the icon on the top right, you can see the 'Select image' option.

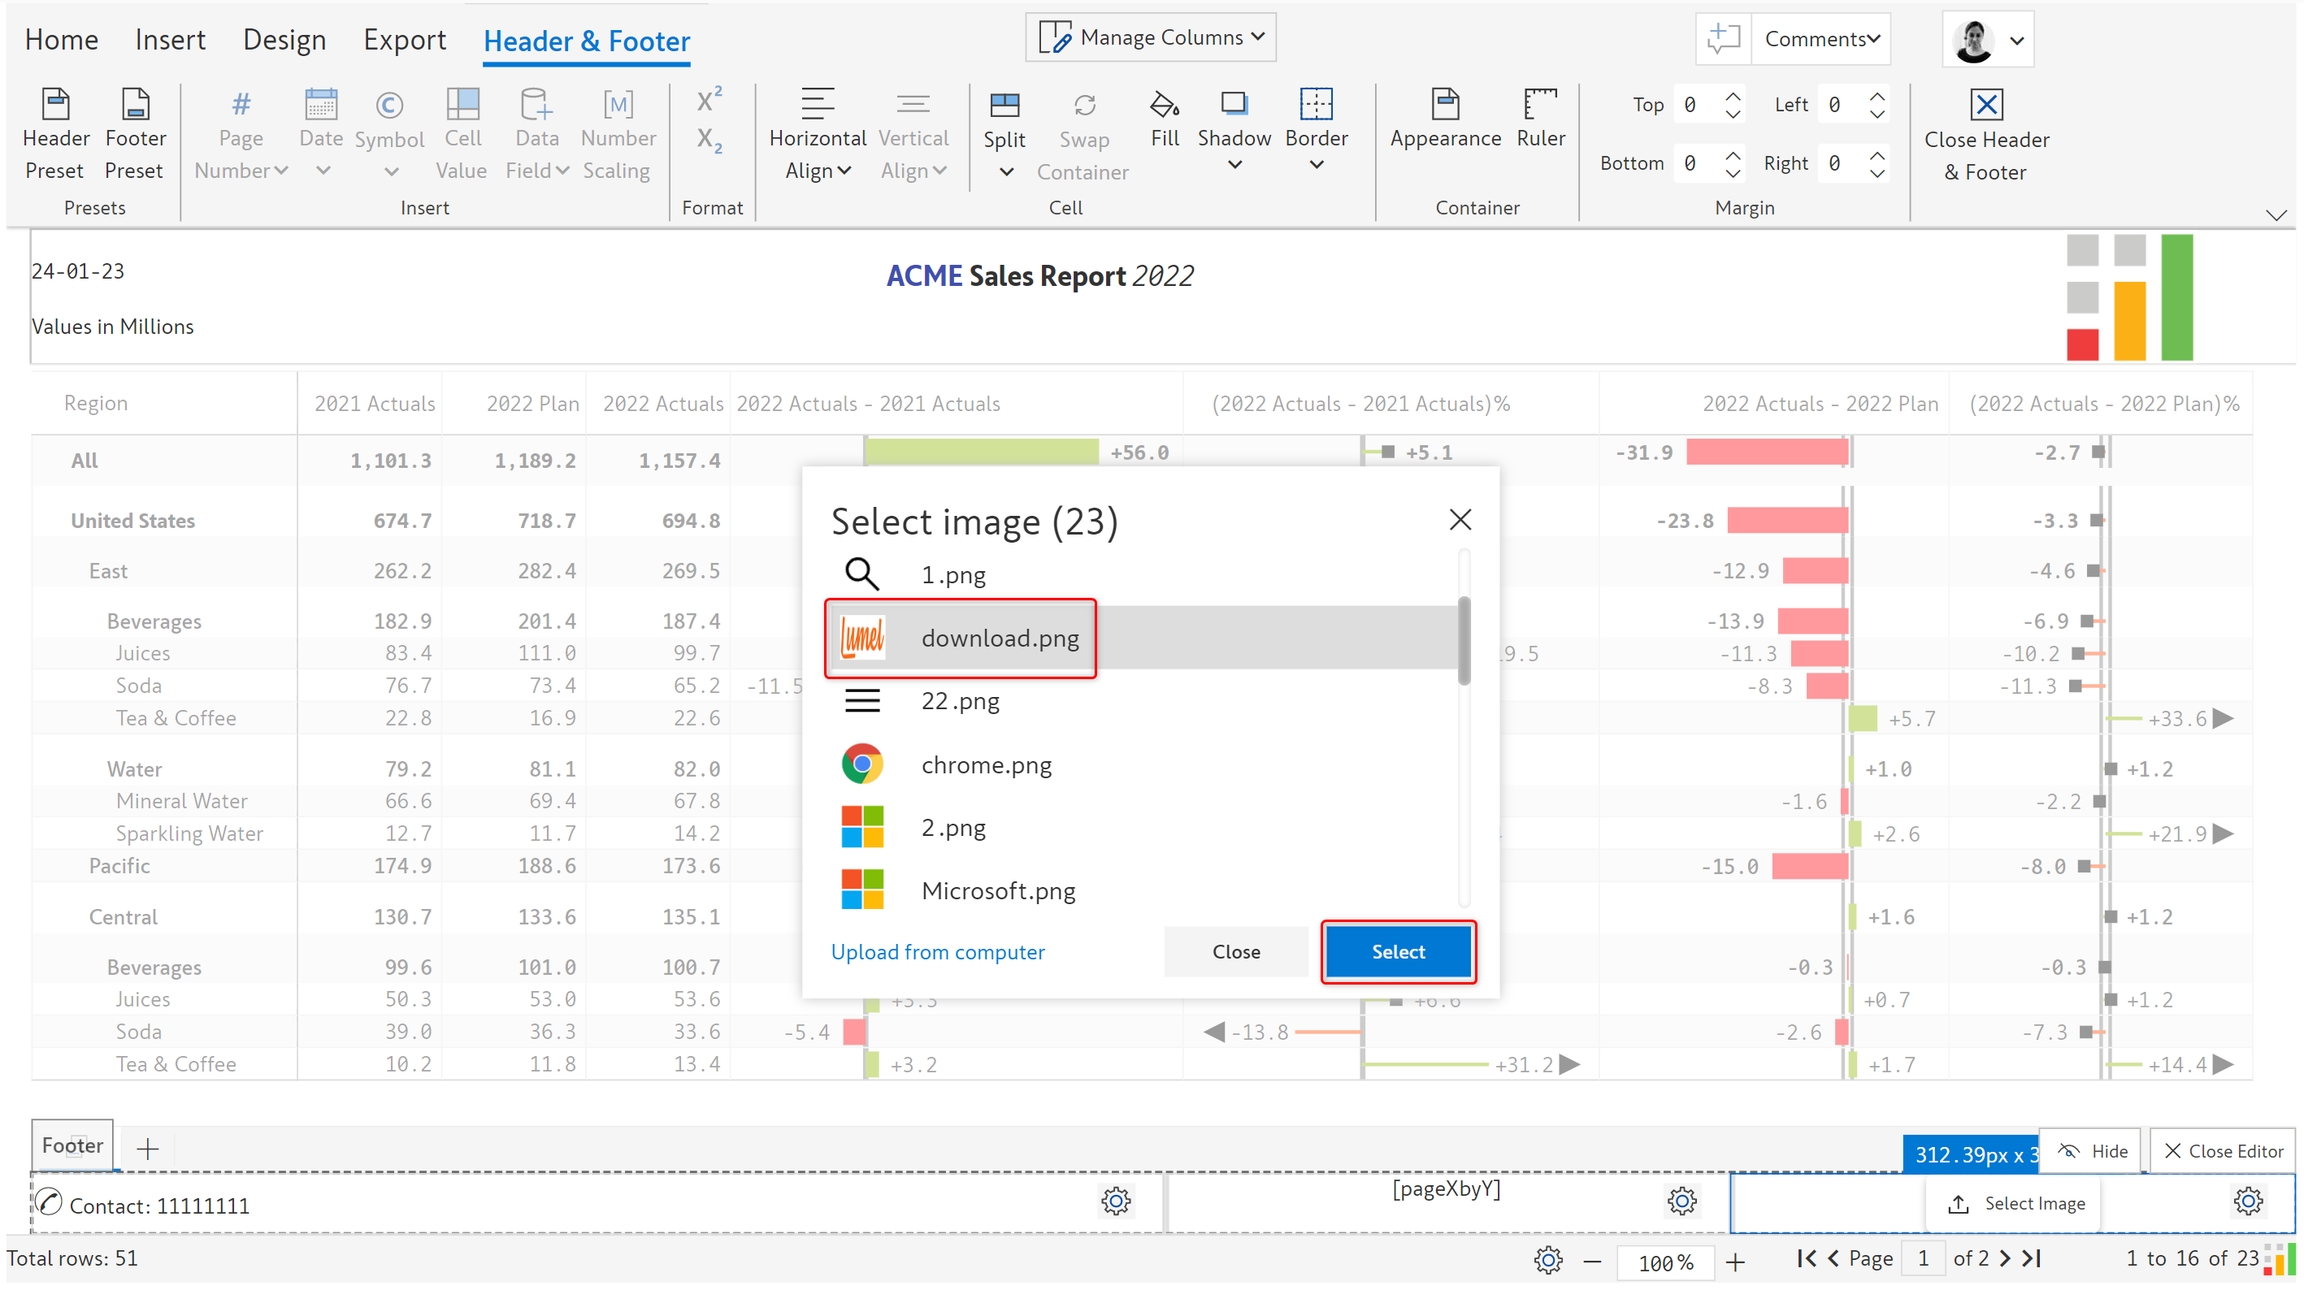
c) The images that are available as part of the workspace assets are listed in the dialog box. Click on the desired image and click 'Select'. Note that you'll also be able to upload files from your computer.

d) The image gets added. Click on 'Close editor'.

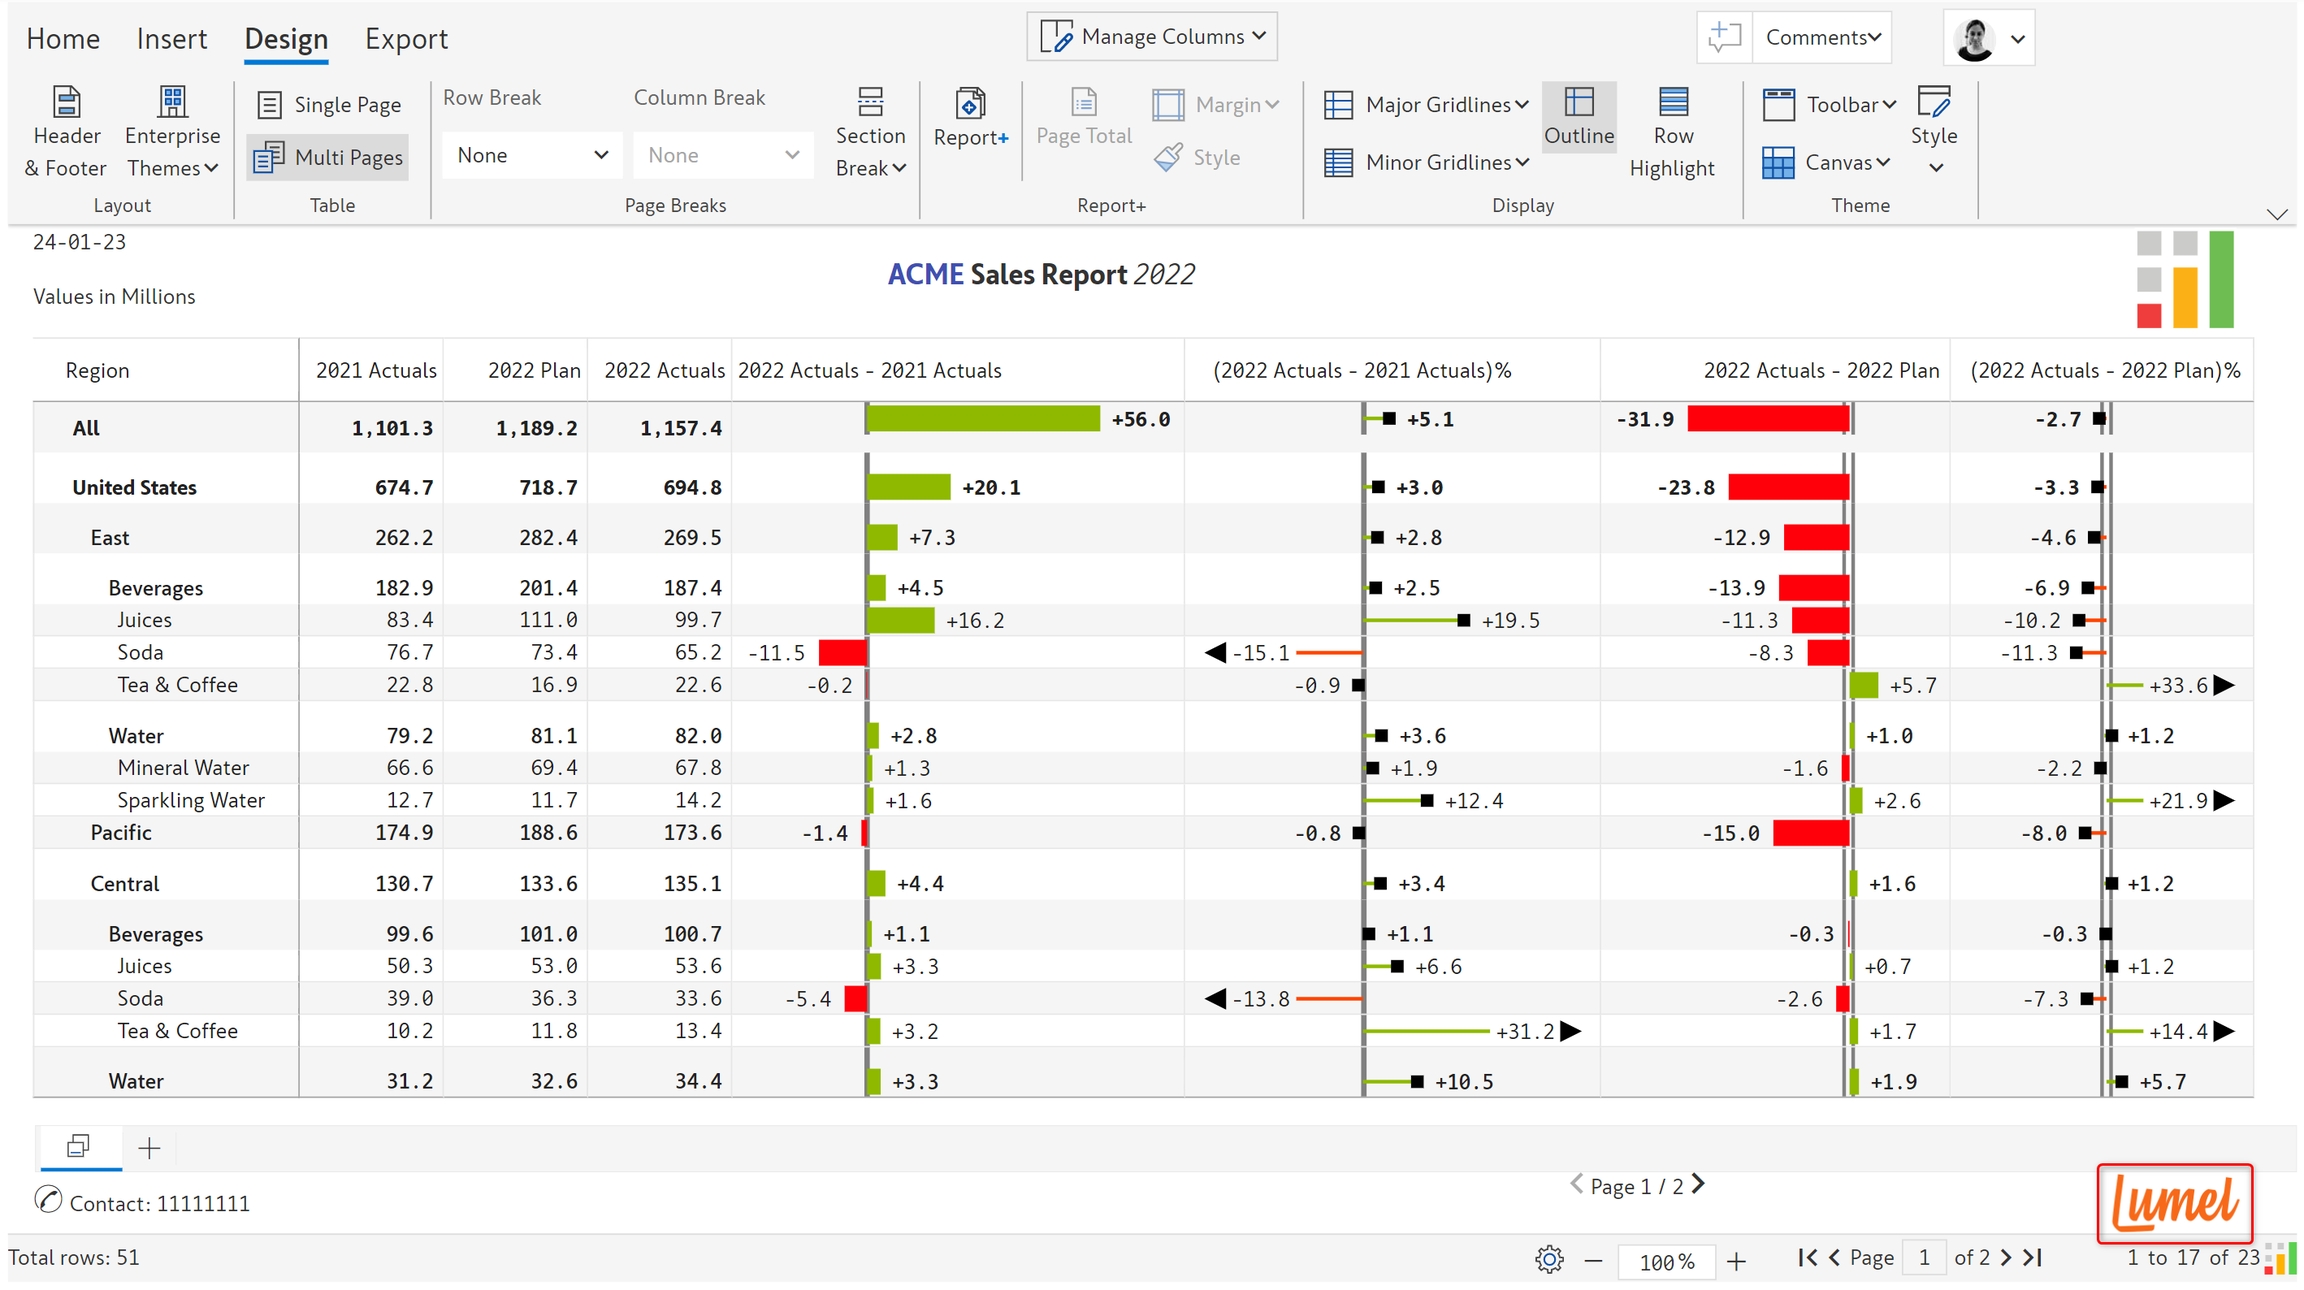
e) The image in read mode is shown below.

In the next section, we'll be looking at inserting in the header/footer.

charts
Admin console
Adding an image
Changing the cell type to Image
Select image option
Uploading image
Uploading a local file
Image added
Replace image option
Save changes
Header in read mode
Upload from workspace
Select image option
Uploading from workspace
Image added
Image in read mode