Inforiver
Premium Table
Premium Table
  • Introduction to Premium Table
    • Get Started
      • Installing from AppSource
      • Installing Inforiver for your organization (Org visual)
      • Inforiver Writeback Matrix pre-requisites
        • Whitelist Inforiver IPs
        • Admin consent for Inforiver's Entra ID
          • Basic consent
          • Full admin consent
      • Inforiver Customer Portal
        • Billing Admin
          • Update Profile
          • Update Subscriptions
        • License Admin
      • Licensing
        • License renewal
      • Registering Inforiver on Azure AD (Entra ID)
  • Working with Premium Table
    • 1. Build your first Inforiver Table report
    • 2. Displaying information
      • Report interface
      • Templates
      • Basic formatting
        • Number formatting
        • Cell, header & value formatting
        • Totals & subtotals
        • Insert blank rows
      • Basic inline charts
    • 3. Basic interactions
      • Explore & filter data
        • Search & Filter
        • Explorer
        • Top N + others
      • Sort & reorder data
      • Show/hide values
      • Manage column widths
      • Manage hierarchies
      • Create visual hierarchies
      • Pin rows & columns
      • Blend measures
      • Dynamic measure headers
      • Context menus
        • Column gripper
        • Row gripper
      • Actions
        • Rails
        • Toolbar options
        • Keyboard shortcuts
        • Reset
    • 4. Adding business logic and formulae
      • Insert calculated rows
        • Template rows
      • Insert calculated columns
      • Insert manual input rows
      • Insert manual input columns
        • Number
        • Dropdown
          • Dropdown options from semantic models
          • Lookup visuals for dropdowns
        • Text, checkbox & date
        • Writeback Matrix features
        • Importing data
      • Invert sign
      • Editing cells
      • Quick formula
      • Visual column inside visual measures
      • Manage inserted rows
      • Manage inserted measures & columns
      • Pivot data
      • Insert image URLs
    • 6. Working with charts
      • Sparkline charts
      • Stacked charts
      • Bullet charts and clustered bar charts
      • Waterfall charts
      • Bar and pin charts
      • Change/deviation charts
    • 5. Conditional formatting
      • One-click options
      • Create rule
        • Rules (If conditions)
        • Color scale & data bars
        • Classification
        • Ranking
      • Manage rules
    • 7. Planning, budgeting & forecasting
      • What-if analysis & simulations
      • Goal Seek
      • Budgeting & allocations
      • Set version
    • 8. Paginated reporting
      • Pagination
      • Header & footer
        • Text
        • Images
        • Charts
        • KPI cards
      • Report layouts (Report+)
      • Display and themes
    • 10. Exporting reports
      • Export to PDF & Excel
        • Excel export - operational boundaries
      • Ad hoc emails
    • 11. Scheduling reports
      • Create new subscription
        • Select a report
        • Set subscription frequency
        • Select destination(s)
          • Email
          • OneDrive
          • Microsoft Teams
          • SharePoint
        • Review & save subscription
      • Manage your subscriptions
      • Administration
    • 12. Data writeback
      • Settings
        • General Settings
        • Data Settings
        • Destination Settings
        • Writeback security settings
        • Writeback time-out & batch size settings
        • Advanced Settings
      • Destinations
        • Azure SQL (Managed DB)
        • Azure SQL
        • Microsoft SQL Server
        • Synapse Dedicated SQL Pool
        • Azure Data Lake Storage
        • Databricks
        • Snowflake
          • Setting up Snowflake OAuth
        • Amazon Redshift
        • BigQuery
        • SingleStore
        • SAP HANA
        • Oracle
        • PostgreSQL
        • MySQL
        • OneDrive
        • SharePoint
        • Dataverse
        • Fabric Warehouse
        • Fabric lakehouse
        • Fabric SQL
        • URL as destination
      • Logs
      • Reading mode
    • 14. Manage aggregation
      • Row aggregation
      • Column aggregation
    • 18. Variables
      • Variable types
        • Number
        • Select
        • Text
        • Date
        • Date range
        • Boolean
        • Button
      • Variable bookmarks
  • Admin Console
    • Manage Profile
    • User management
      • User Roles and Permissions
      • Create custom roles and policies
    • Settings
      • General
      • Generate builds - on prem
      • Forecast
      • Holidays
      • API token
      • Writeback
      • Managed DB
      • Assets
    • Onboarding actions
    • Writeback
  • Display settings
    • General settings
    • Hierarchy settings
    • Number settings
    • Miscellaneous settings
    • On-load scripting
  • Formula syntax
    • Conditional statements
      • IF
      • IFNA
      • SWITCH
      • FILTERIF
    • Logical functions
      • AND
      • IN
      • ISBLANK
      • ISEMPTY
      • ISNUMBER
      • NOT
      • OR
      • XOR
    • Math functions
      • ABS
      • AVERAGE
      • AVERAGEEXNEG
      • AVERAGEEXZERO
      • AVERAGEEXZERONEG
      • AVERAGEIF
      • CEILING
      • COUNT
      • COUNTIF
      • DIVIDE
      • EVEN
      • EXP
      • FLOOR
      • INDEXOF
      • LOG
      • ODD
      • MAX
      • MIN
      • NORMDIST
      • NORMSDIST
      • NORMINV
      • NORMSINV
      • PCT
      • POWER
      • RAND
      • RANDBETWEEN
      • ROUND
      • ROUNDDOWN
      • ROUNDUP
      • MROUND
      • SORT
      • SQRT
      • SUM
      • PMT
    • Text formatting functions
      • CONCATENATE
      • HYPERLINK
      • LEFT
      • LOWER
      • MID
      • PROPER
      • REPLACE
      • REPT
      • RIGHT
      • TEXT
      • TRIM
      • UPPER
      • VALUE
    • Date functions
      • DATEADD
      • DATEDIFF
      • DAY
      • DATE
      • DATE.SET
      • DATE.FORMAT
      • SOWEEK
      • SOMONTH
      • SOQTR
      • SOYEAR
      • EOWEEK
      • EOMONTH
      • EOQTR
      • EOYEAR
      • NETWORKDAYS
      • ADDDAYS
      • ADDWEEKS
      • ADDMONTHS
      • ADDQTRS
      • ADDYEARS
      • FROMEXCELDATE
      • MONTH
      • NOW
      • PERIOD_RANGE
      • TODAY
      • TOEXCELDATE
      • YEAR
    • Time intelligence functions
      • AGGREGATE
      • FILTER
      • COLUMN_PERIOD
      • LASTNDAY
      • LASTNMONTH
      • LASTNQTR
      • LASTNYEAR
      • MONTHPERIOD
      • MOVINGAVERAGE
      • MOVINGSUM
      • MTD
      • NEXTNDAY
      • NEXTNMONTH
      • NEXTNQTR
      • NEXTNYEAR
      • QTD
      • QTRPERIOD
      • SHIFT
      • TOTALYTD
      • TOTALQTD
      • TOTALMTD
      • VALUEAT
      • YEARPERIOD
      • YTD
    • Other operators
    • Identifiers
      • CLOSEDPERIOD
      • COLUMN.DATE
      • COLUMN.PARENT
      • COLUMNS
      • CURRENT_PERIOD
      • DESCENDANTS
      • FORECAST.CLOSED_END
      • FORECAST.CLOSED_START
      • FORECAST.OPEN_END
      • FORECAST.OPEN_START
      • GROUP INDEX
      • HAS
      • HAS_ALL
      • HAS_SOME
      • LEAVES
      • LEVEL
      • LOGGEDIN_EMAIL
      • LOGGEDIN_NAME
      • MATCH
      • MAXDATE
      • MEMBERS
      • MINDATE
      • RELATIVE
      • RELATIVE_COLUMN
      • ROW.PARENT
      • ROW.LABEL
    • Scripting functions
      • DISPLAYTOAST
      • EXPORT
      • LAYOUT
      • SETCFRULE
      • SETFILTER
      • SETFILTERBYINDEX
      • SETVISIBILITY
      • SHOWBETWEENPERIOD
      • SHOWCLOSEDFORECAST
      • TOPN
      • DISPLAY SETTINGS
        • SETBLANKLABEL
        • SETSUPPRESSZEROS
        • SETRAGGEDHIERARCHY
        • SEPARATOR
        • SETCOMBINECOLUMNHEADER
        • SEMANTICFORMAT
        • SHOWNULLAS
        • SHOWZEROAS
        • SINGLECHILD
    • Statistical Functions
      • RANK
      • RANKEQ
      • RANKAVG
    • Miscellaneous functions
      • FETCH
      • LOOKUP
    • Measure/Column selection functions
      • GETCOLBETWEENPERIODS
      • GETMEASURE
  • Advanced topics
    • Audit log
    • Backup & restore report config
    • Enterprise themes
    • PowerPoint integration
    • Drill down and roll up in performance mode
  • Accessibility shortcut keys
Powered by GitBook
On this page
  • 1. Cell level
  • 2. Row header level
  • 3. Measure level
  • 4. Sign from a source table
  1. Working with Premium Table
  2. 4. Adding business logic and formulae

Invert sign

PreviousImporting dataNextEditing cells

In the case of financial reports such as the P&L statement, data for expense or deduction items are often shown as positive numbers. This is especially true when the income and expense values come from different tables. However, the report might need to be updated with the negative sign operator for two main purposes.

(a) for performing aggregations, say for naturally aggregating revenue & expense accounts to calculate profit, or

(b) to display +/- signs in the table to indicate which accounts are added vs. deducted.

This can be easily achieved using the 'Invert' option in Inforiver.

1. Cell level

You can invert cells or rows and display the negative signs at a cell level. You can also define whether the negative signs should influence the total or not.

Let’s invert the 'Beverages' row in the 'East' subregion.

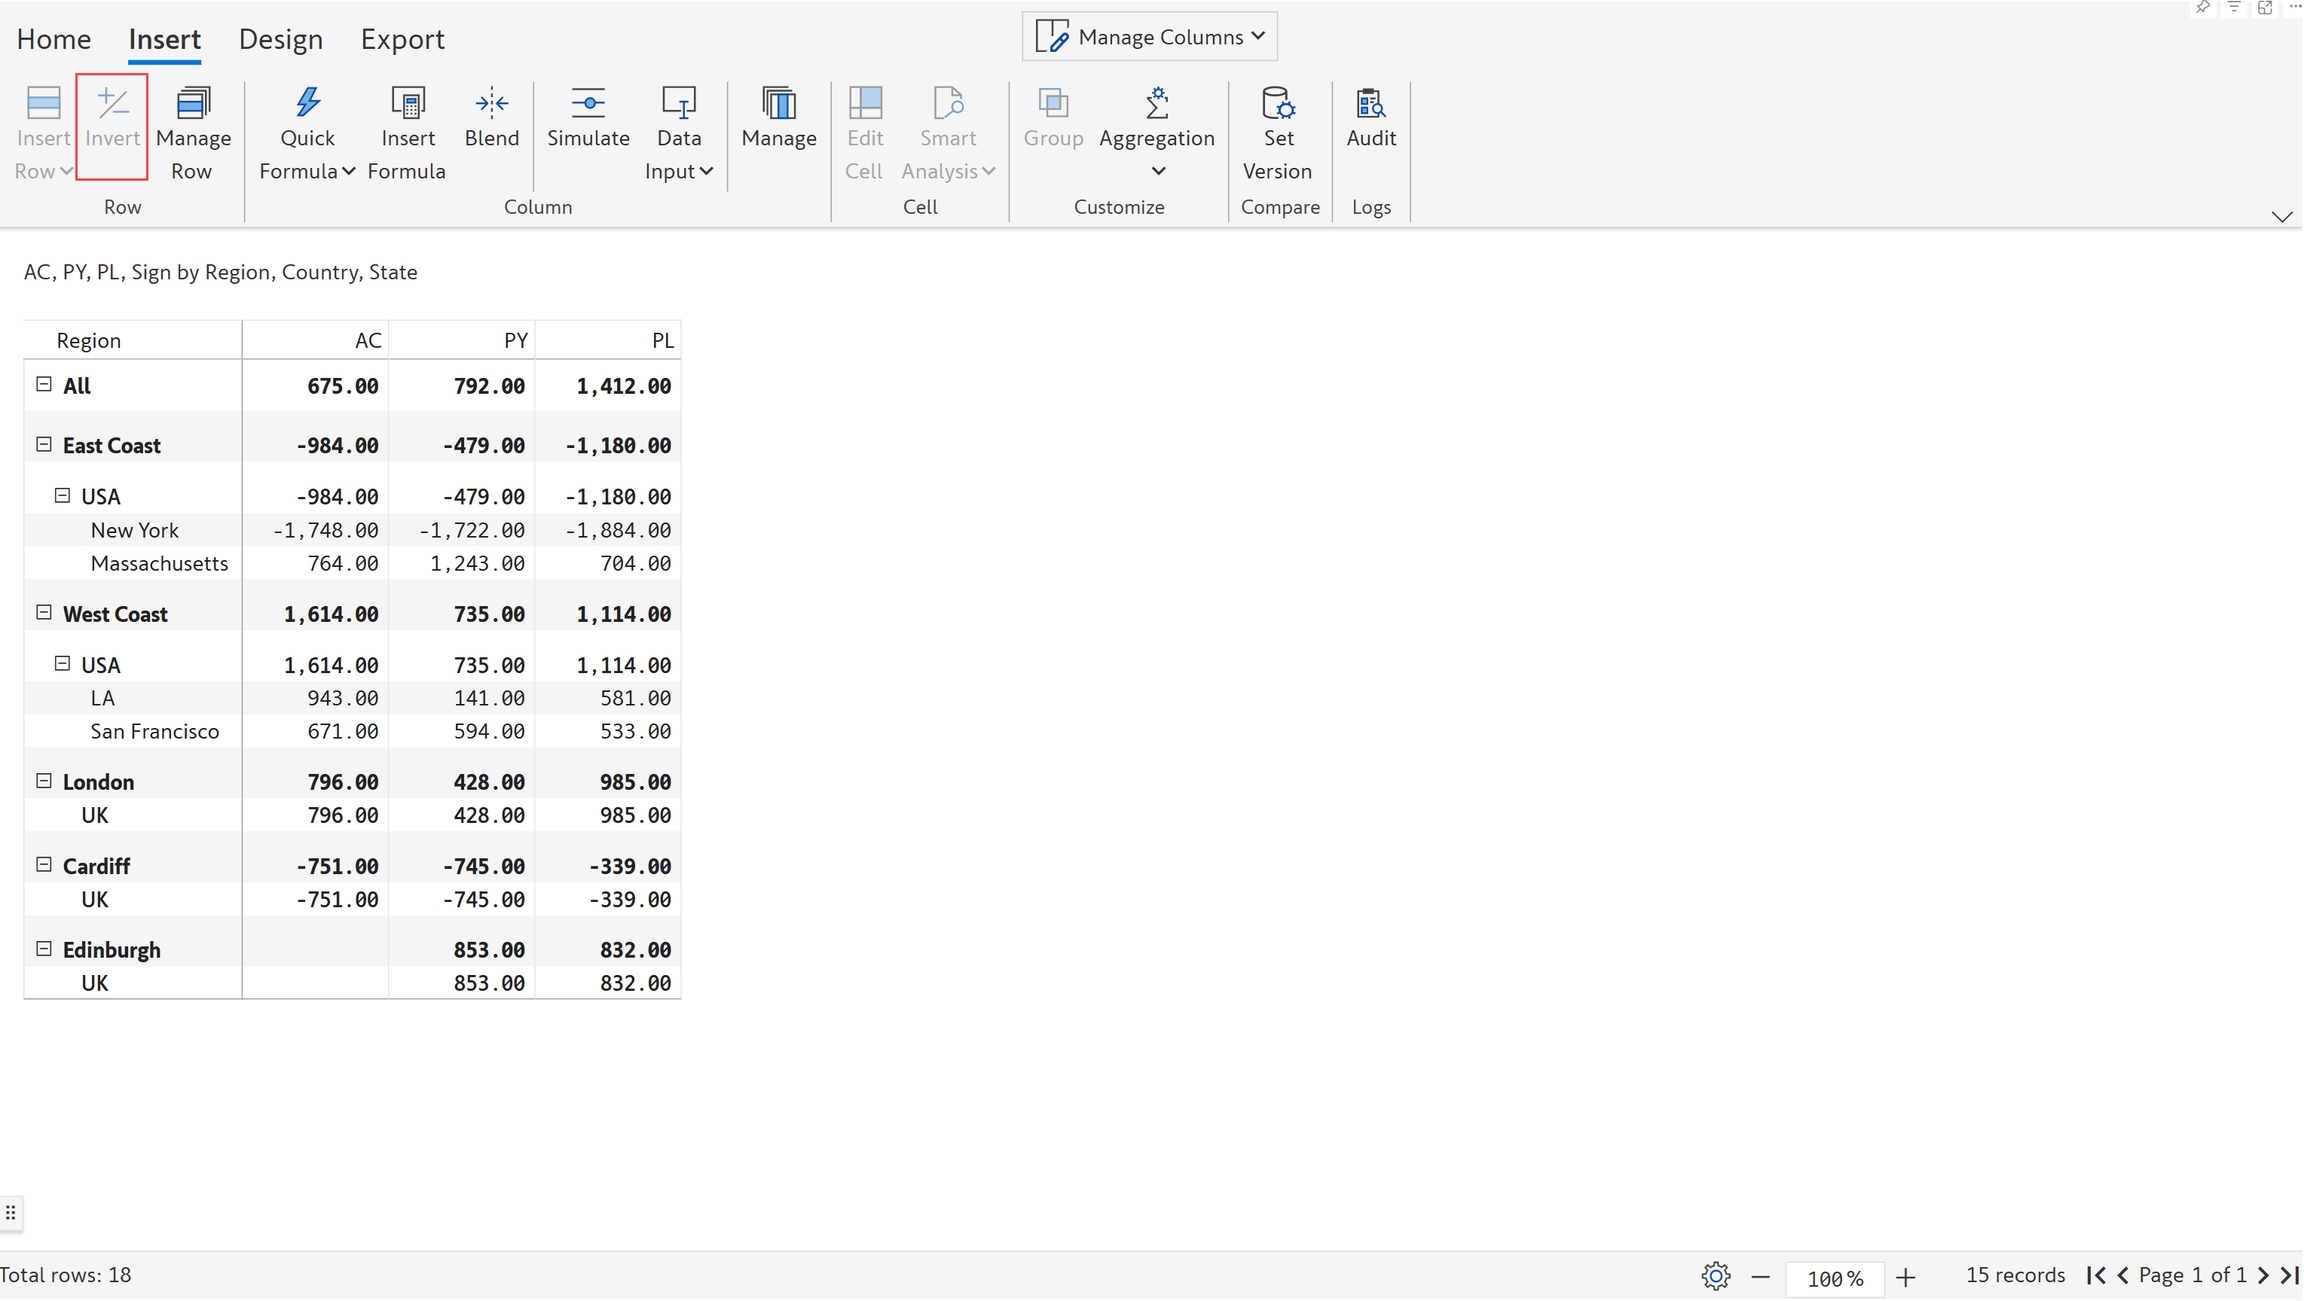
a) Select the required row. In the ‘Insert’ tab of the toolbar, click the ‘Invert’ option.

b) The row 'East -> Beverages' is inverted and you can see the change in the value of totals.

c) If you do not want the sign inversion to impact the totals, turn off the 'Include in Total' toggle in the Display -> Numbers settings.

d) Click ‘Invert’ again with the respective row selected to reset to the default value.

e) A pop-up opens with a message as shown, select ‘Apply’ to reset.

f) You can now see the original values in the Beverages row and the totals.

g) Instead of inverting the sign of the child nodes individually, you can do it in bulk at the parent level. Let's invert the 'United States' parent row, select the row and apply 'Invert'.

h) You can see that parent and the corresponding child rows are inverted as shown.

i) Note that the signage of calculated rows cannot be changed. In the below image, you can see the 'Invert' option is disabled for the calculated row 'Sum'.

2. Row header level

Sign inversion can be shown at the row header level with the ‘Sign in headers’ option.

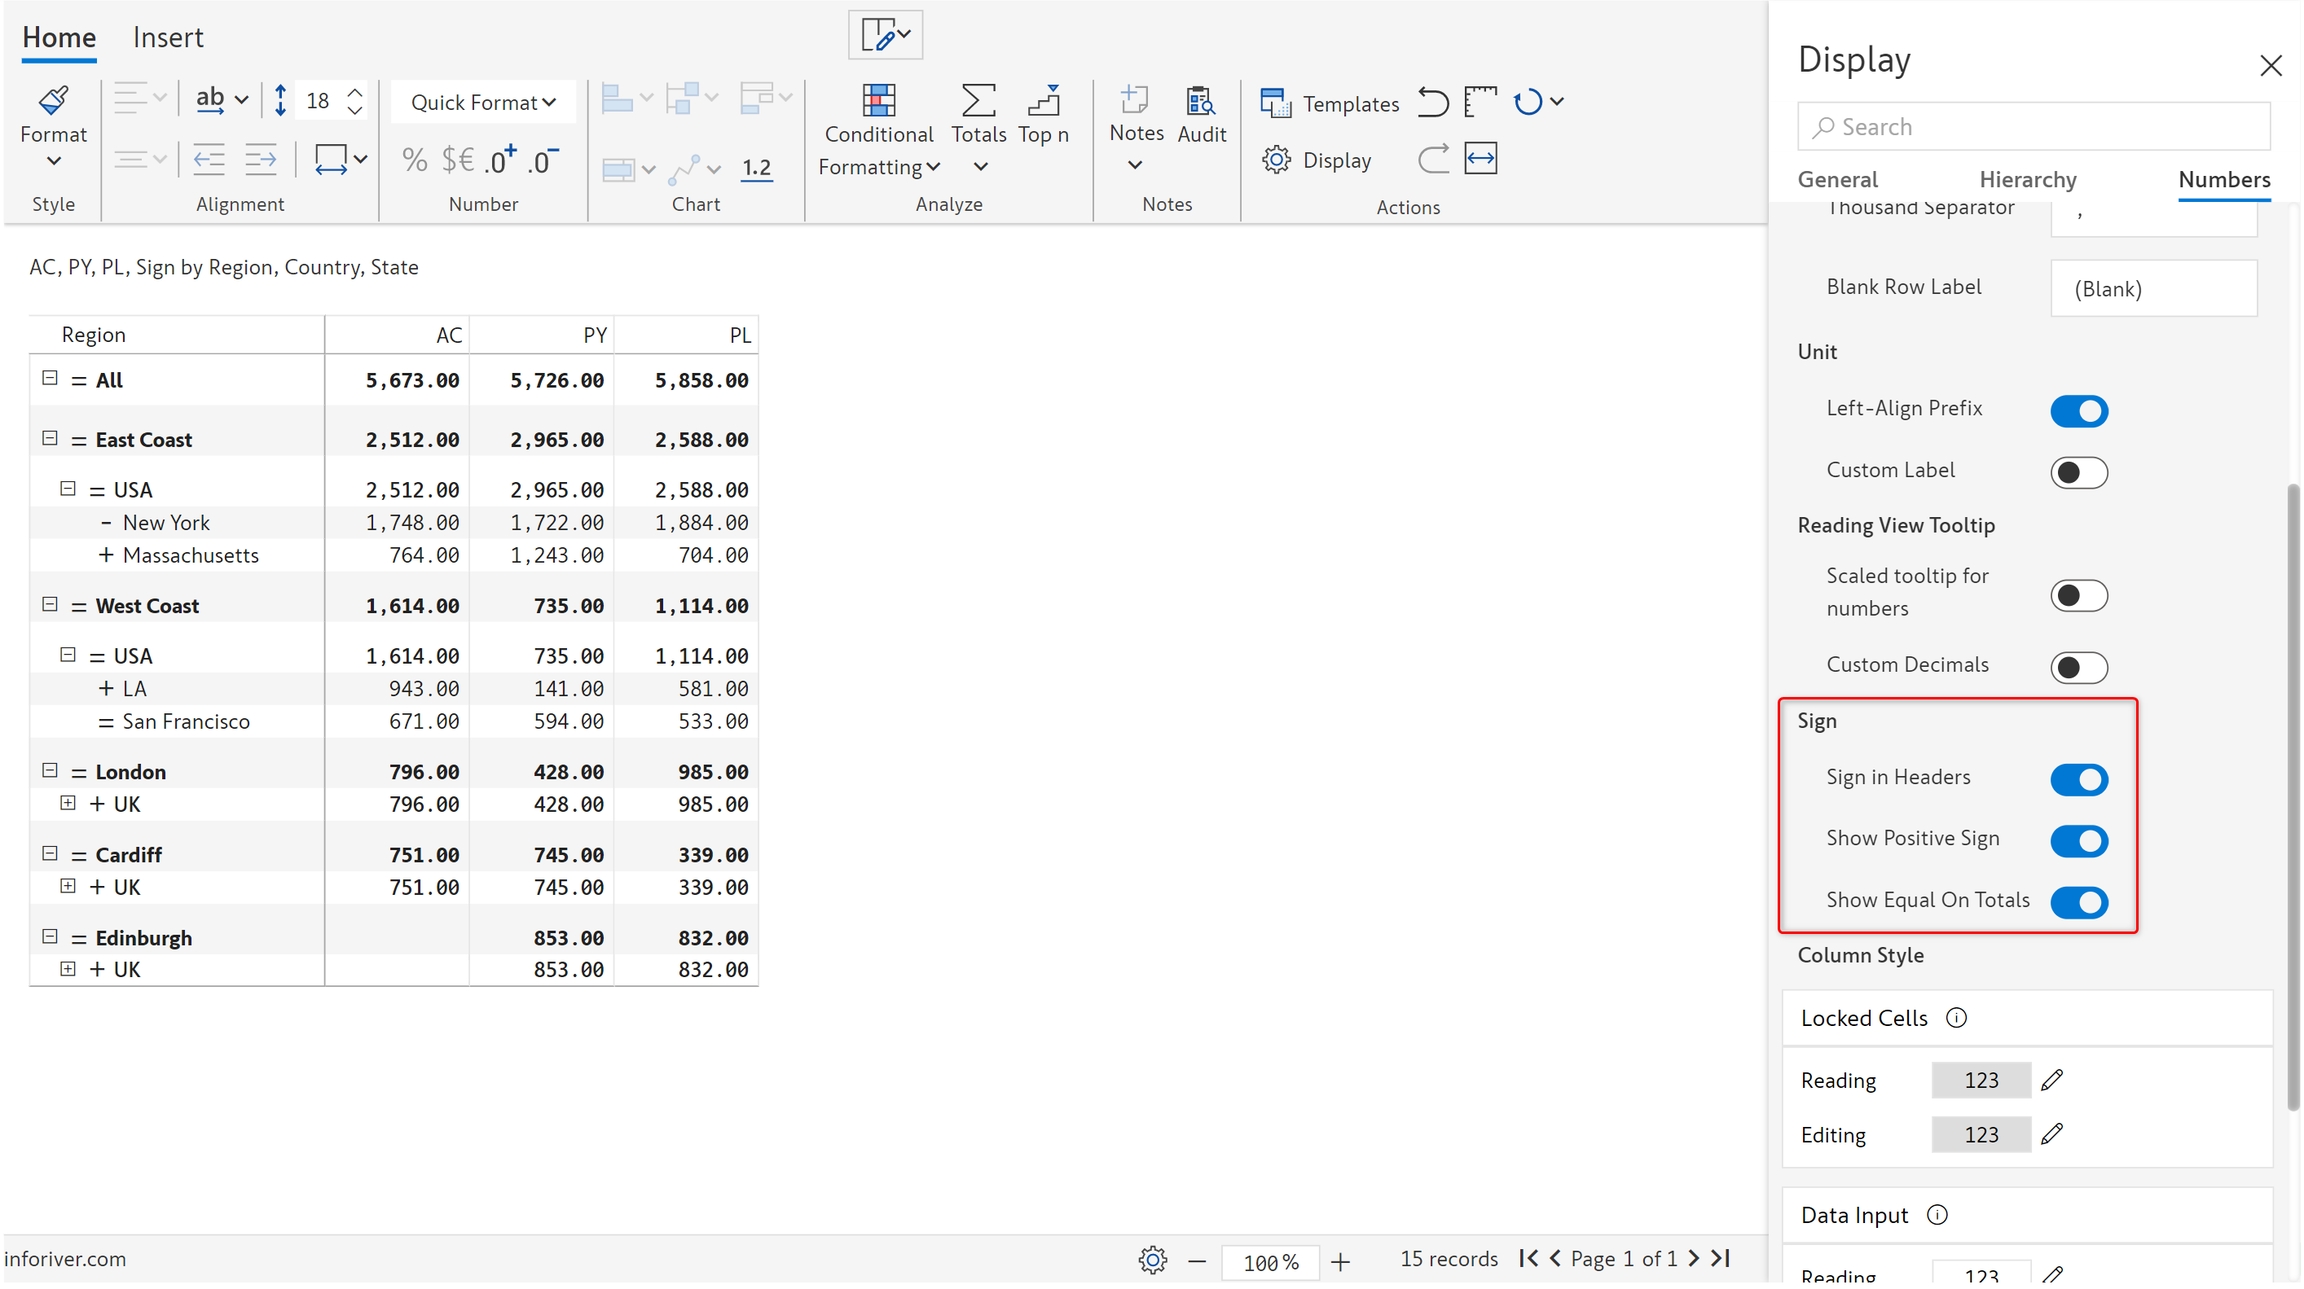
a) In the ‘Home’ tab of the toolbar, click ‘Display’ -> 'Numbers'.

b) Turn on ‘Sign in headers’ to display the signage in the row headers as shown.

c) You can also show positive signs and equals on other data source rows and total rows by enabling the 'Show positive sign' and 'Show equals on totals' options respectively.

3. Measure level

a) Create a new signed measure

This feature is a single-click solution to creating signed measures. To invert a particular measure, select it and click on the 'Invert' button in the Insert ribbon.

Click on Create to insert the new calculated measure in the report.

b) Invert sign for individual measures

You can change the sign for a single measure at both child and parent levels. For a given row, select any cell and click on the ‘Invert’ button. Notice how the sign for the Discount measure has been flipped in the example below.

When hierarchical data is involved, you can also change the sign for a particular measure at the parent level, this will be cascaded to all the child rows.

4. Sign from a source table

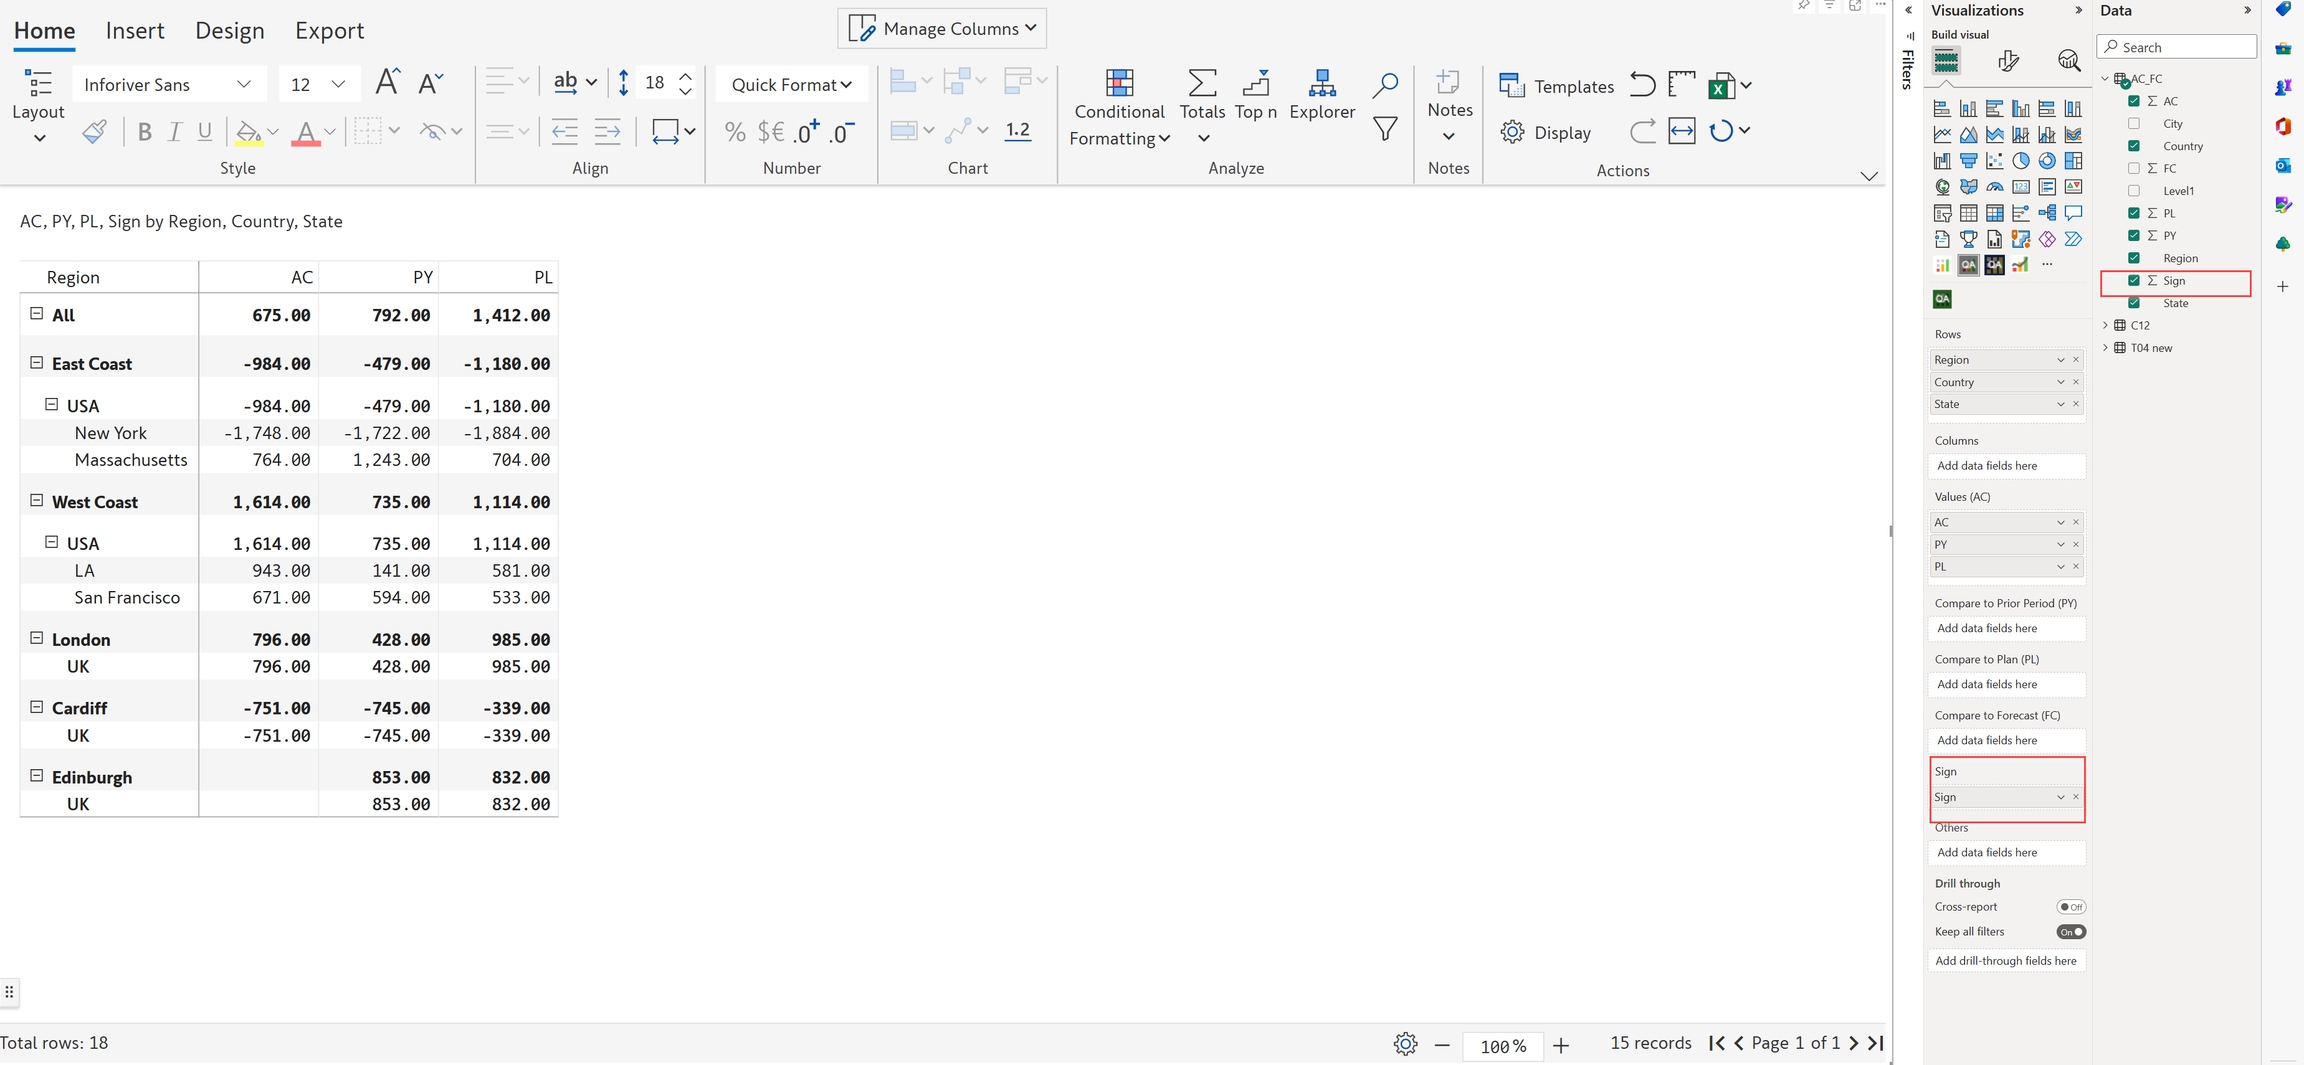
Instead of defining positive and negative signs at the report level, you can use the sign conventions from your data source tables. To do this, create a column that assigns values -1, +1, and 0 for negative, positive, and totals respectively. A sample table is shown below.

a) Add this sign column in the 'Sign' field. You can see the change in the values in the below image and also the calculation of subtotals and totals.

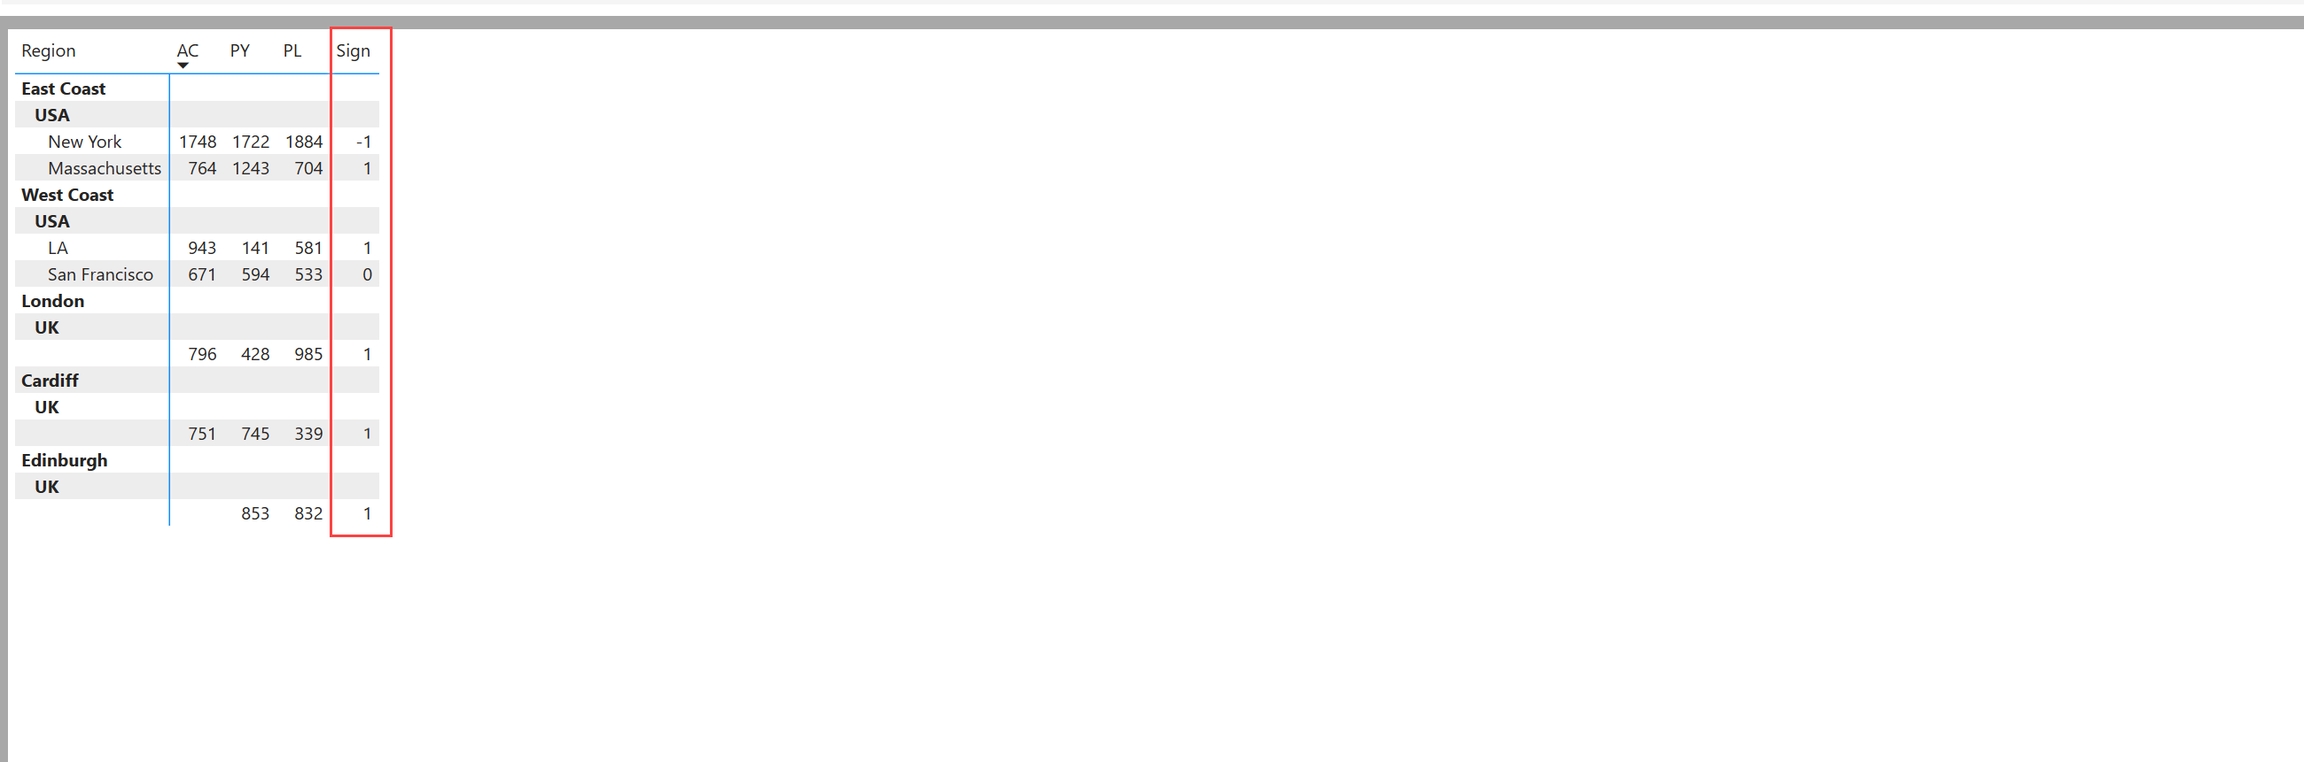
b) On enabling the 'Sign in header' option, you can see the positive, negative, and total rows with the signs in the header.

c) The 'Invert' option is disabled when the sign column is added.

When a sign field is added, you cannot add column fields.

Resources

In the next section, we'll be covering the feature.

Audit log
Invert signs for reporting in Microsoft Power BI with Scenarios
Invert sign
Result
Include in total
Reset inversion
Pop-up message
Reset to default
Invert sign at parent level
Result
Calculated row
Number settings
Sign in headers
Show positive & equals
Invert measure
Inverted measure created in the report
Invert sign
Invert measure for parent rows
Sign table
Sign measure
Sign in headers
Invert disabled