Inforiver
Premium Table
Premium Table
  • Introduction to Premium Table
    • Get Started
      • Installing from AppSource
      • Installing Inforiver for your organization (Org visual)
      • Inforiver Writeback Matrix pre-requisites
        • Whitelist Inforiver IPs
        • Admin consent for Inforiver's Entra ID
          • Basic consent
          • Full admin consent
      • Inforiver Customer Portal
        • Billing Admin
          • Update Profile
          • Update Subscriptions
        • License Admin
      • Licensing
        • License renewal
      • Registering Inforiver on Azure AD (Entra ID)
  • Working with Premium Table
    • 1. Build your first Inforiver Table report
    • 2. Displaying information
      • Report interface
      • Templates
      • Basic formatting
        • Number formatting
        • Cell, header & value formatting
        • Totals & subtotals
        • Insert blank rows
      • Basic inline charts
    • 3. Basic interactions
      • Explore & filter data
        • Search & Filter
        • Explorer
        • Top N + others
      • Sort & reorder data
      • Show/hide values
      • Manage column widths
      • Manage hierarchies
      • Create visual hierarchies
      • Pin rows & columns
      • Blend measures
      • Dynamic measure headers
      • Context menus
        • Column gripper
        • Row gripper
      • Actions
        • Rails
        • Toolbar options
        • Keyboard shortcuts
        • Reset
    • 4. Adding business logic and formulae
      • Insert calculated rows
        • Template rows
      • Insert calculated columns
      • Insert manual input rows
      • Insert manual input columns
        • Number
        • Dropdown
          • Dropdown options from semantic models
          • Lookup visuals for dropdowns
        • Text, checkbox & date
        • Writeback Matrix features
        • Importing data
      • Invert sign
      • Editing cells
      • Quick formula
      • Visual column inside visual measures
      • Manage inserted rows
      • Manage inserted measures & columns
      • Pivot data
      • Insert image URLs
    • 6. Working with charts
      • Sparkline charts
      • Stacked charts
      • Bullet charts and clustered bar charts
      • Waterfall charts
      • Bar and pin charts
      • Change/deviation charts
    • 5. Conditional formatting
      • One-click options
      • Create rule
        • Rules (If conditions)
        • Color scale & data bars
        • Classification
        • Ranking
      • Manage rules
    • 7. Planning, budgeting & forecasting
      • What-if analysis & simulations
      • Goal Seek
      • Budgeting & allocations
      • Set version
    • 8. Paginated reporting
      • Pagination
      • Header & footer
        • Text
        • Images
        • Charts
        • KPI cards
      • Report layouts (Report+)
      • Display and themes
    • 10. Exporting reports
      • Export to PDF & Excel
        • Excel export - operational boundaries
      • Ad hoc emails
    • 11. Scheduling reports
      • Create new subscription
        • Select a report
        • Set subscription frequency
        • Select destination(s)
          • Email
          • OneDrive
          • Microsoft Teams
          • SharePoint
        • Review & save subscription
      • Manage your subscriptions
      • Administration
    • 12. Data writeback
      • Settings
        • General Settings
        • Data Settings
        • Destination Settings
        • Writeback security settings
        • Writeback time-out & batch size settings
        • Advanced Settings
      • Destinations
        • Azure SQL (Managed DB)
        • Azure SQL
        • Microsoft SQL Server
        • Synapse Dedicated SQL Pool
        • Azure Data Lake Storage
        • Databricks
        • Snowflake
          • Setting up Snowflake OAuth
        • Amazon Redshift
        • BigQuery
        • SingleStore
        • SAP HANA
        • Oracle
        • PostgreSQL
        • MySQL
        • OneDrive
        • SharePoint
        • Dataverse
        • Fabric Warehouse
        • Fabric lakehouse
        • Fabric SQL
        • URL as destination
      • Logs
      • Reading mode
    • 14. Manage aggregation
      • Row aggregation
      • Column aggregation
    • 18. Variables
      • Variable types
        • Number
        • Select
        • Text
        • Date
        • Date range
        • Boolean
        • Button
      • Variable bookmarks
  • Admin Console
    • Manage Profile
    • User management
      • User Roles and Permissions
      • Create custom roles and policies
    • Settings
      • General
      • Generate builds - on prem
      • Forecast
      • Holidays
      • API token
      • Writeback
      • Managed DB
      • Assets
    • Onboarding actions
    • Writeback
  • Display settings
    • General settings
    • Hierarchy settings
    • Number settings
    • Miscellaneous settings
    • On-load scripting
  • Formula syntax
    • Conditional statements
      • IF
      • IFNA
      • SWITCH
      • FILTERIF
    • Logical functions
      • AND
      • IN
      • ISBLANK
      • ISEMPTY
      • ISNUMBER
      • NOT
      • OR
      • XOR
    • Math functions
      • ABS
      • AVERAGE
      • AVERAGEEXNEG
      • AVERAGEEXZERO
      • AVERAGEEXZERONEG
      • AVERAGEIF
      • CEILING
      • COUNT
      • COUNTIF
      • DIVIDE
      • EVEN
      • EXP
      • FLOOR
      • INDEXOF
      • LOG
      • ODD
      • MAX
      • MIN
      • NORMDIST
      • NORMSDIST
      • NORMINV
      • NORMSINV
      • PCT
      • POWER
      • RAND
      • RANDBETWEEN
      • ROUND
      • ROUNDDOWN
      • ROUNDUP
      • MROUND
      • SORT
      • SQRT
      • SUM
      • PMT
    • Text formatting functions
      • CONCATENATE
      • HYPERLINK
      • LEFT
      • LOWER
      • MID
      • PROPER
      • REPLACE
      • REPT
      • RIGHT
      • TEXT
      • TRIM
      • UPPER
      • VALUE
    • Date functions
      • DATEADD
      • DATEDIFF
      • DAY
      • DATE
      • DATE.SET
      • DATE.FORMAT
      • SOWEEK
      • SOMONTH
      • SOQTR
      • SOYEAR
      • EOWEEK
      • EOMONTH
      • EOQTR
      • EOYEAR
      • NETWORKDAYS
      • ADDDAYS
      • ADDWEEKS
      • ADDMONTHS
      • ADDQTRS
      • ADDYEARS
      • FROMEXCELDATE
      • MONTH
      • NOW
      • PERIOD_RANGE
      • TODAY
      • TOEXCELDATE
      • YEAR
    • Time intelligence functions
      • AGGREGATE
      • FILTER
      • COLUMN_PERIOD
      • LASTNDAY
      • LASTNMONTH
      • LASTNQTR
      • LASTNYEAR
      • MONTHPERIOD
      • MOVINGAVERAGE
      • MOVINGSUM
      • MTD
      • NEXTNDAY
      • NEXTNMONTH
      • NEXTNQTR
      • NEXTNYEAR
      • QTD
      • QTRPERIOD
      • SHIFT
      • TOTALYTD
      • TOTALQTD
      • TOTALMTD
      • VALUEAT
      • YEARPERIOD
      • YTD
    • Other operators
    • Identifiers
      • CLOSEDPERIOD
      • COLUMN.DATE
      • COLUMN.PARENT
      • COLUMNS
      • CURRENT_PERIOD
      • DESCENDANTS
      • FORECAST.CLOSED_END
      • FORECAST.CLOSED_START
      • FORECAST.OPEN_END
      • FORECAST.OPEN_START
      • GROUP INDEX
      • HAS
      • HAS_ALL
      • HAS_SOME
      • LEAVES
      • LEVEL
      • LOGGEDIN_EMAIL
      • LOGGEDIN_NAME
      • MATCH
      • MAXDATE
      • MEMBERS
      • MINDATE
      • RELATIVE
      • RELATIVE_COLUMN
      • ROW.PARENT
      • ROW.LABEL
    • Scripting functions
      • DISPLAYTOAST
      • EXPORT
      • LAYOUT
      • SETCFRULE
      • SETFILTER
      • SETFILTERBYINDEX
      • SETVISIBILITY
      • SHOWBETWEENPERIOD
      • SHOWCLOSEDFORECAST
      • TOPN
      • DISPLAY SETTINGS
        • SETBLANKLABEL
        • SETSUPPRESSZEROS
        • SETRAGGEDHIERARCHY
        • SEPARATOR
        • SETCOMBINECOLUMNHEADER
        • SEMANTICFORMAT
        • SHOWNULLAS
        • SHOWZEROAS
        • SINGLECHILD
    • Statistical Functions
      • RANK
      • RANKEQ
      • RANKAVG
    • Miscellaneous functions
      • FETCH
      • LOOKUP
    • Measure/Column selection functions
      • GETCOLBETWEENPERIODS
      • GETMEASURE
  • Advanced topics
    • Audit log
    • Backup & restore report config
    • Enterprise themes
    • PowerPoint integration
    • Drill down and roll up in performance mode
  • Accessibility shortcut keys
Powered by GitBook
On this page
  1. Working with Premium Table
  2. 5. Conditional formatting
  3. Create rule

Ranking

PreviousClassificationNextManage rules

One common use of conditional formatting is to highlight the top/bottom N ranked items in a report, which can help to quickly identify the most important or relevant items in the data.

Refer to to get started. Once the rule is created and you can see the 'Conditional formatting' side panel, follow the below steps.

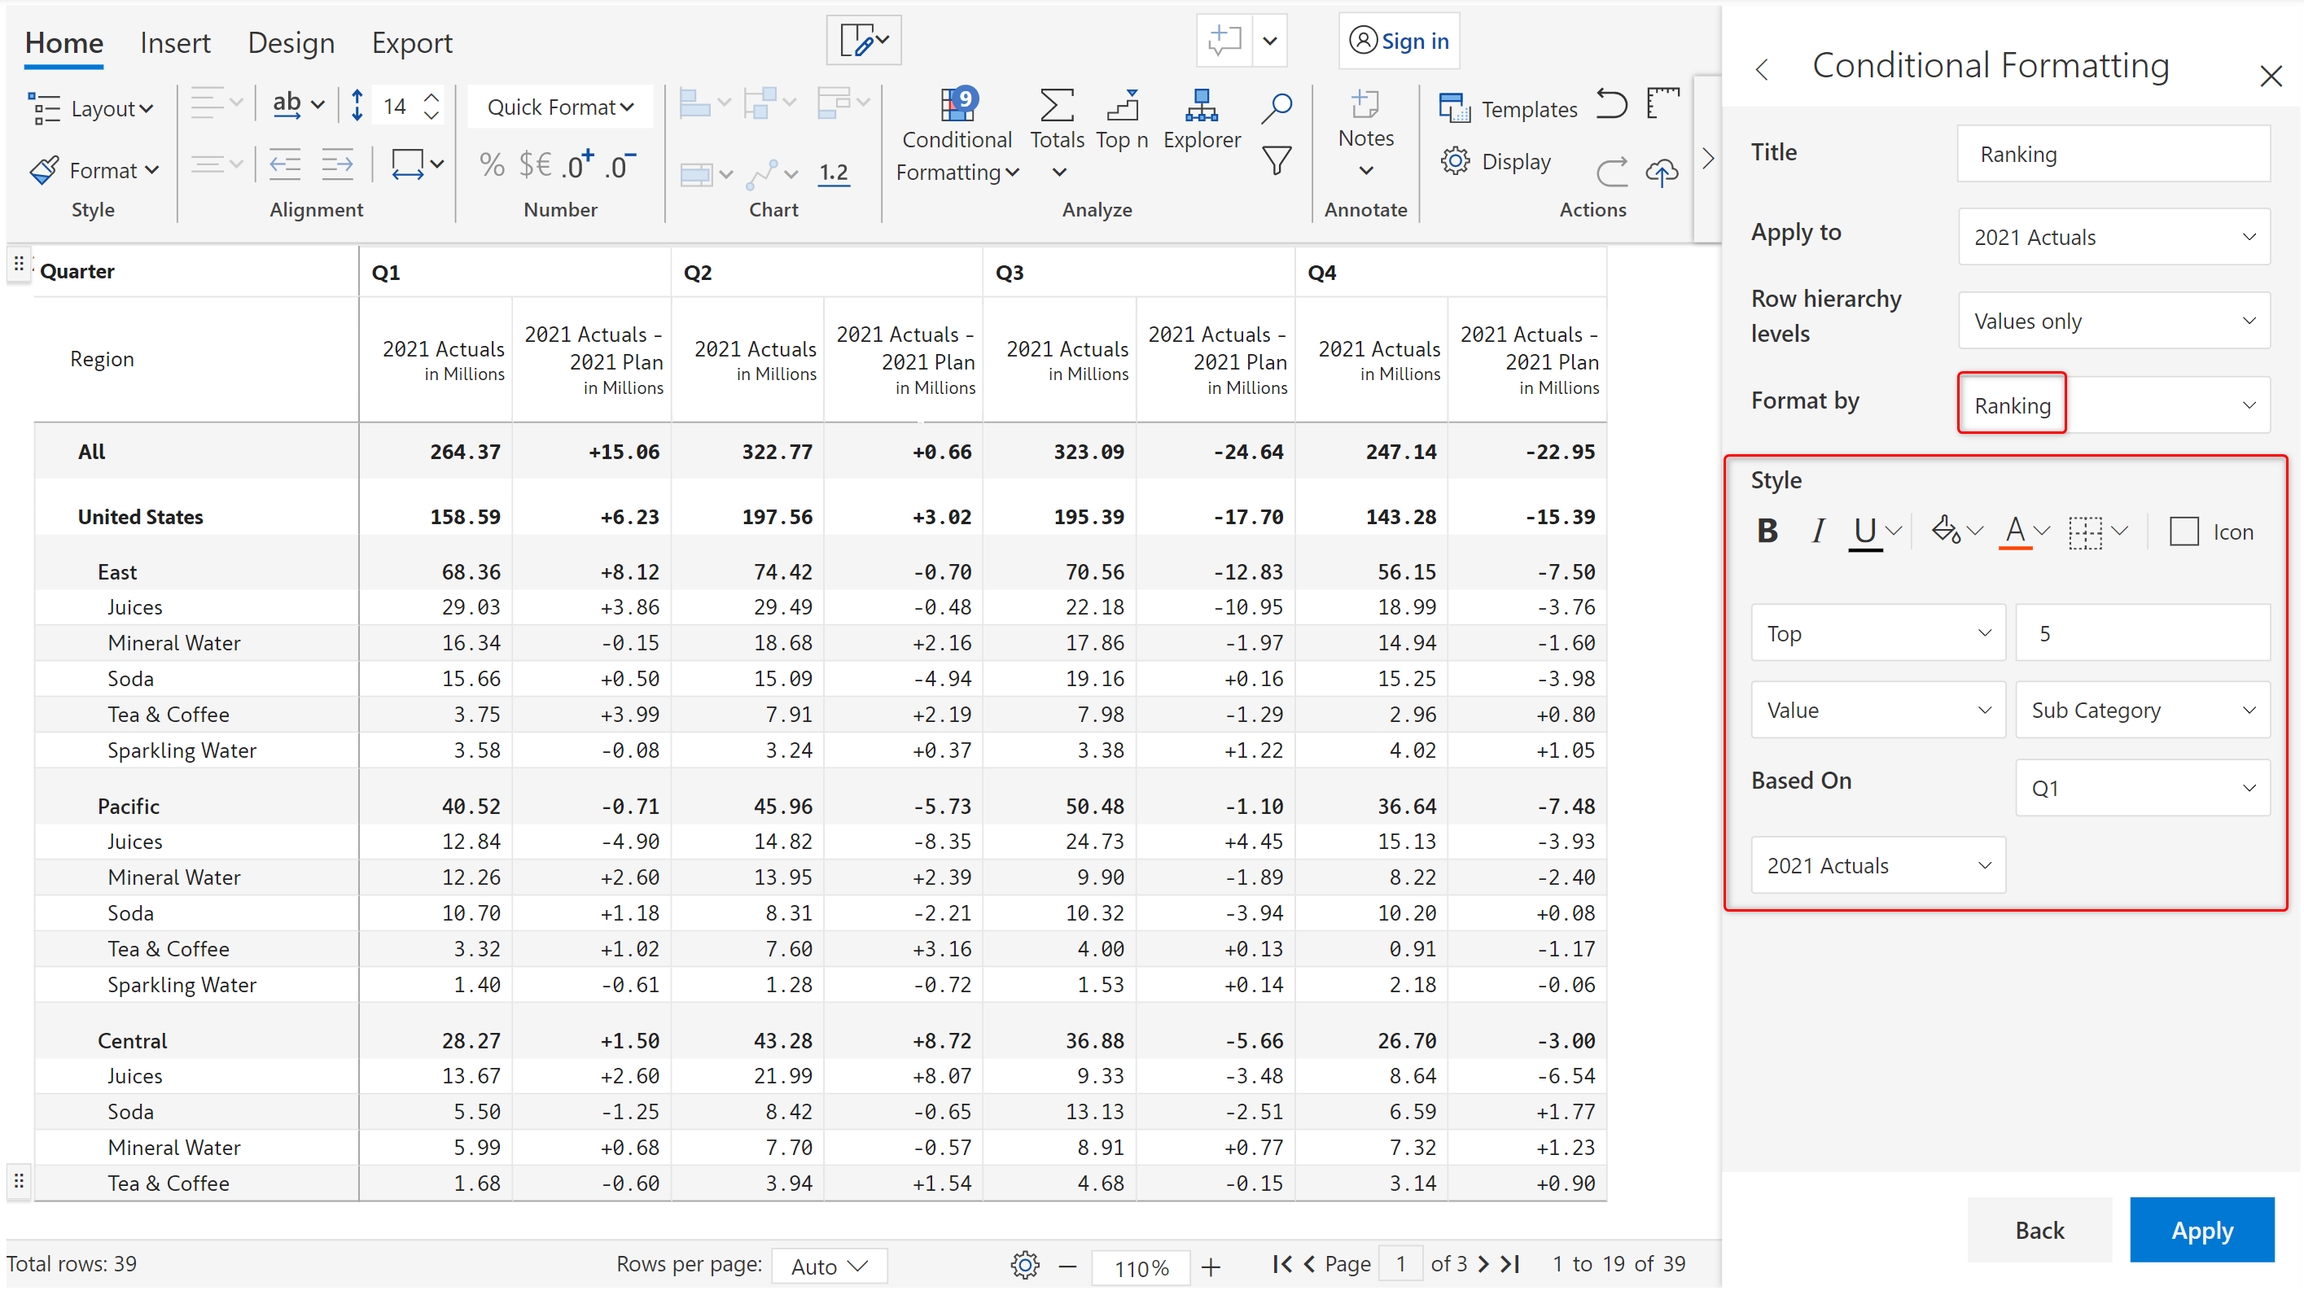
Choose 'Ranking' in the 'Format by' dropdown. You can see the options shown in the below image. Using the 'Style' section, you can format text based on color/style, apply a background color or select icons.

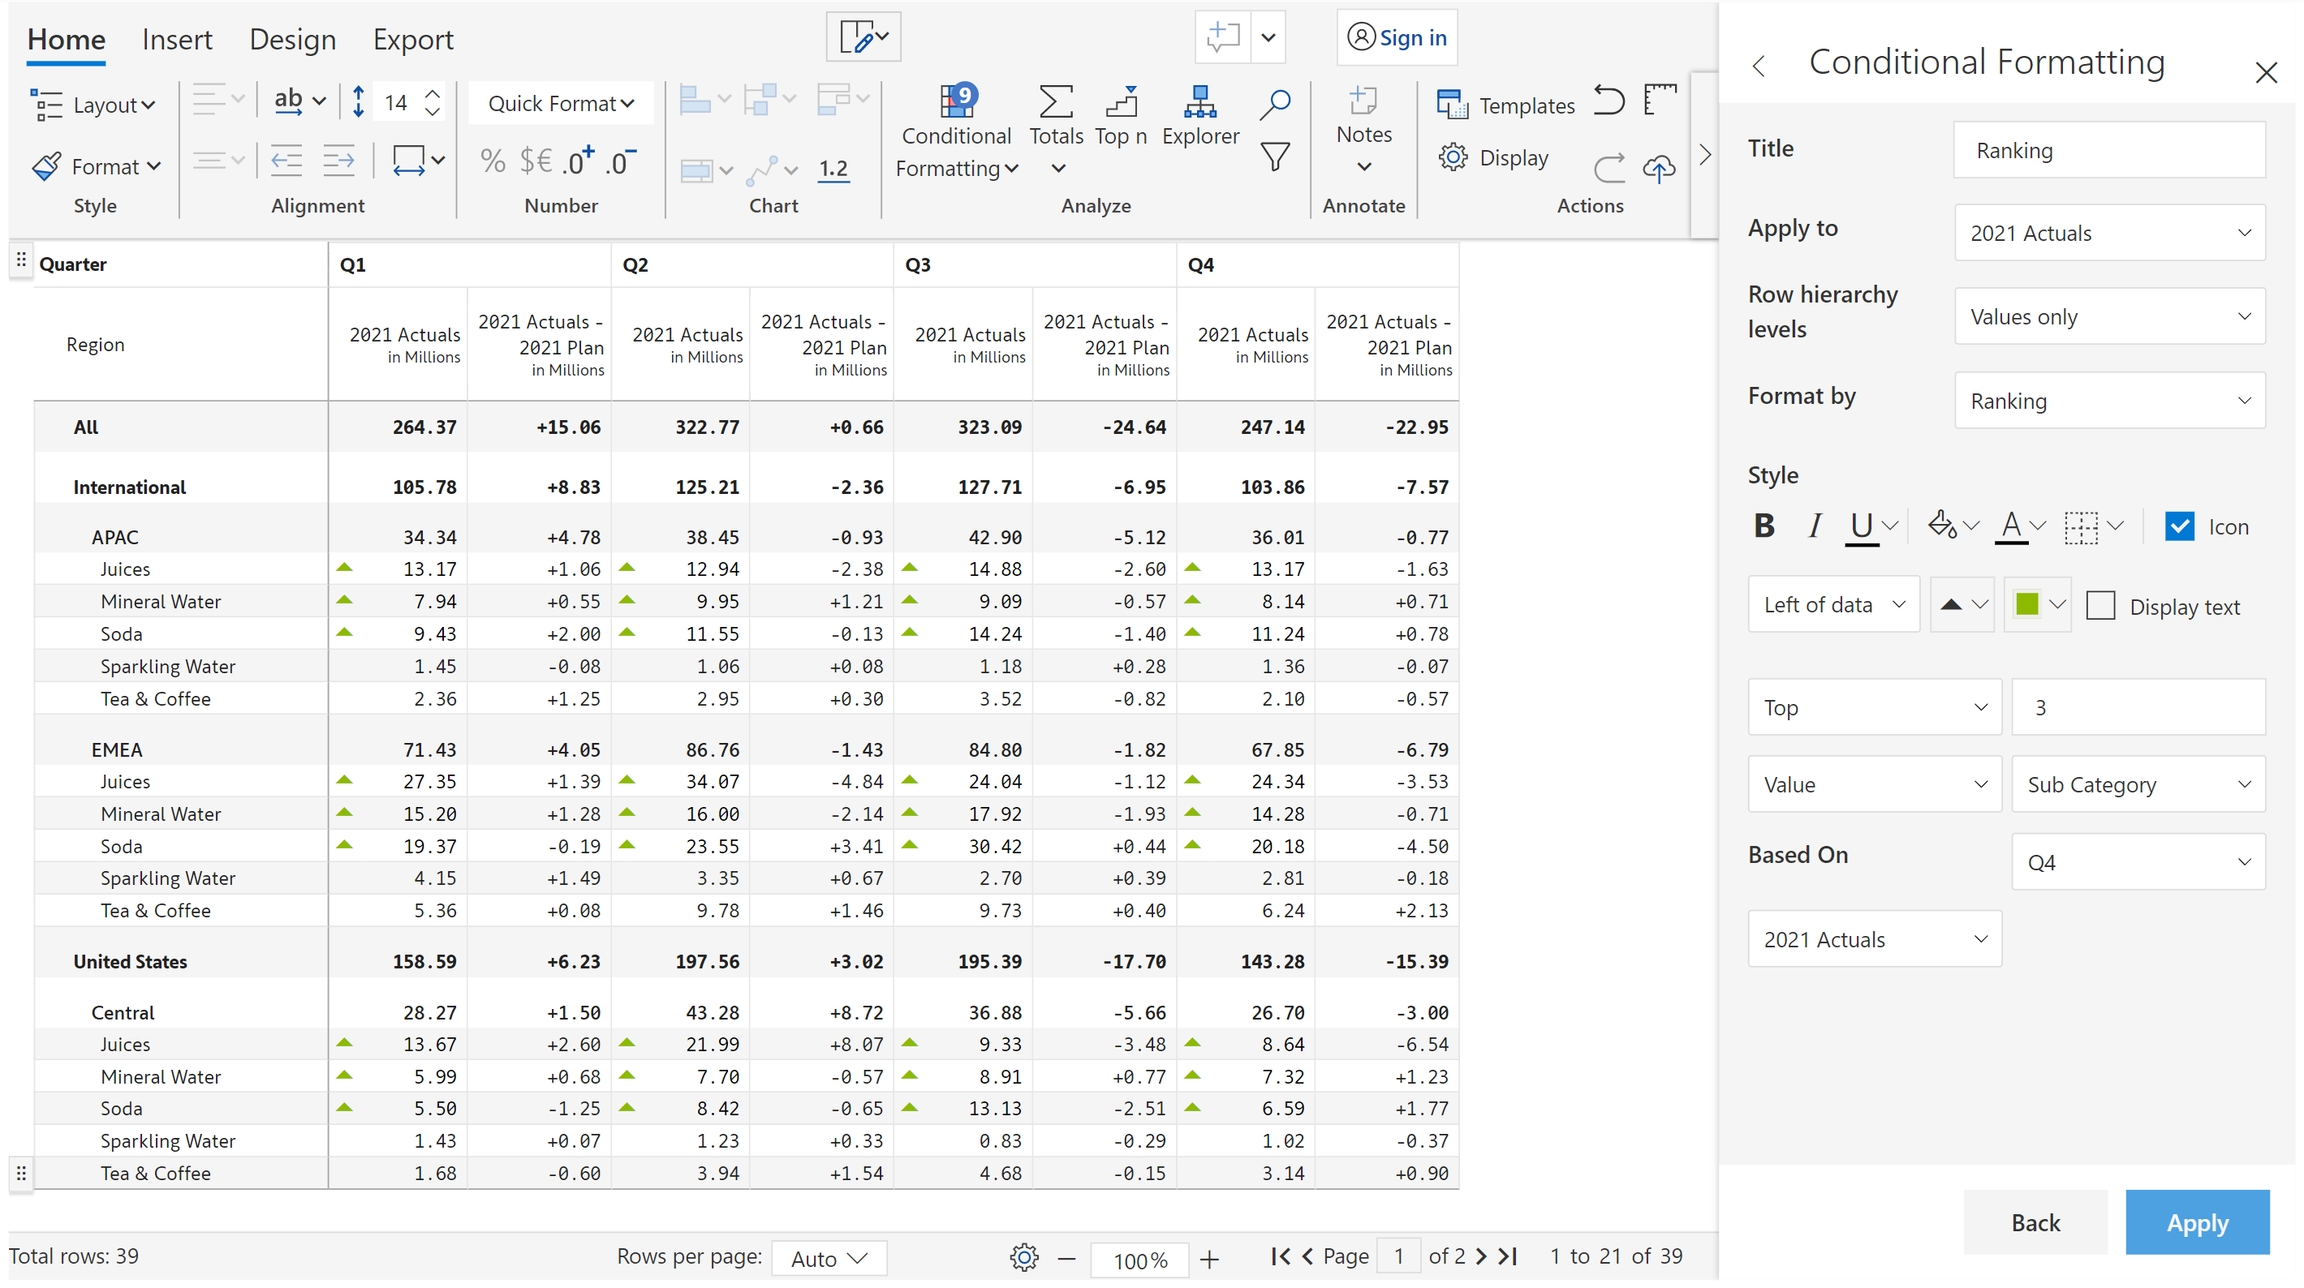
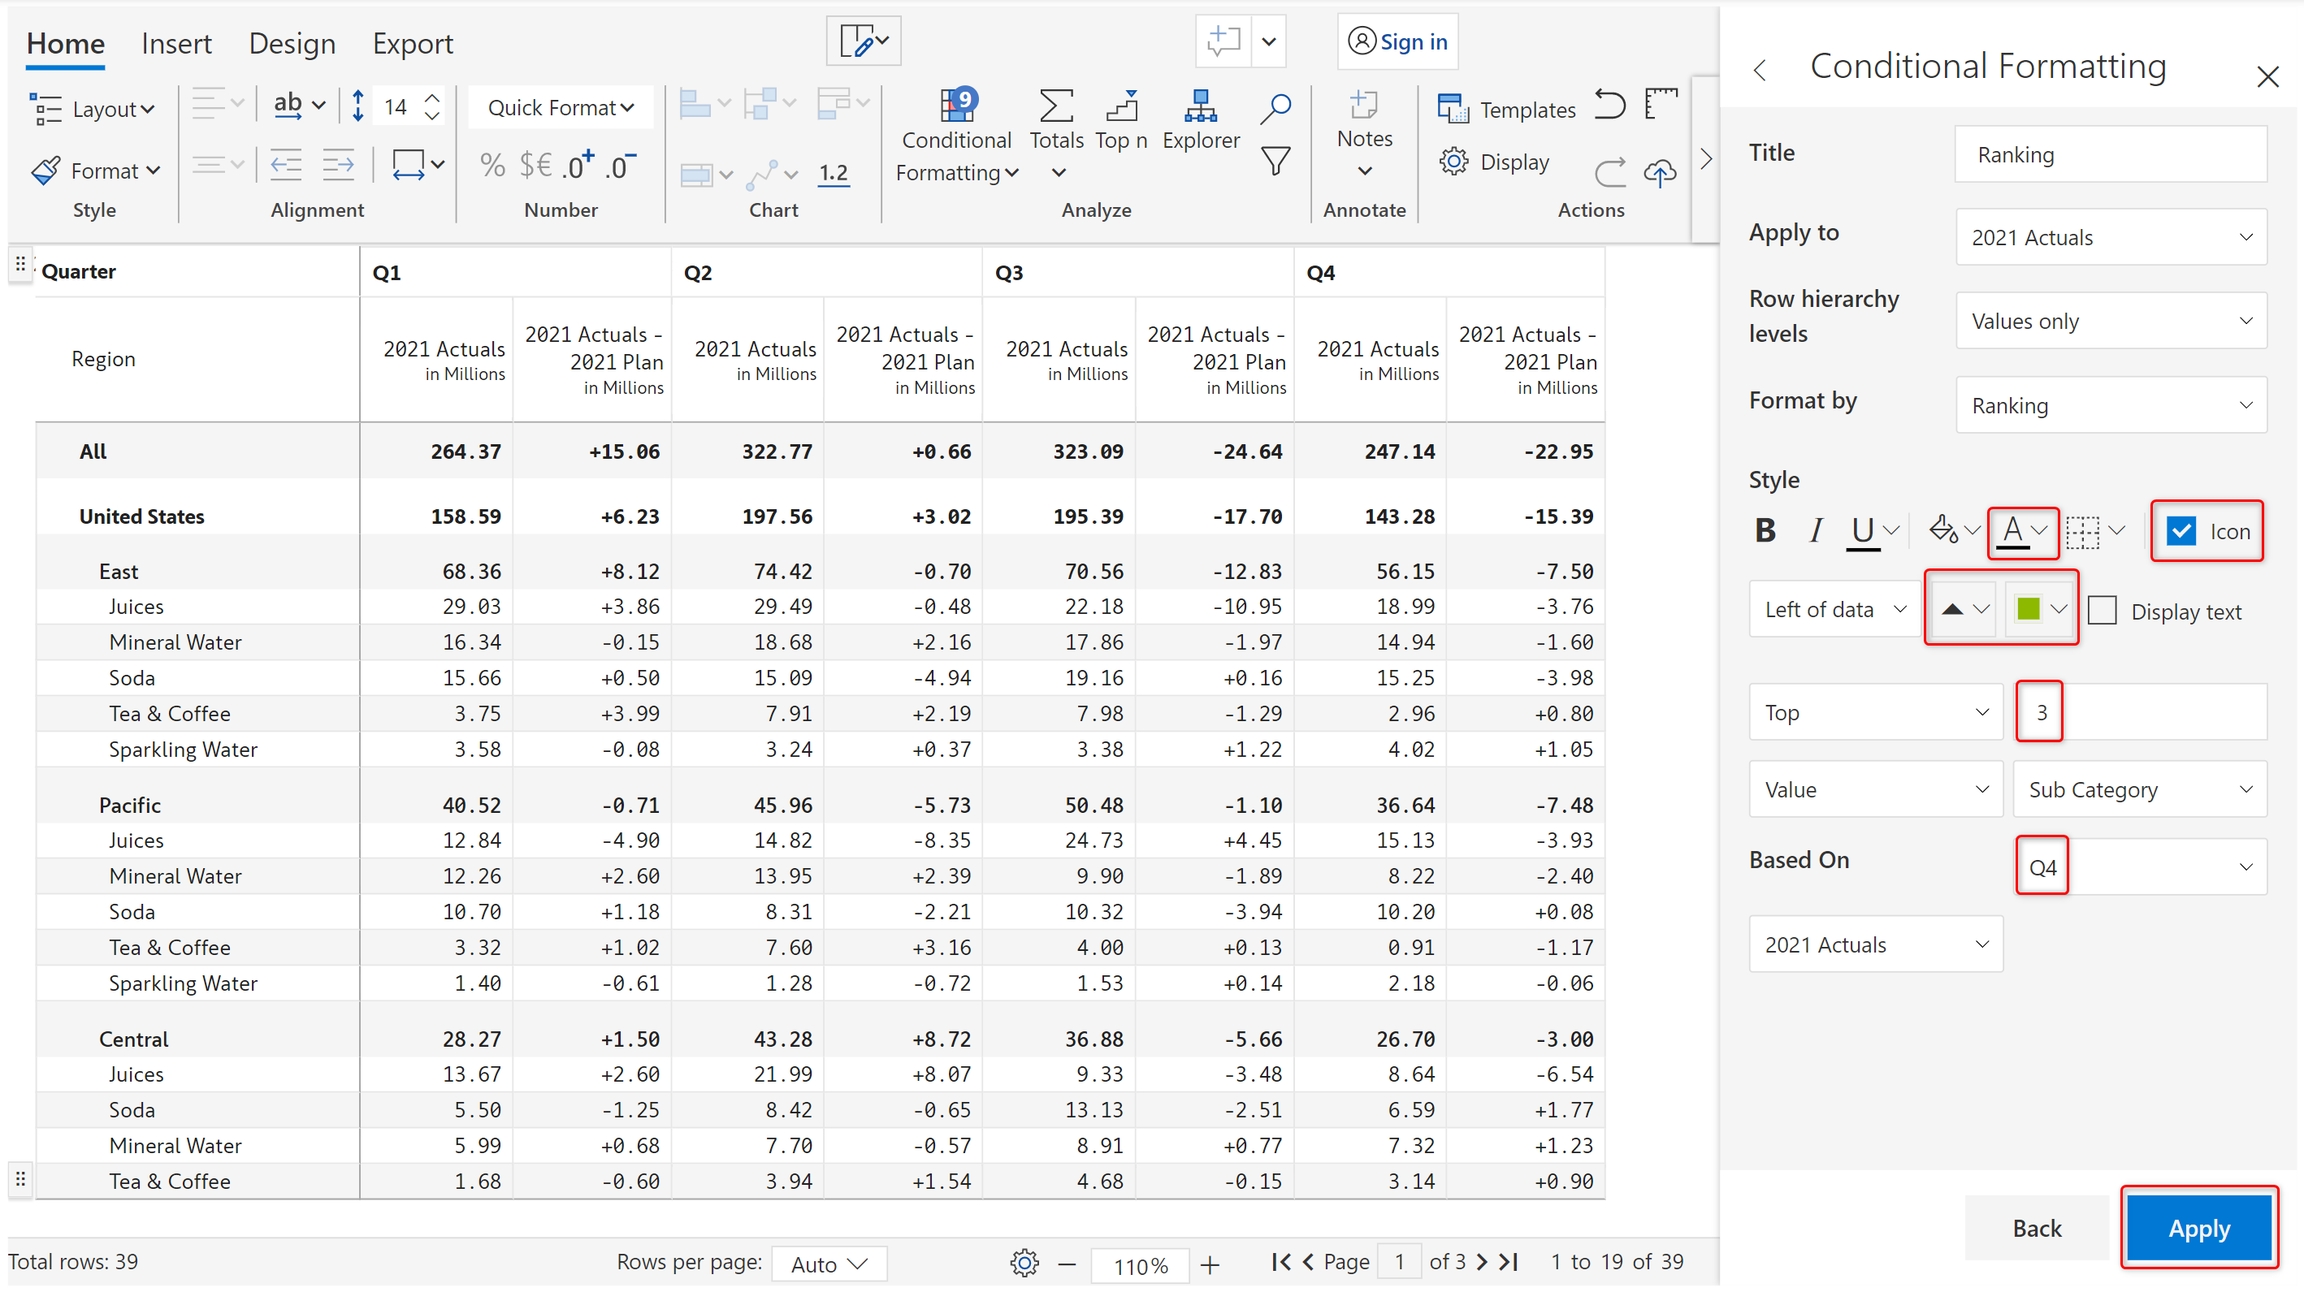
a) Let's apply icon-based formatting to the Top 3 subcategories based on Q4 2021 Actuals. Update the highlighted properties as shown below and click 'Apply'.

b) The top 3 categories based on Q4 2021 Actuals show an icon on the left as shown below.

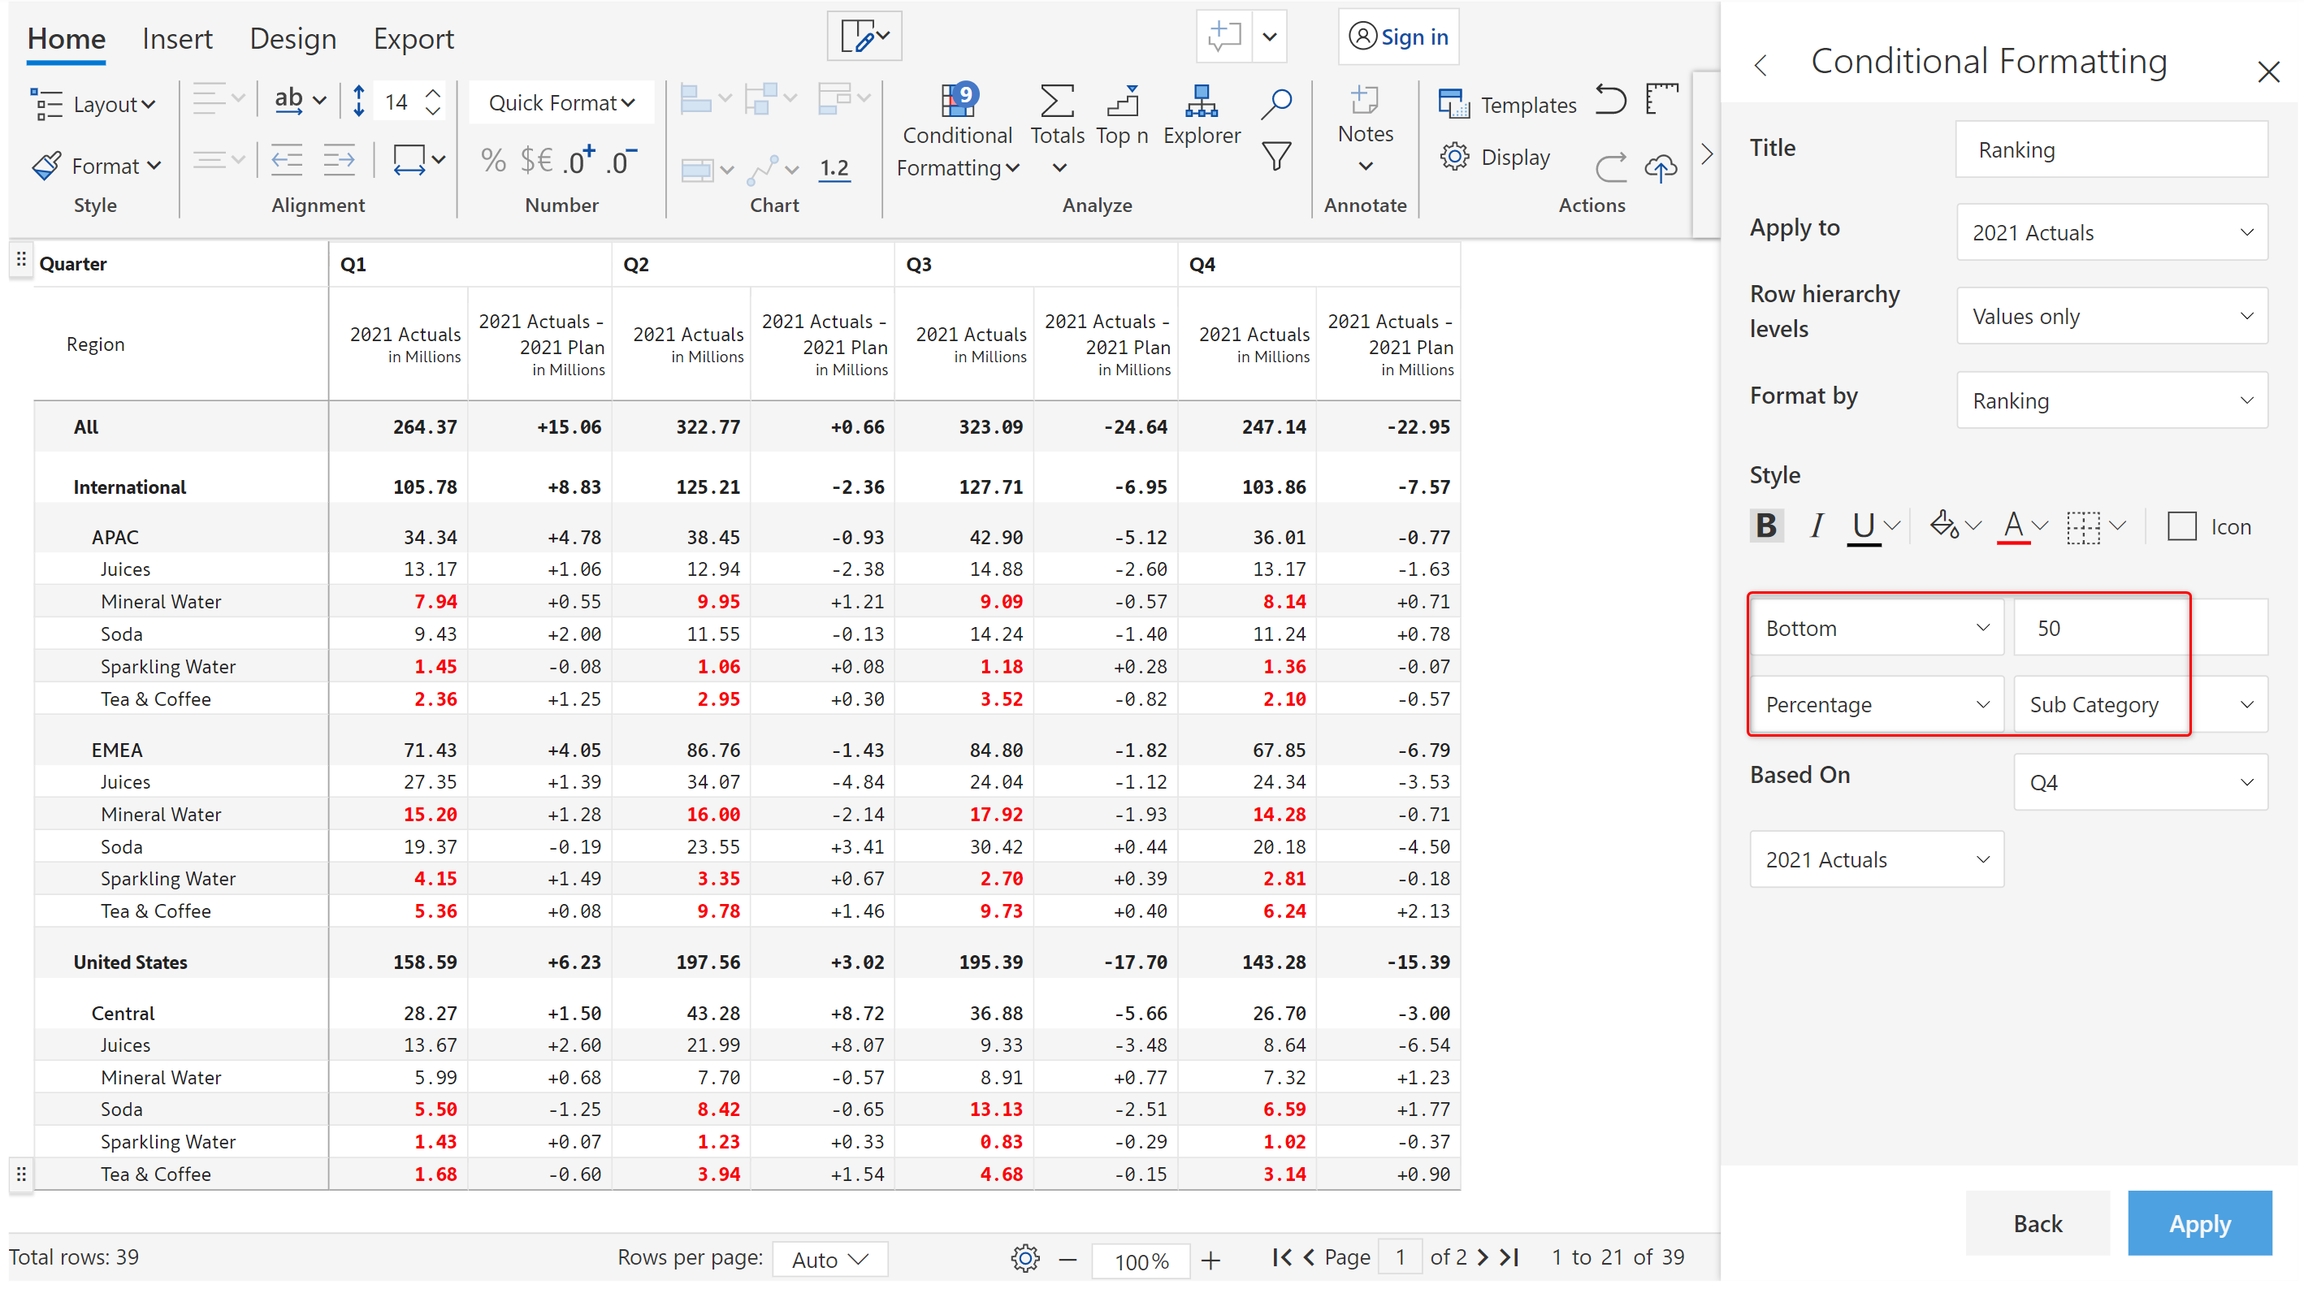
c) You can also apply ranking based on percentages. In the below image, the bottom 50% of subcategories based on Q4 2021 Actuals are highlighted in red.

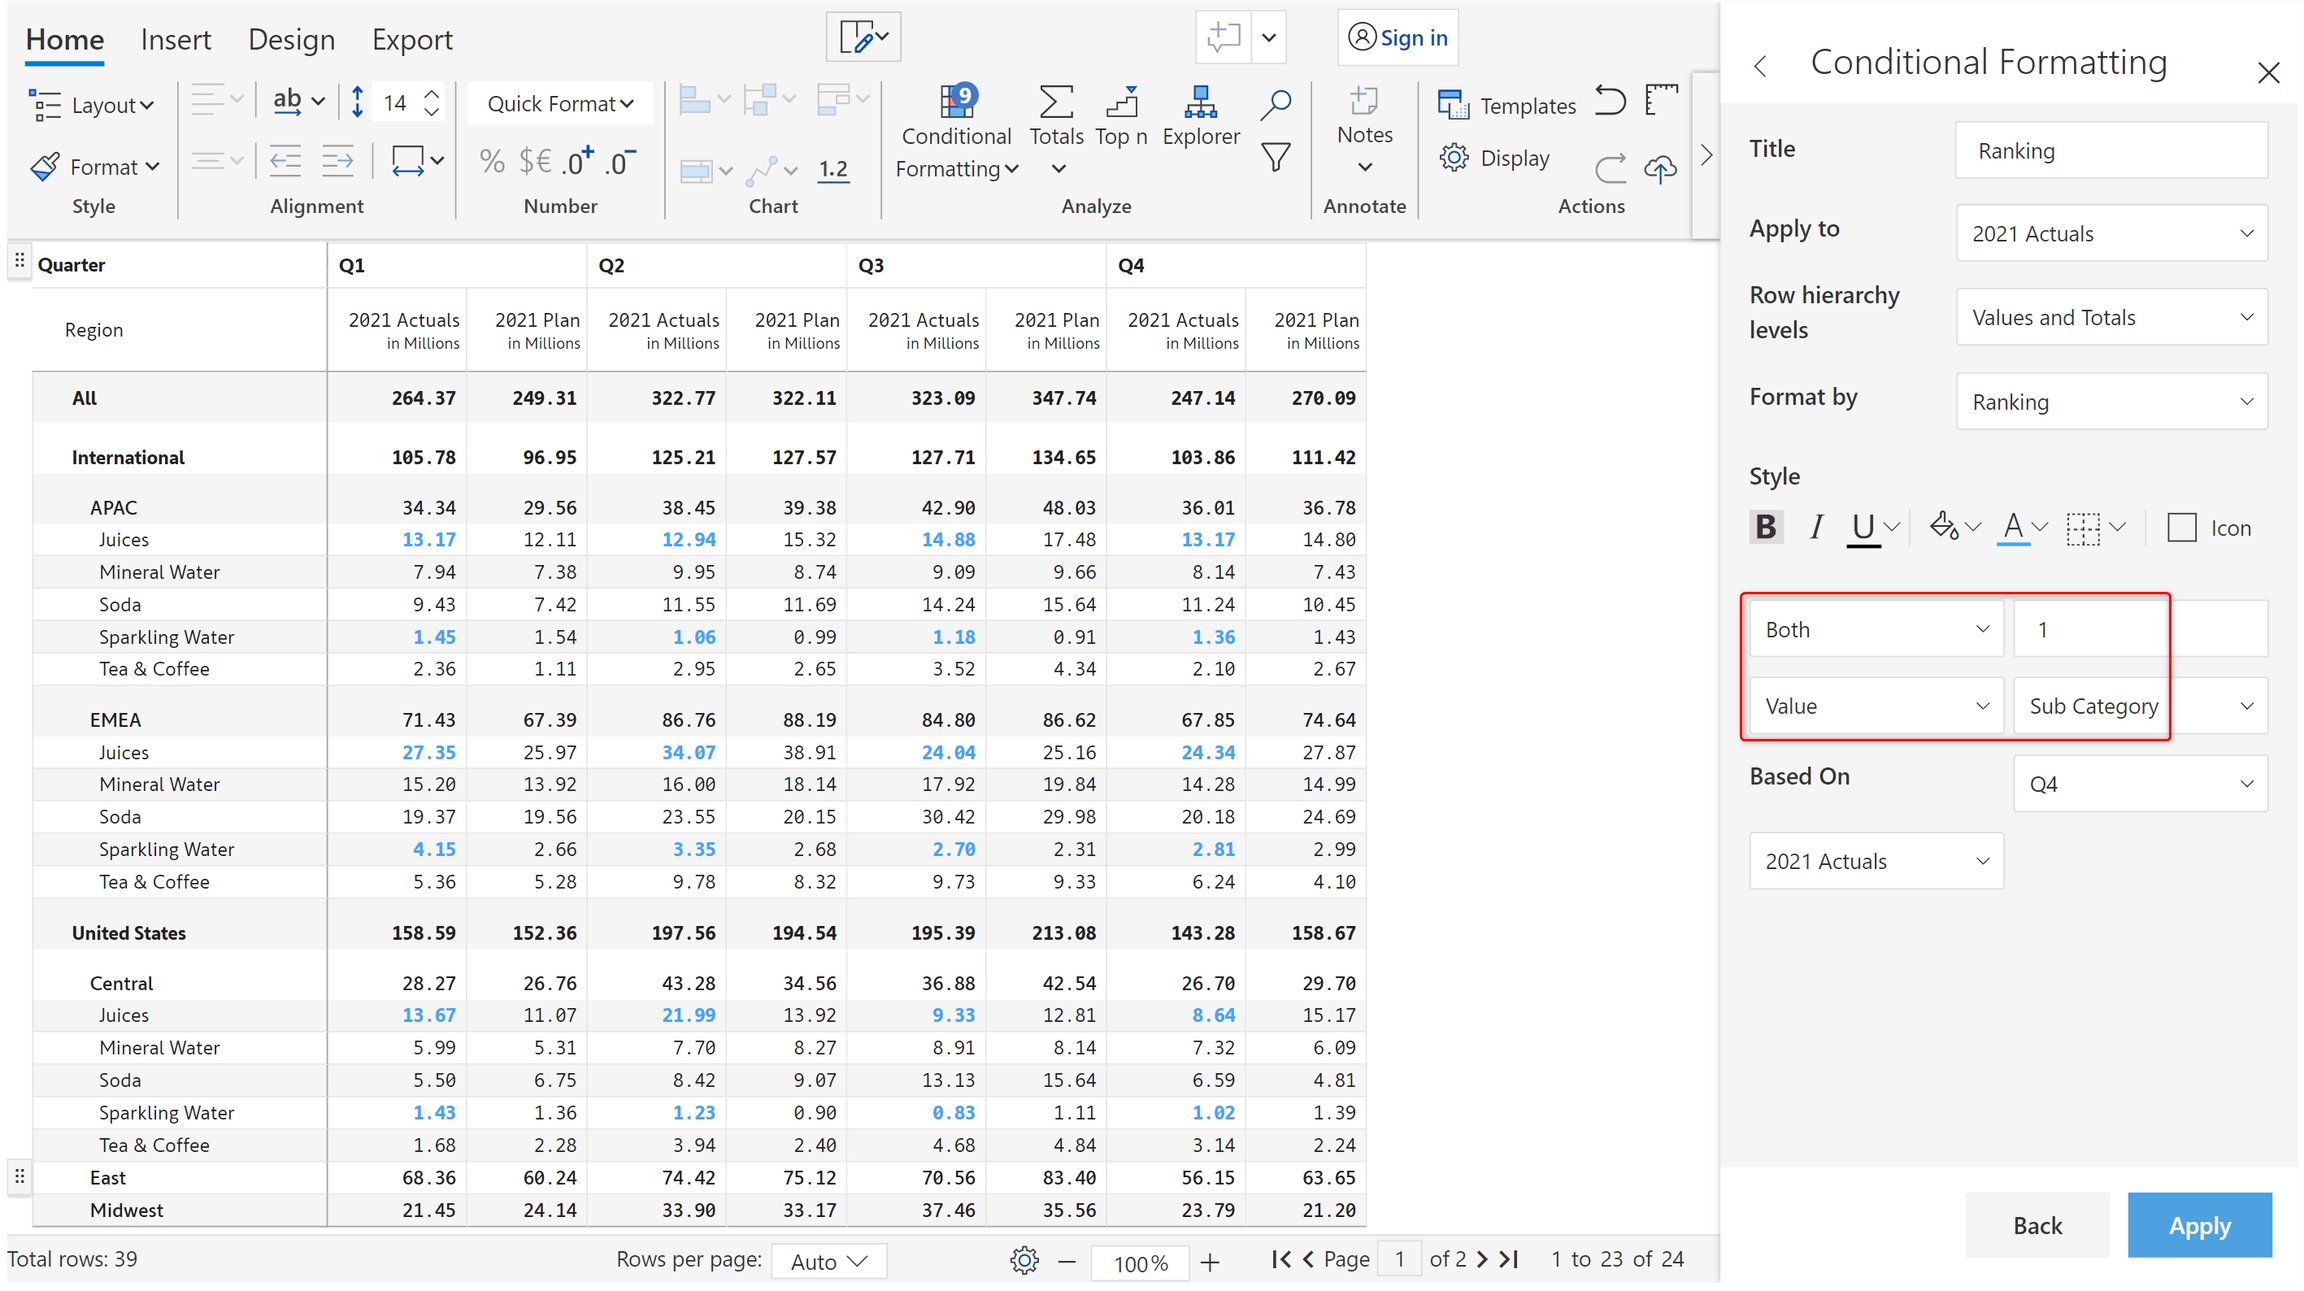
d) You can apply conditional formatting for the top and bottom items using the 'Both' option. In the below image, conditional formatting has been applied for the top and bottom subcategories.

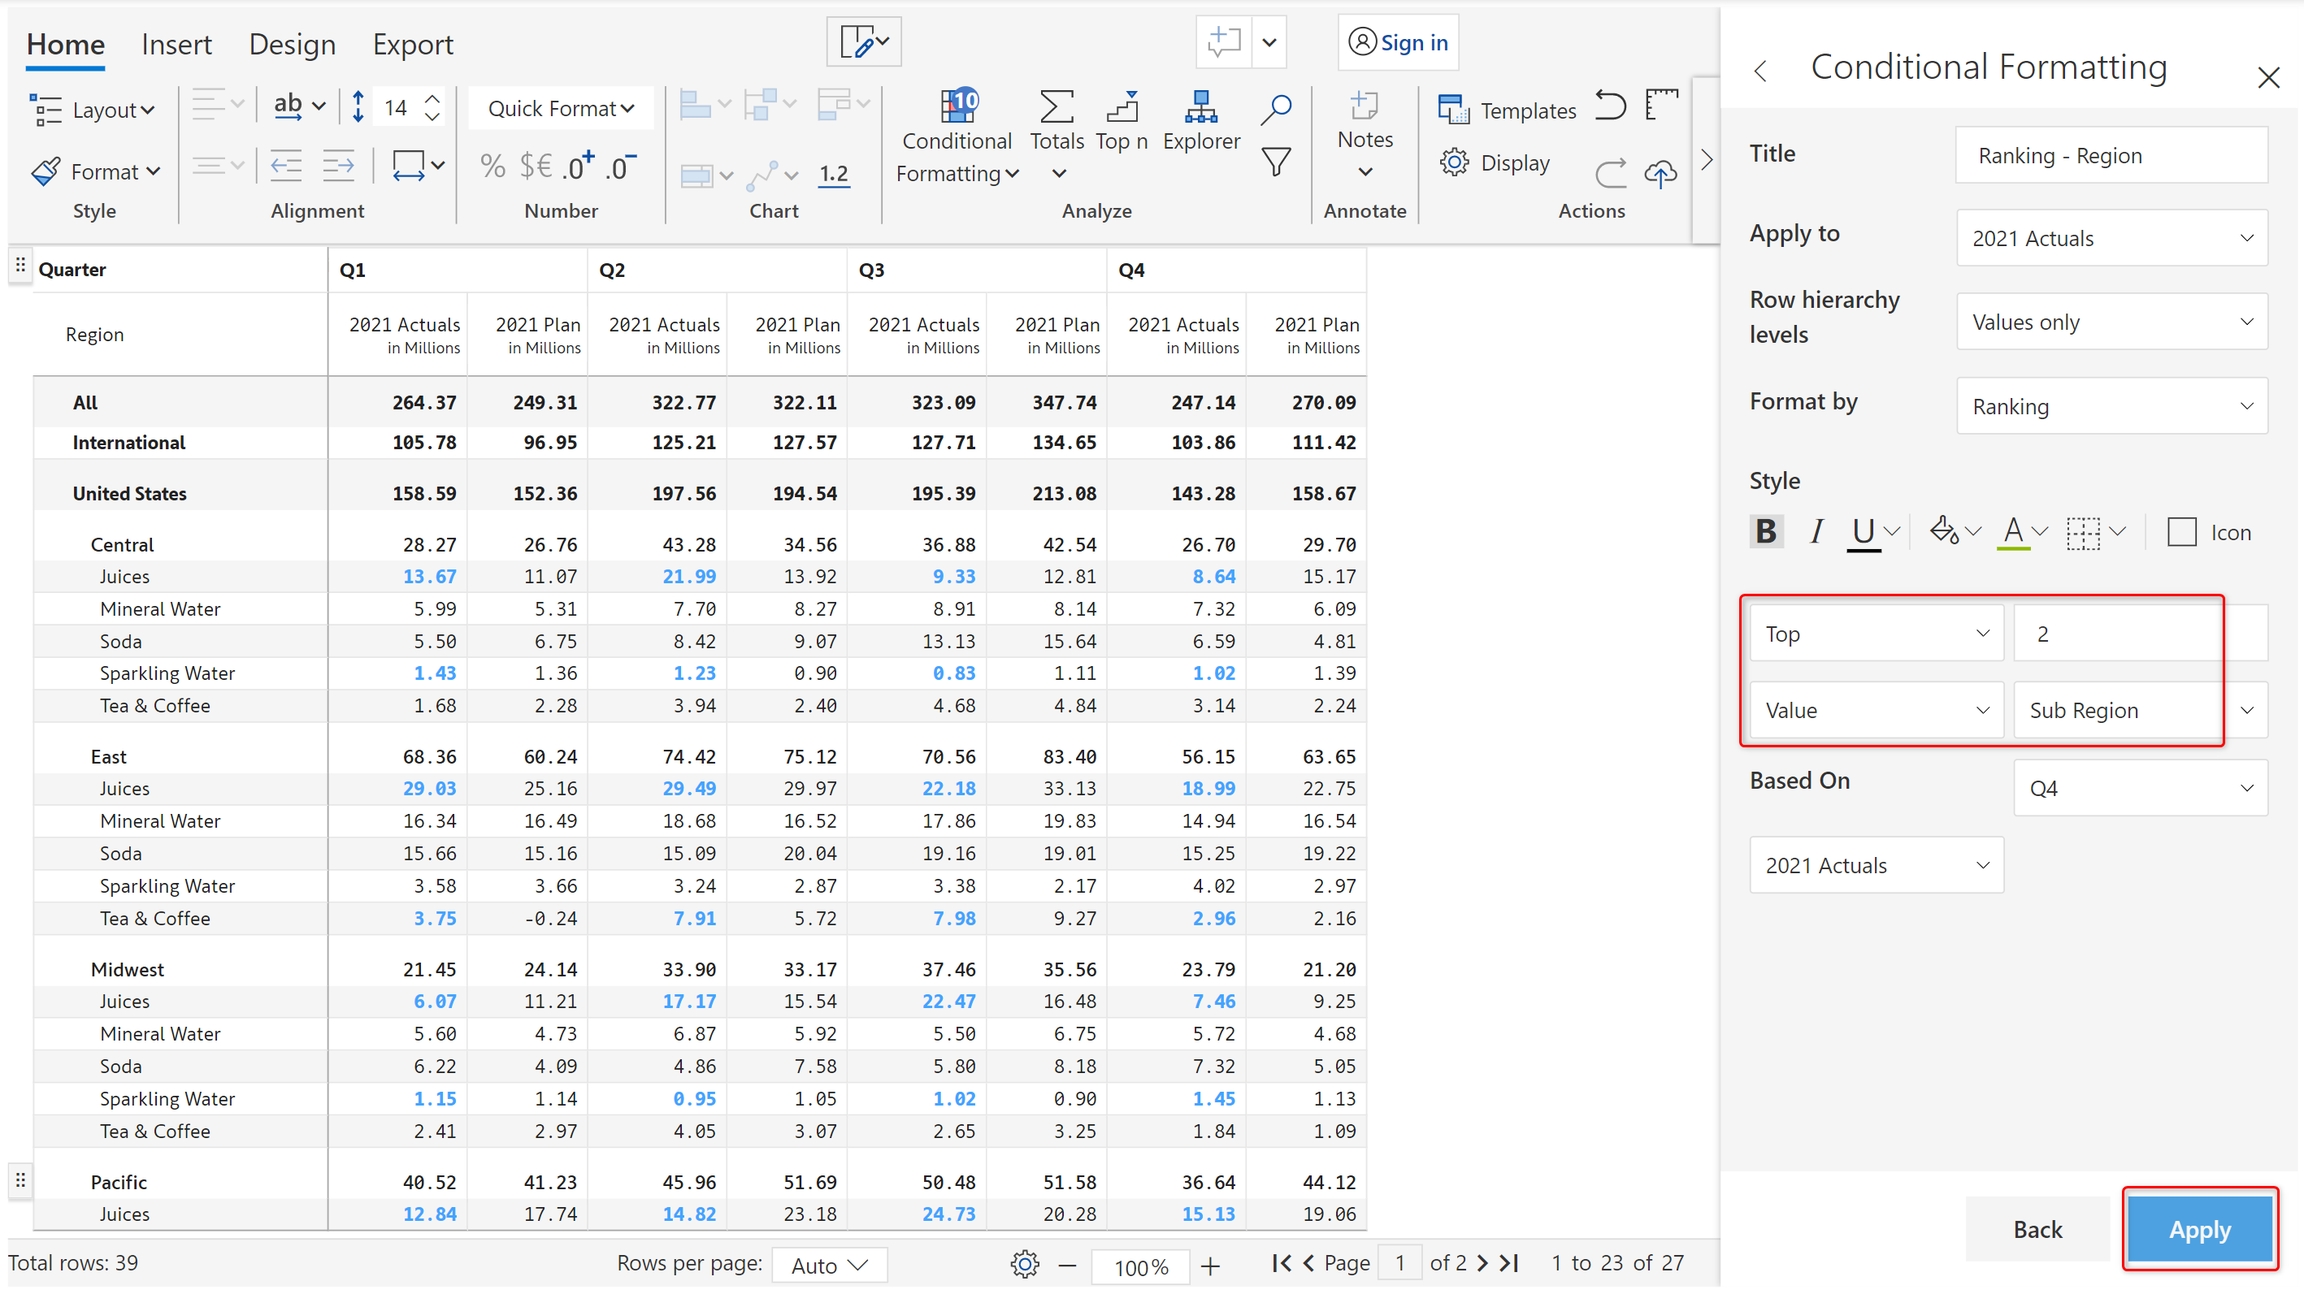
e) Let's create one more rule for highlighting the top 2 subregions. Create a new rule and configure it as shown below. Click 'Apply'.

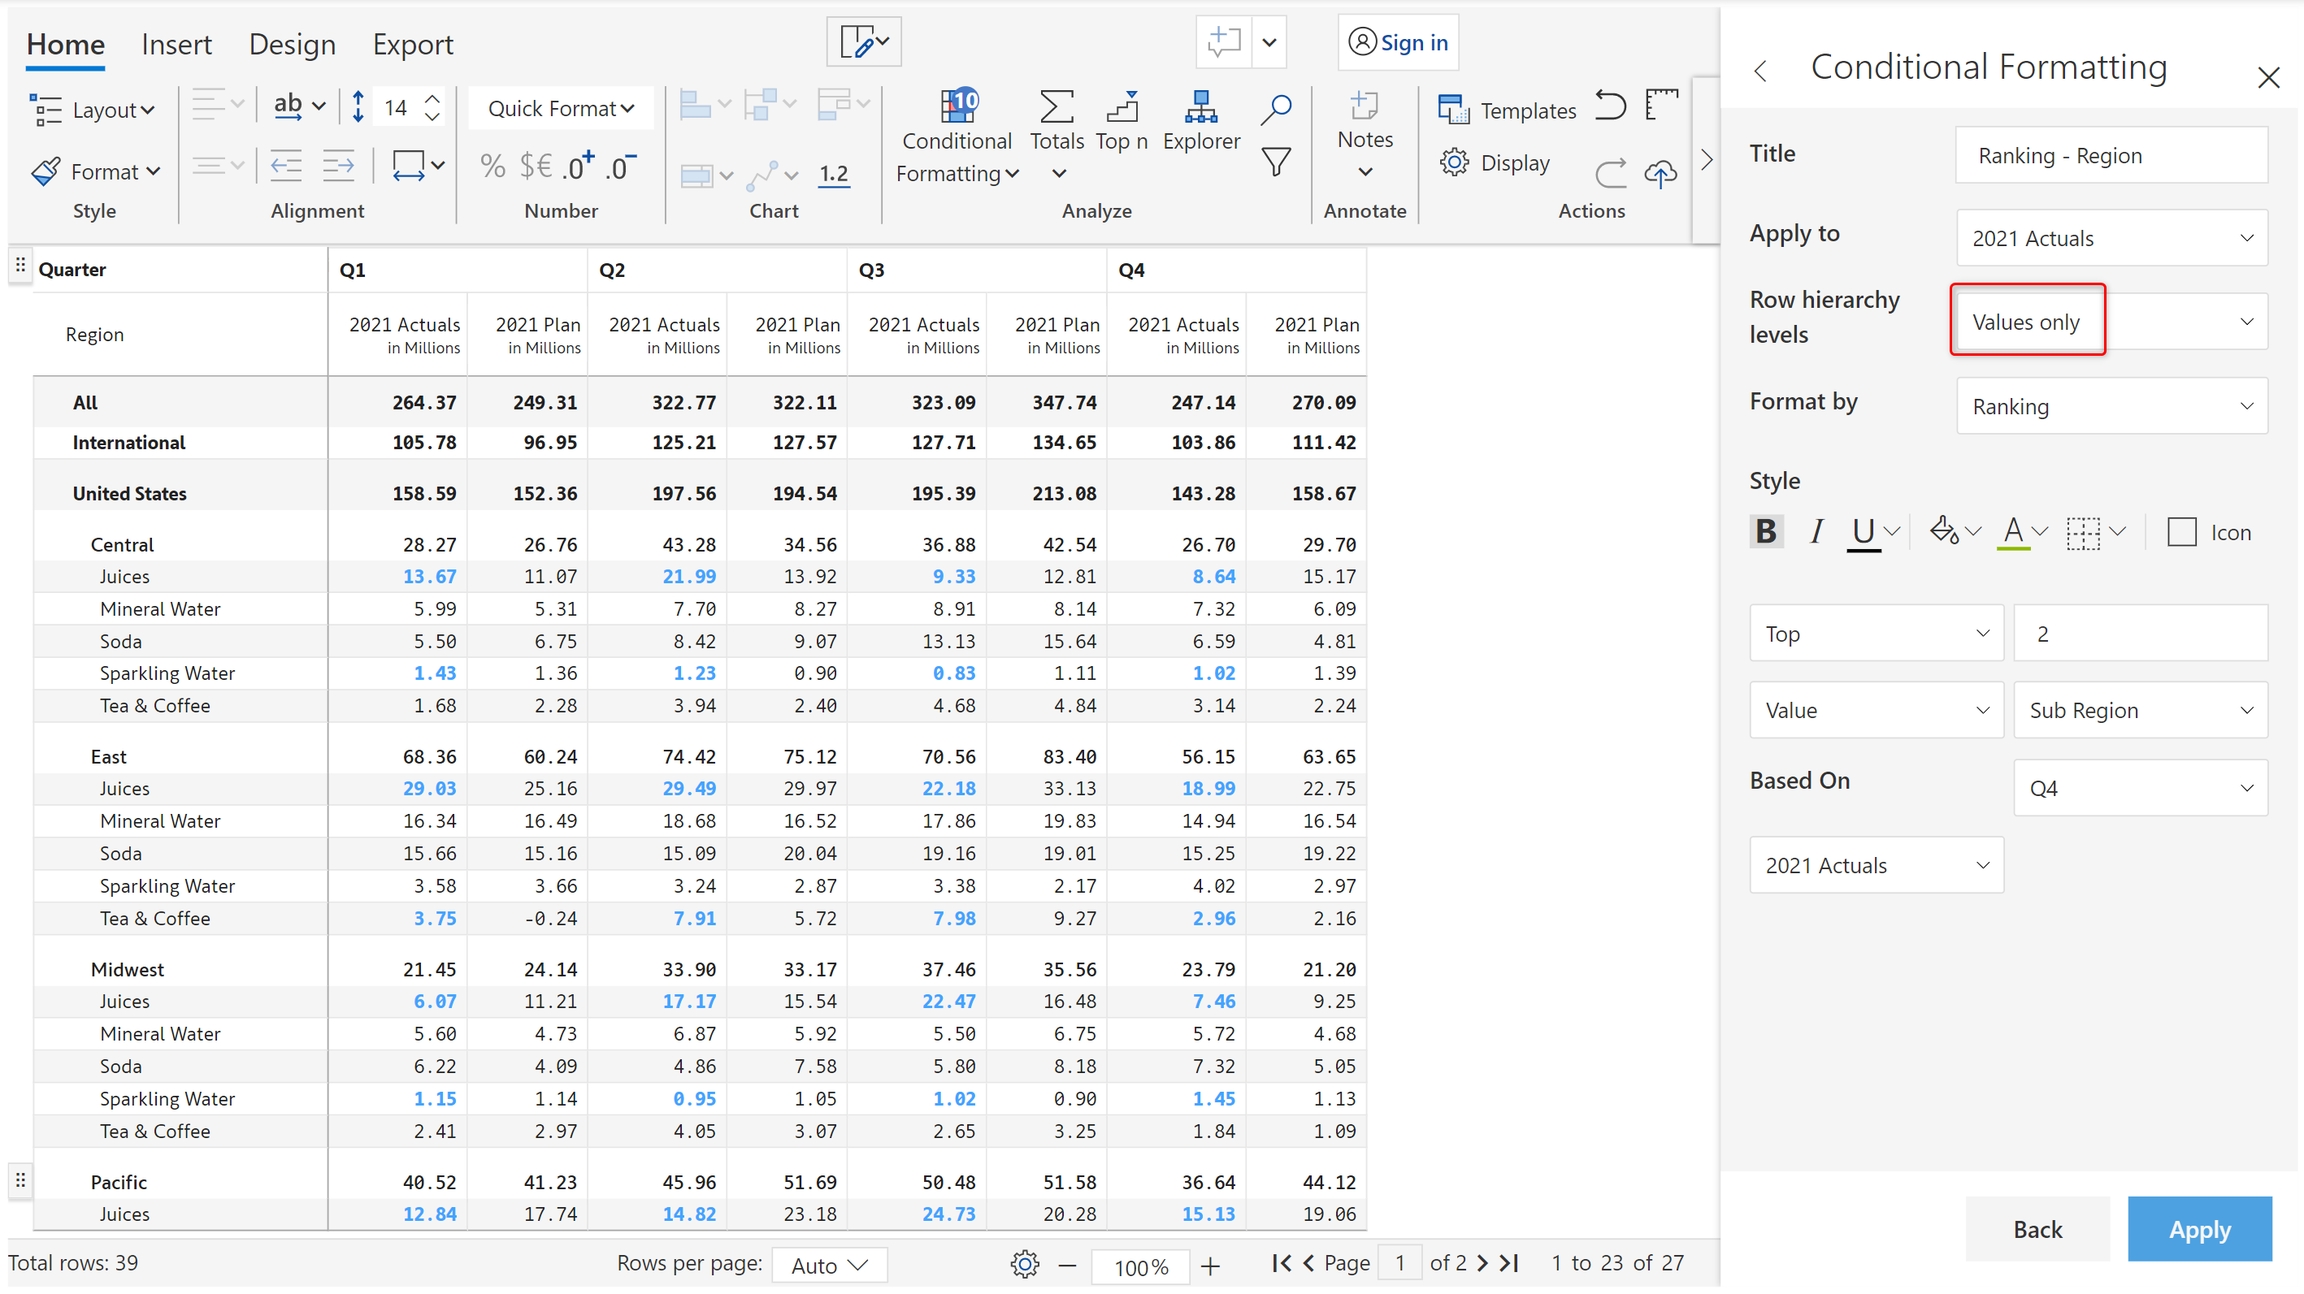
f) Conditional formatting doesn't get applied. This is because the subregion level is a total level but we have defined 'Row hierarchy levels' as 'Values only'.

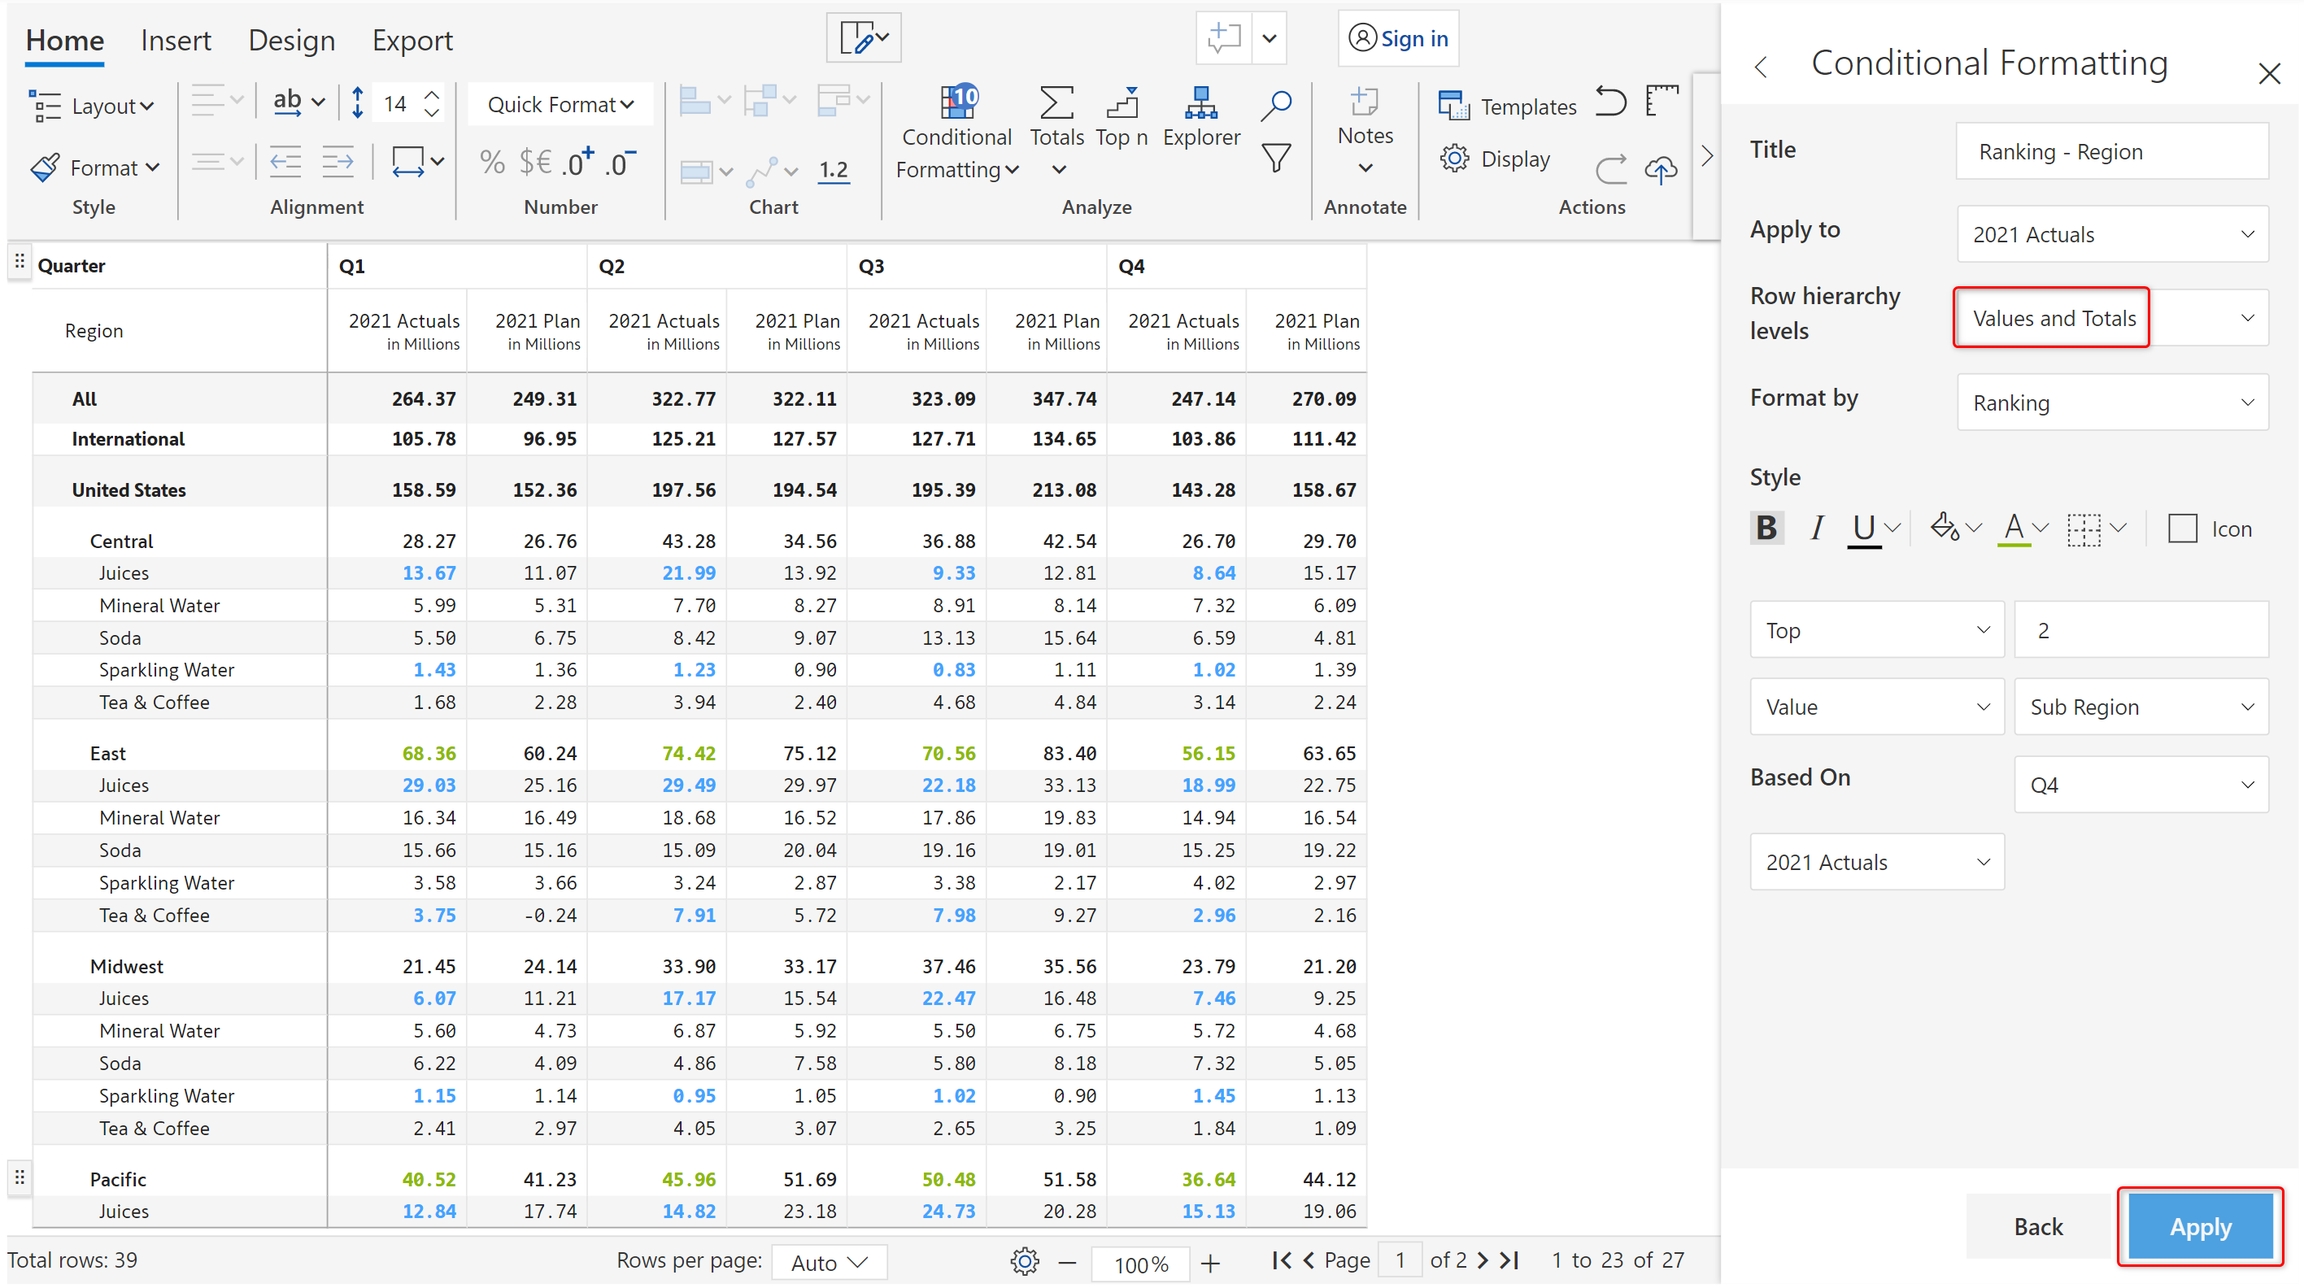
g) Change the 'Row hierarchy levels' to 'Values and totals' and click 'Apply'. You can see East and Pacific are highlighted.

In the next section, we'll be looking at .

managing rules
create rule
Conditional formatting based on Top N ranking
Customizing the rule
Conditional formatting applied based on Top N ranking
Conditional formatting for bottom 50% of subcategories
Conditional formatting for top and bottom subcategories
Applying CF for subregions based on Ranking
Conditional formatting for totals
Multiple ranking rules