Audit log
Inforiver provides an interactive, filterable, exportable, and comment-enabled audit log to track changes to your report.
In the Insert tab, click on the Audit option. The audit log is a full-page, spreadsheet-style window - complete with filters and dropdowns - making it easier to track and manage audits. The Data Input tab, as the name implies, captures all the changes made to data input fields. The Reports tab captures the dimensions and measures added to or modified in the report.
1. Data input audit trail
Let's look at some of the data input field changes that are captured in the audit log.
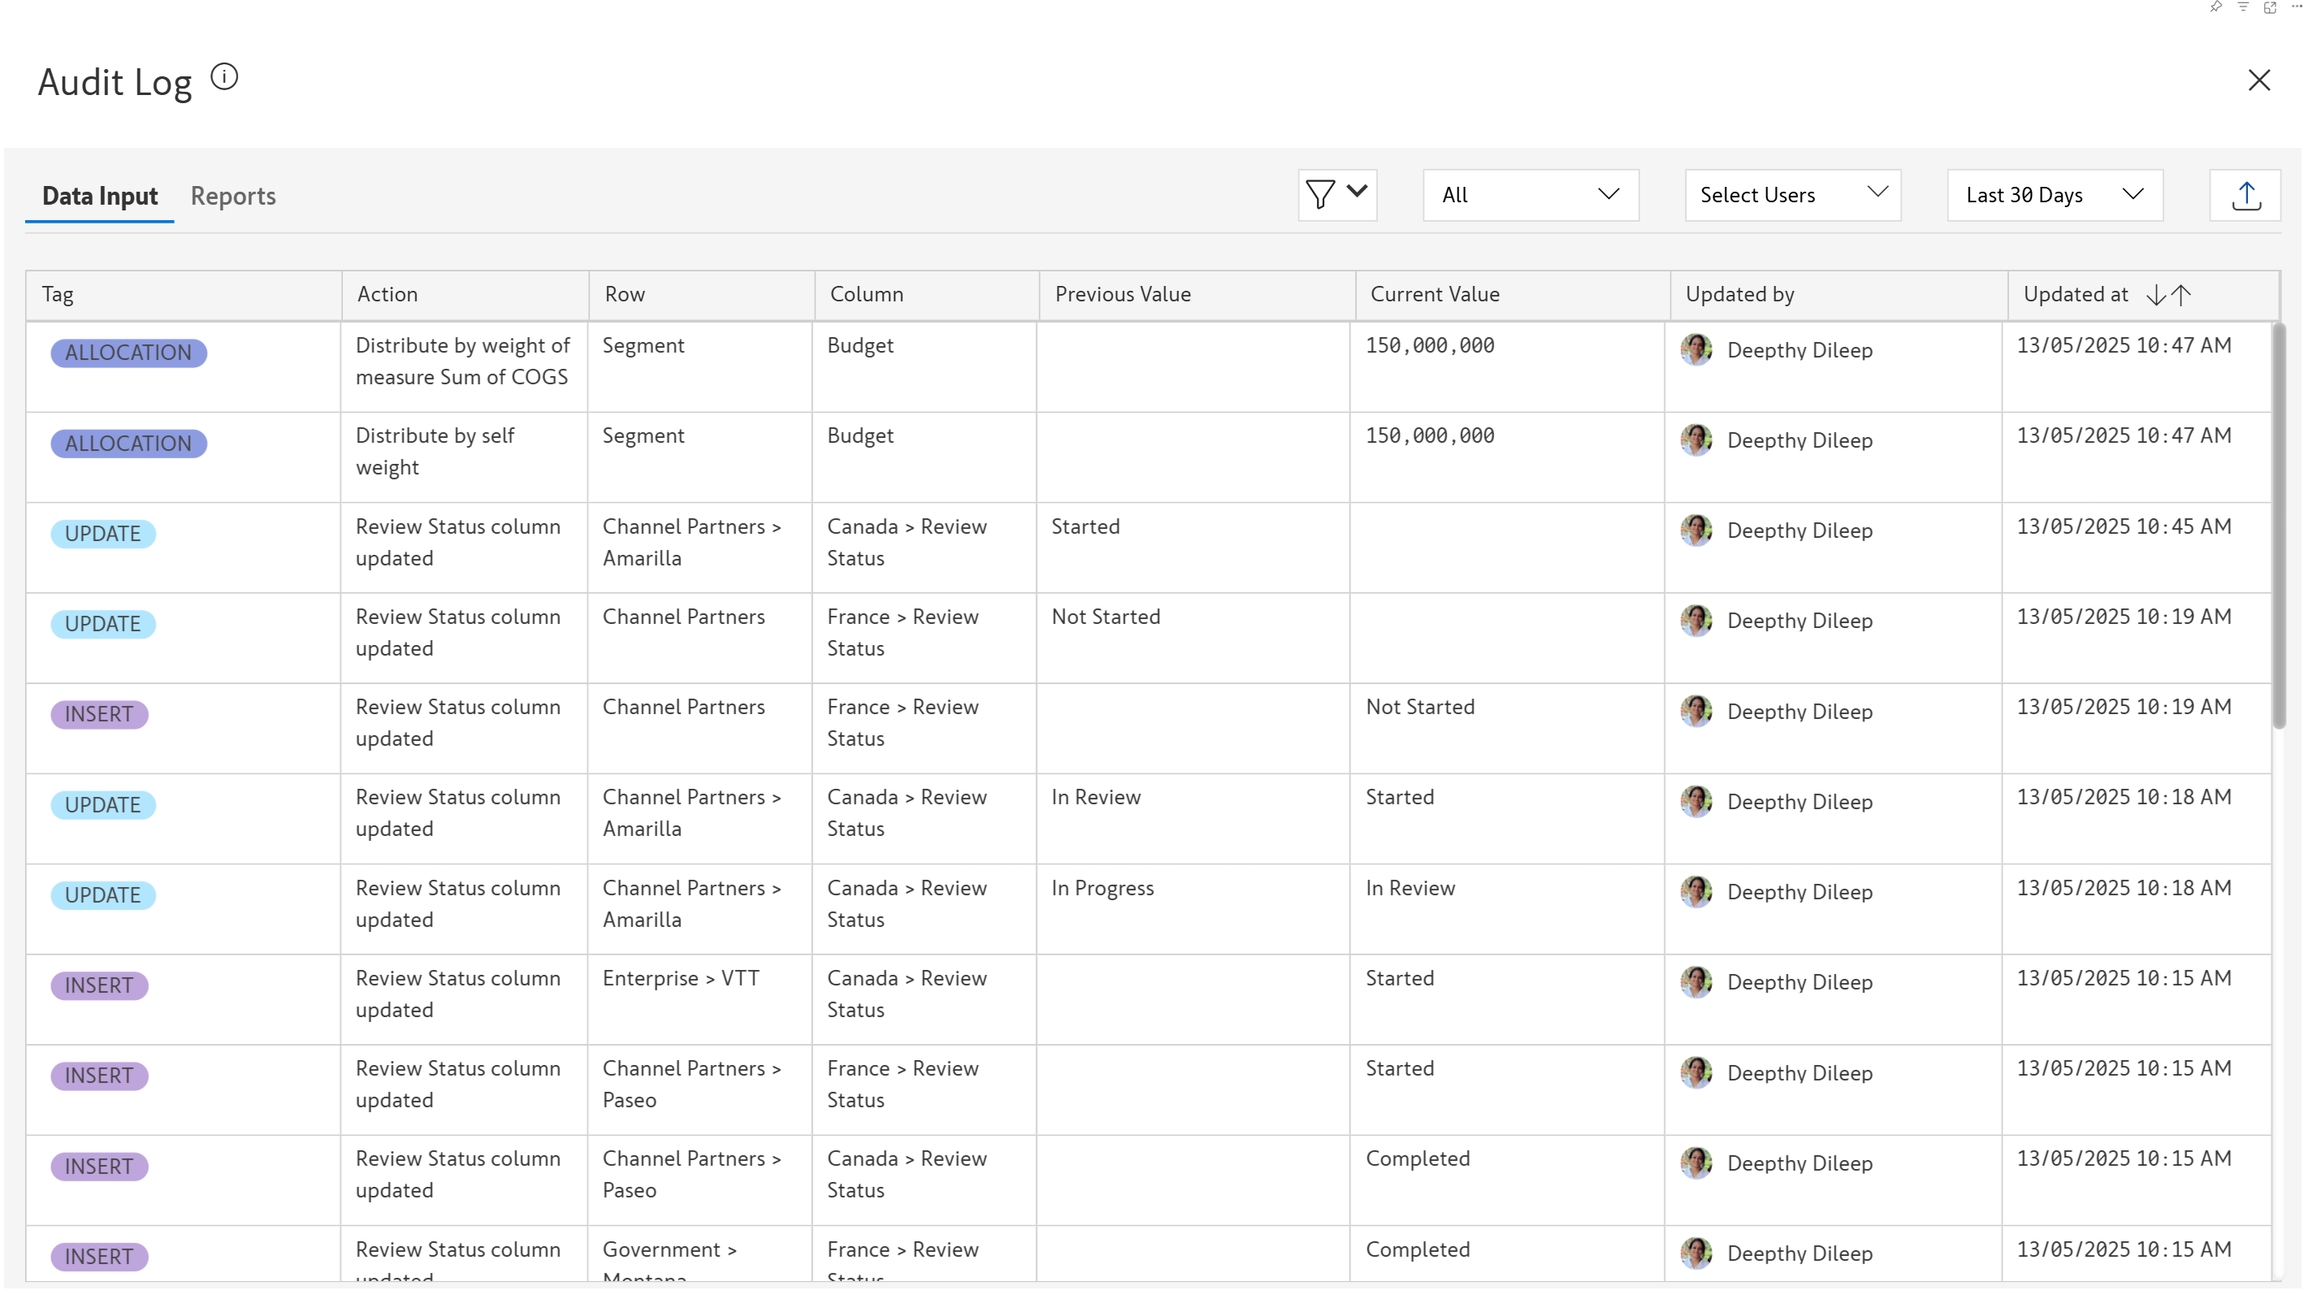
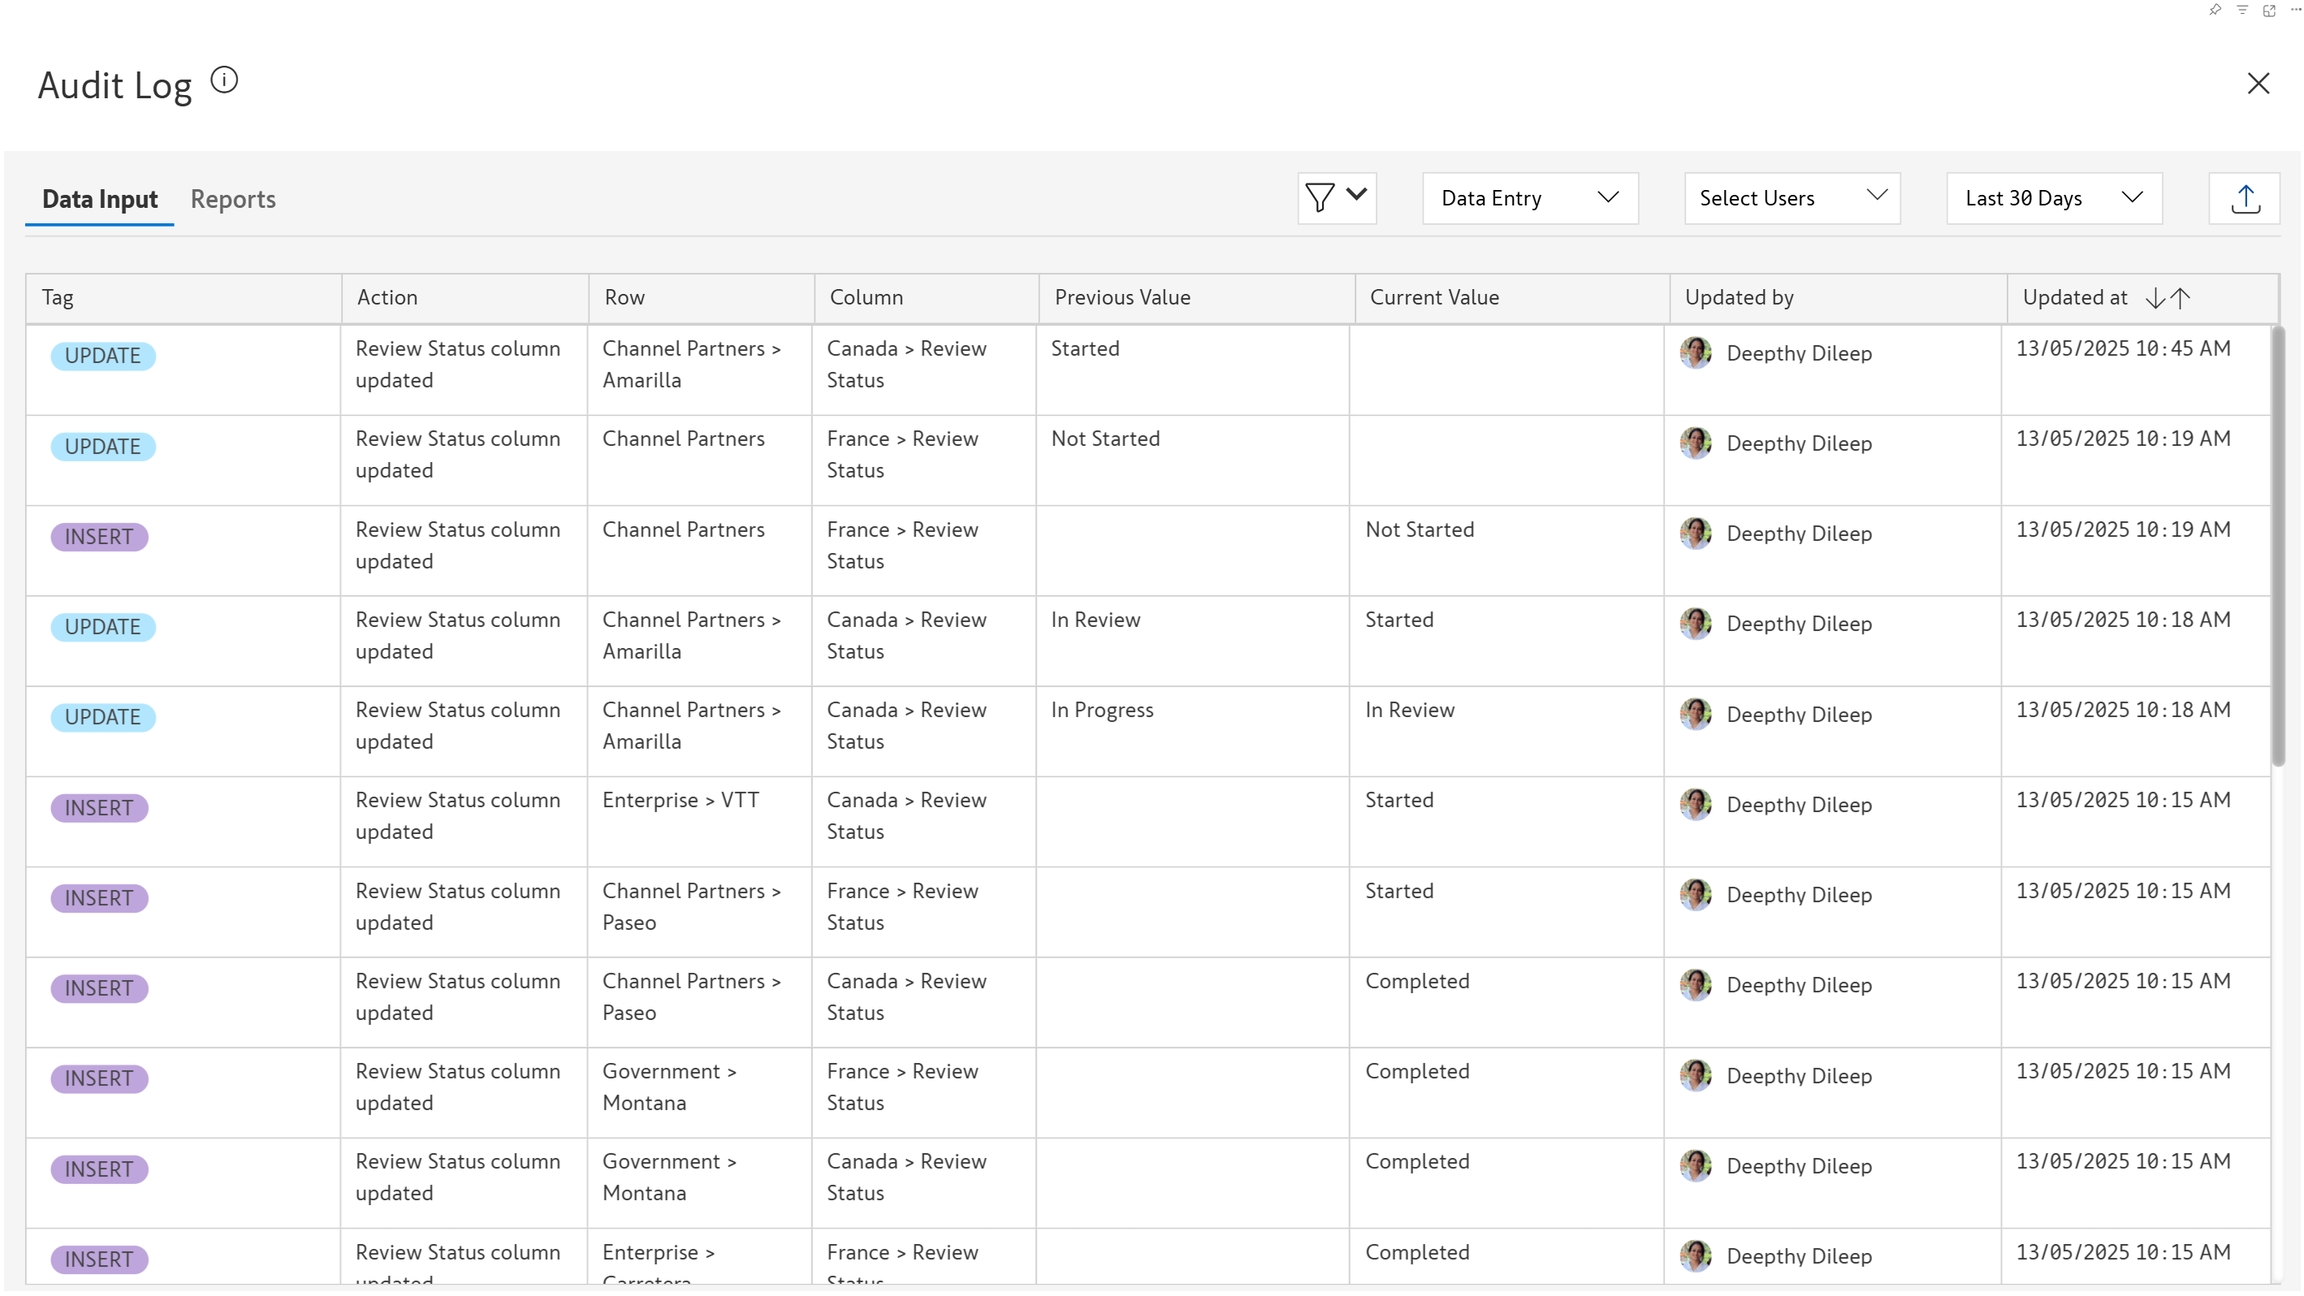
1.1. Data entry
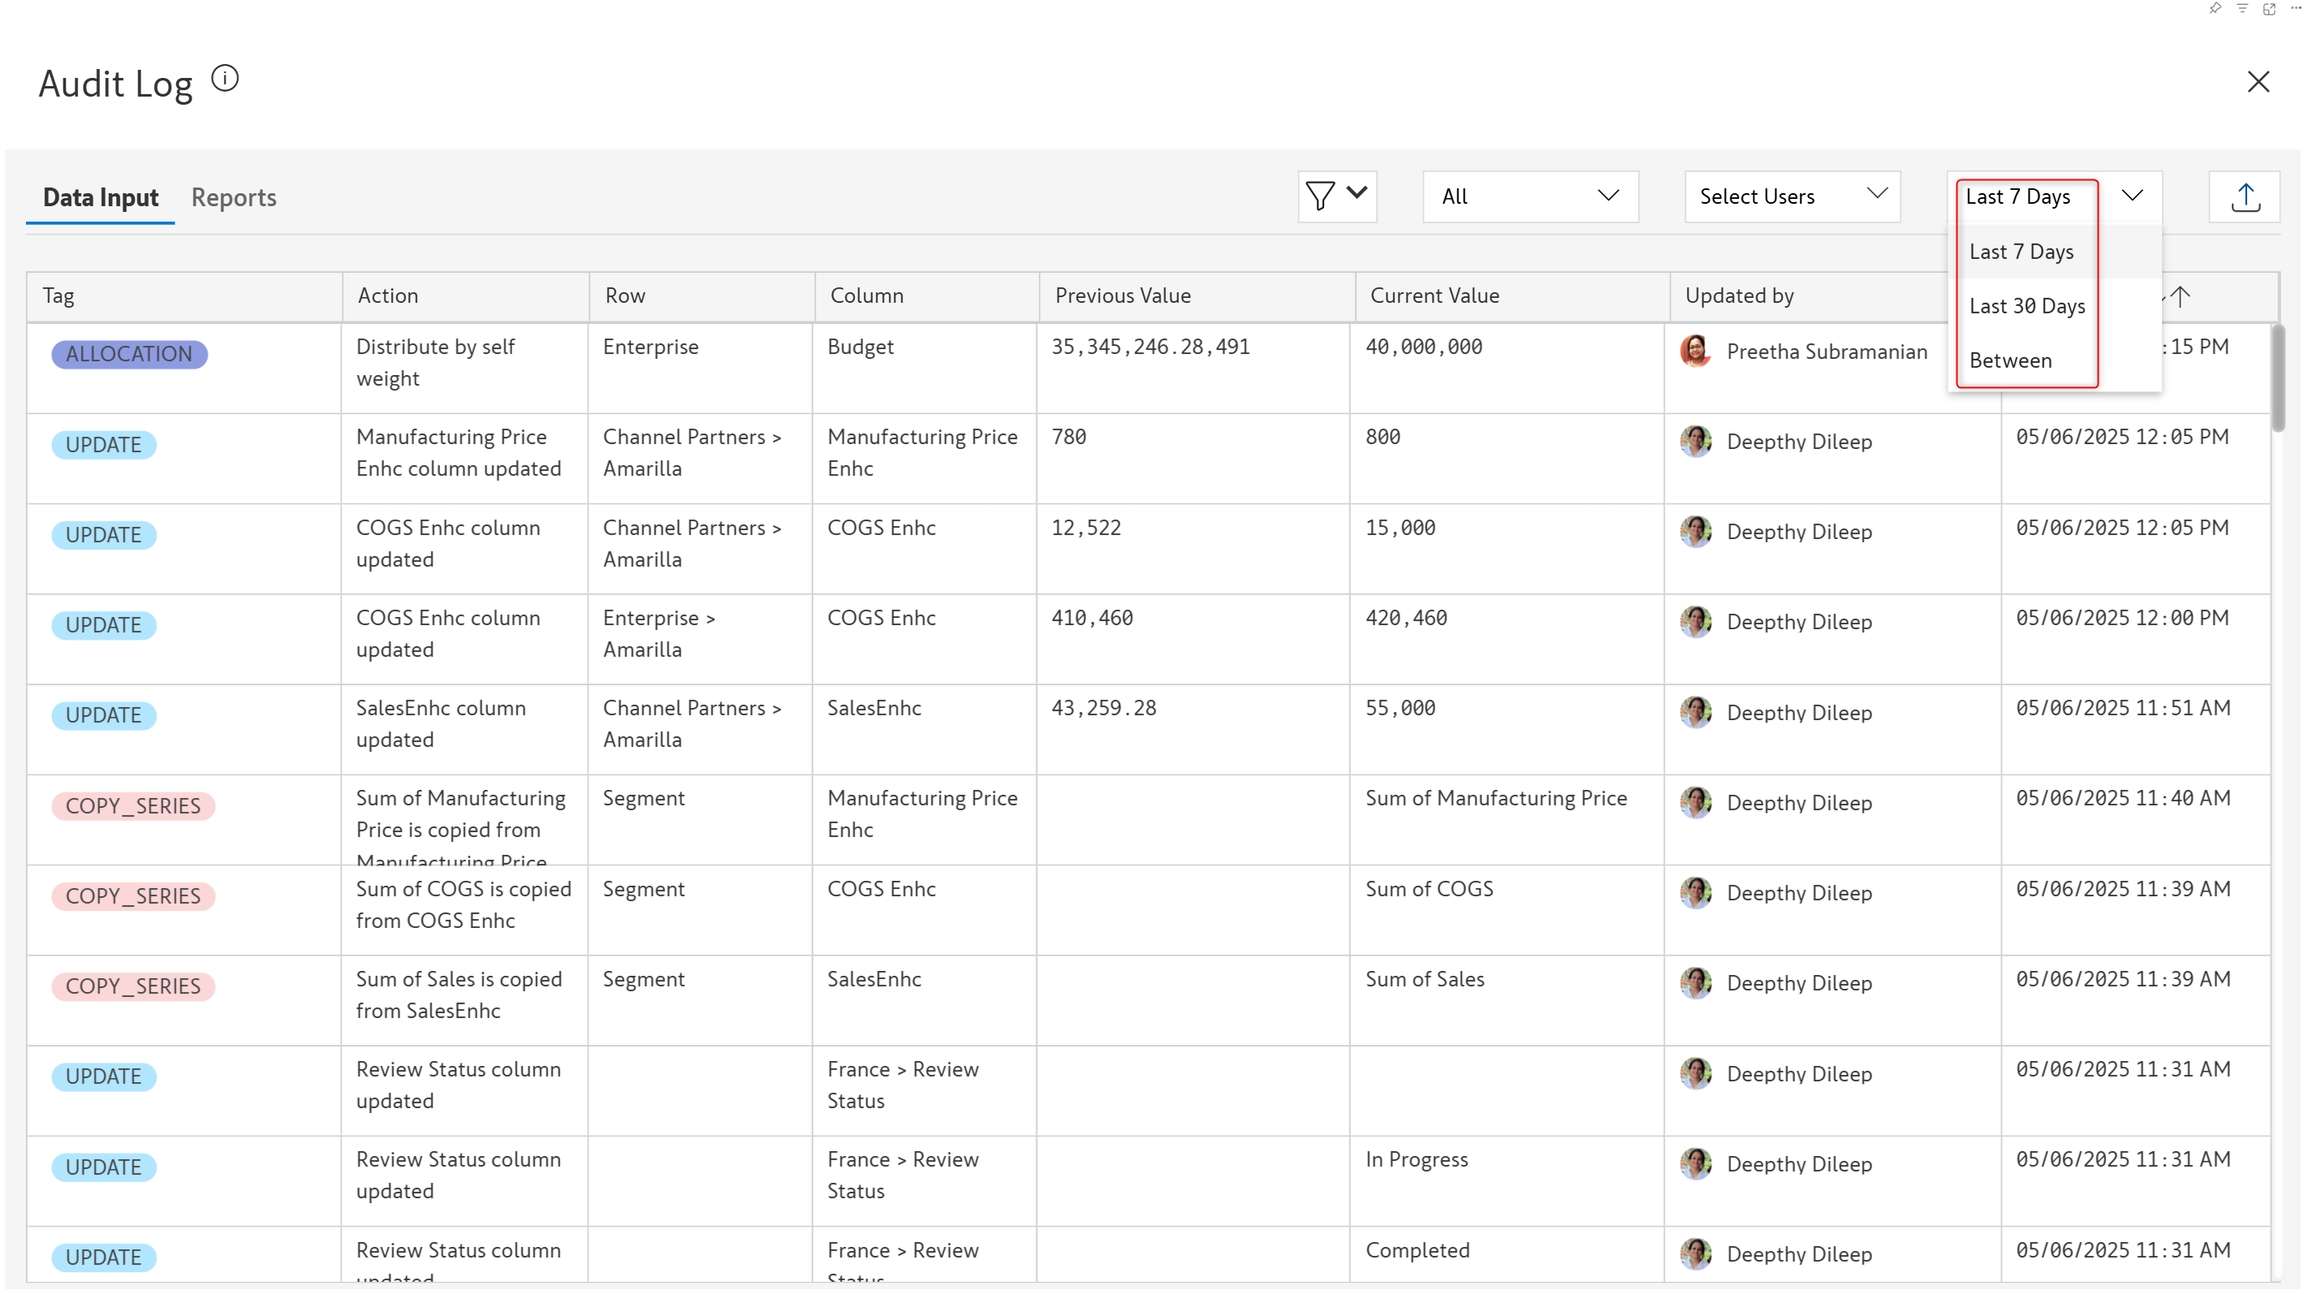
Select 'Data Entry' from the dropdown. You'll be able to see the data input values that were added or updated. When a value is updated, the audit log also captures the earlier value.
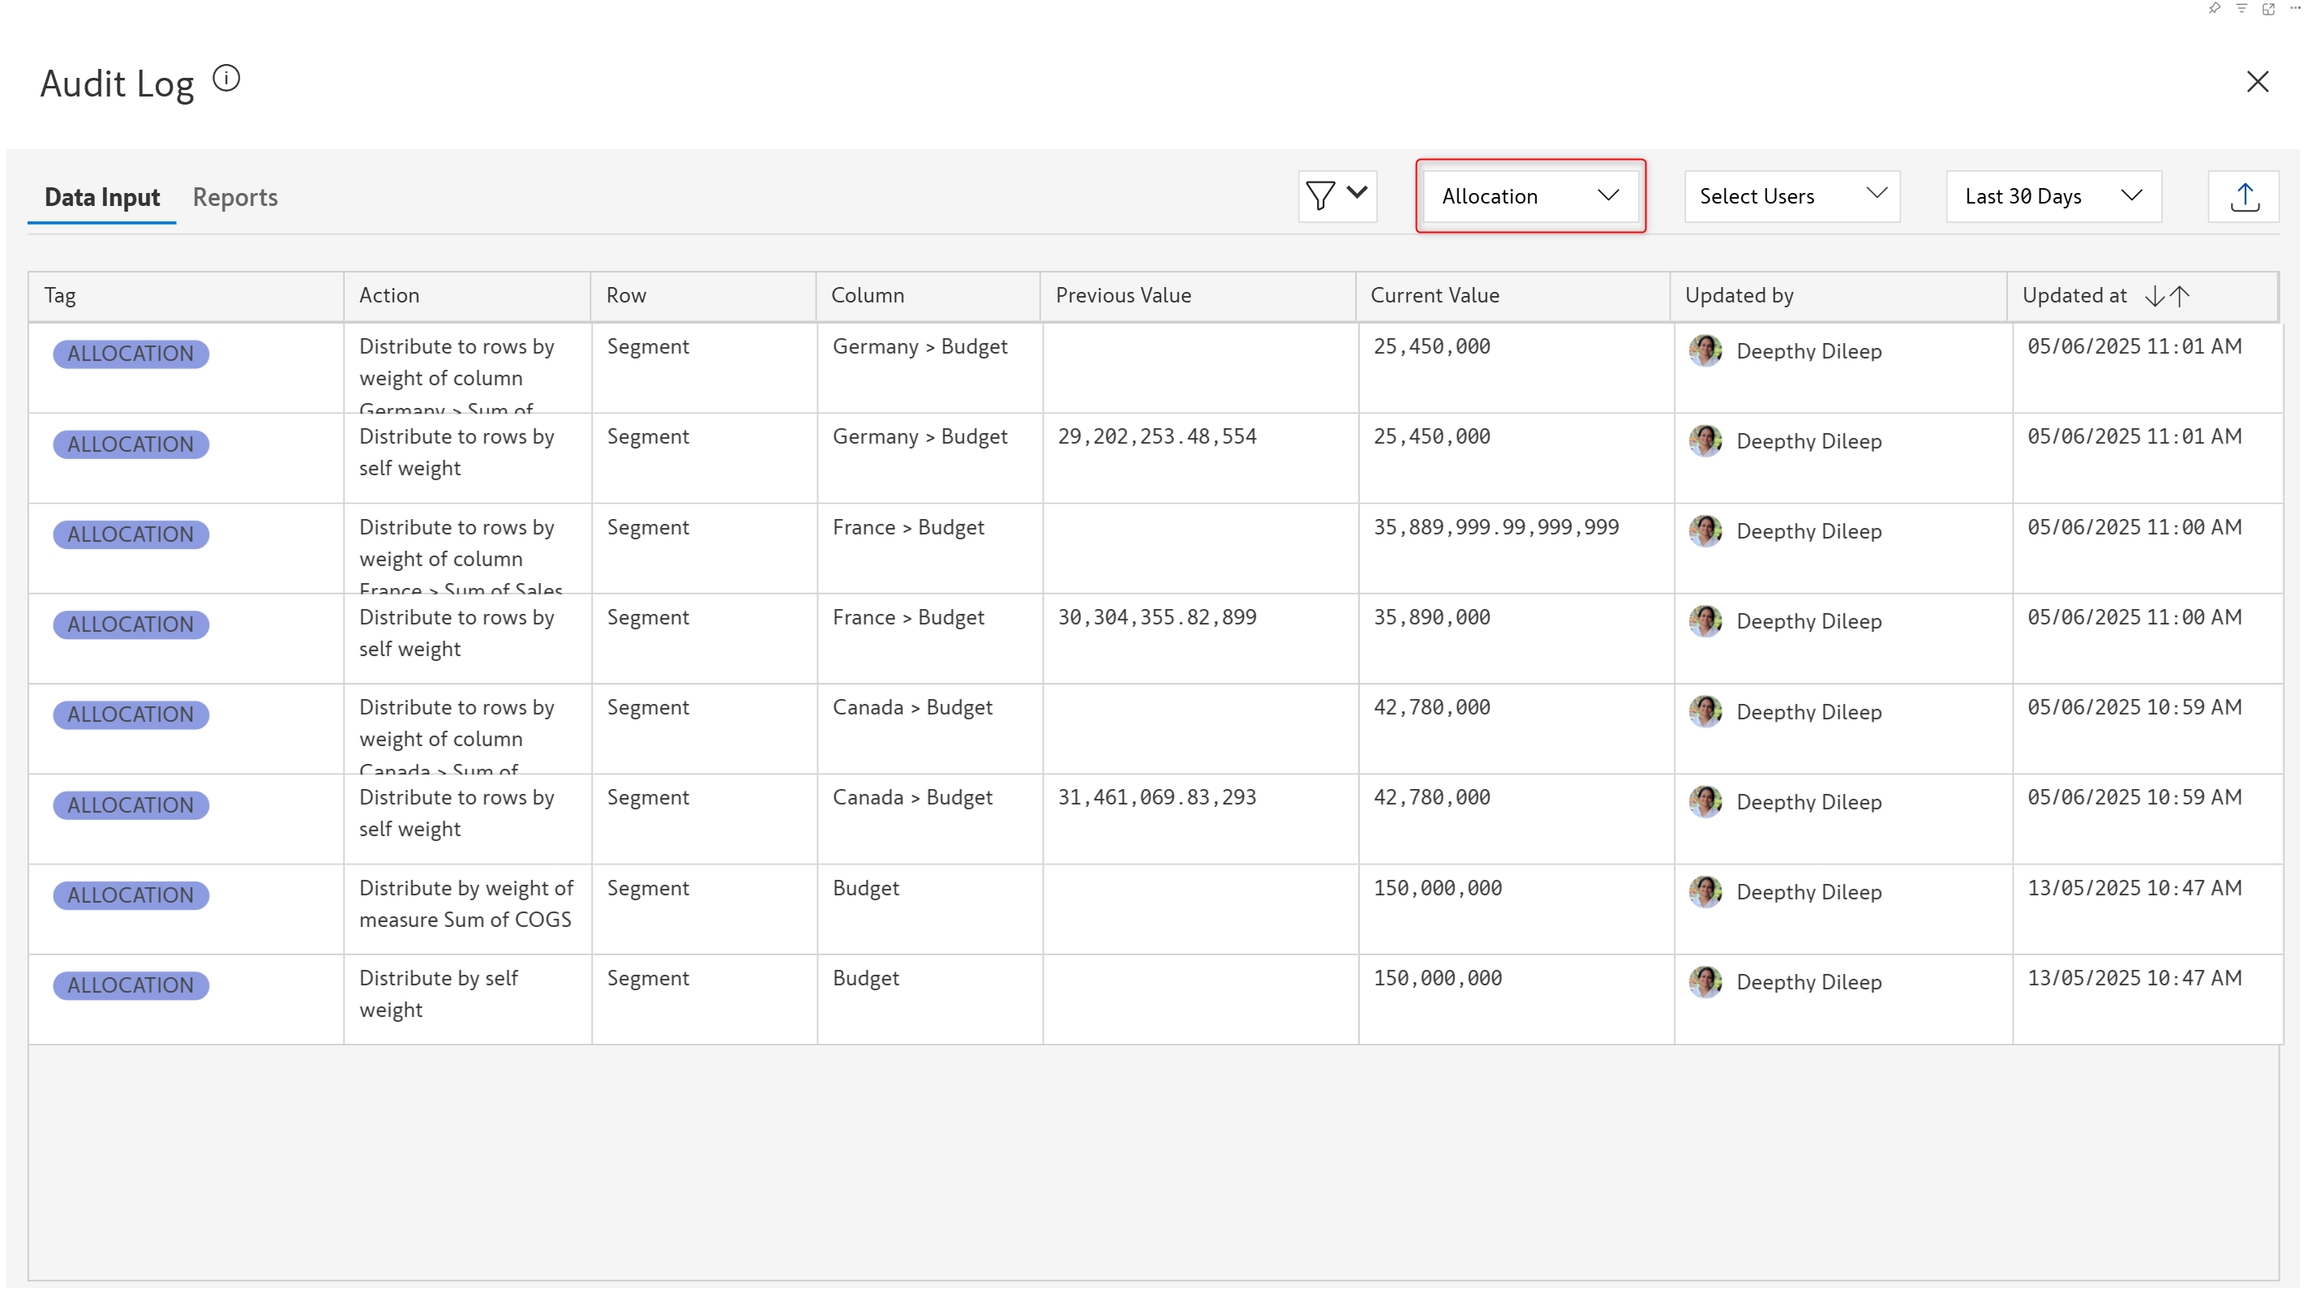
1.2. Allocation
Select 'Allocation' from the dropdown. Captures how a value entered in a parent cell is distributed to its descendants.
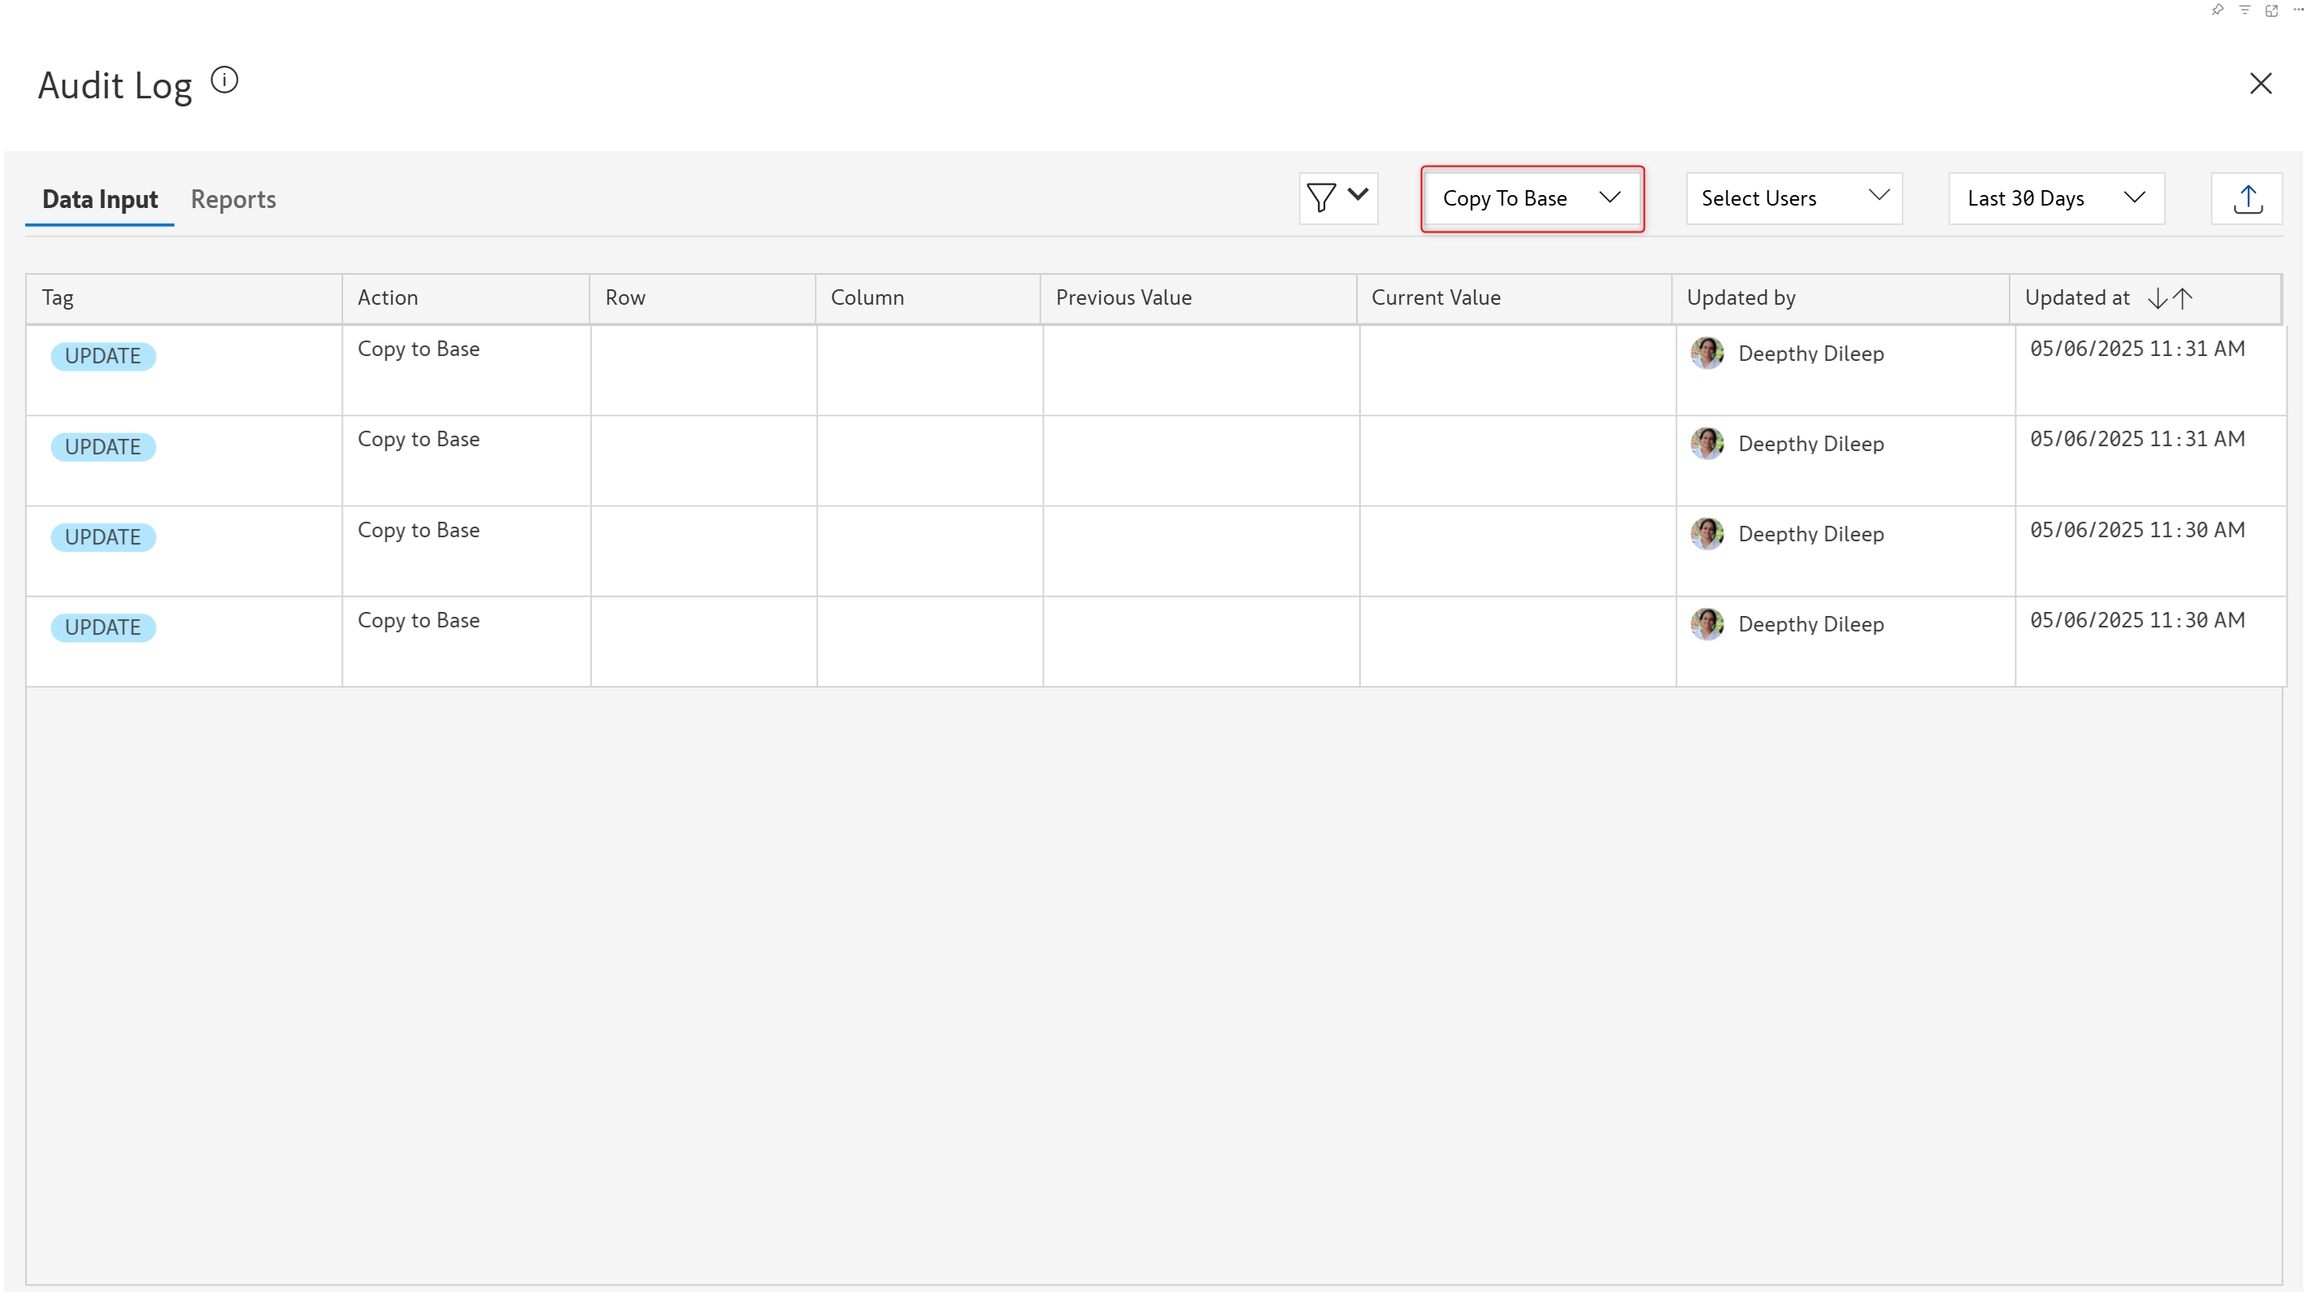
1.3. Copy to base
Captures the user and maintains a record of when simulations run in a scenario are copied to base.
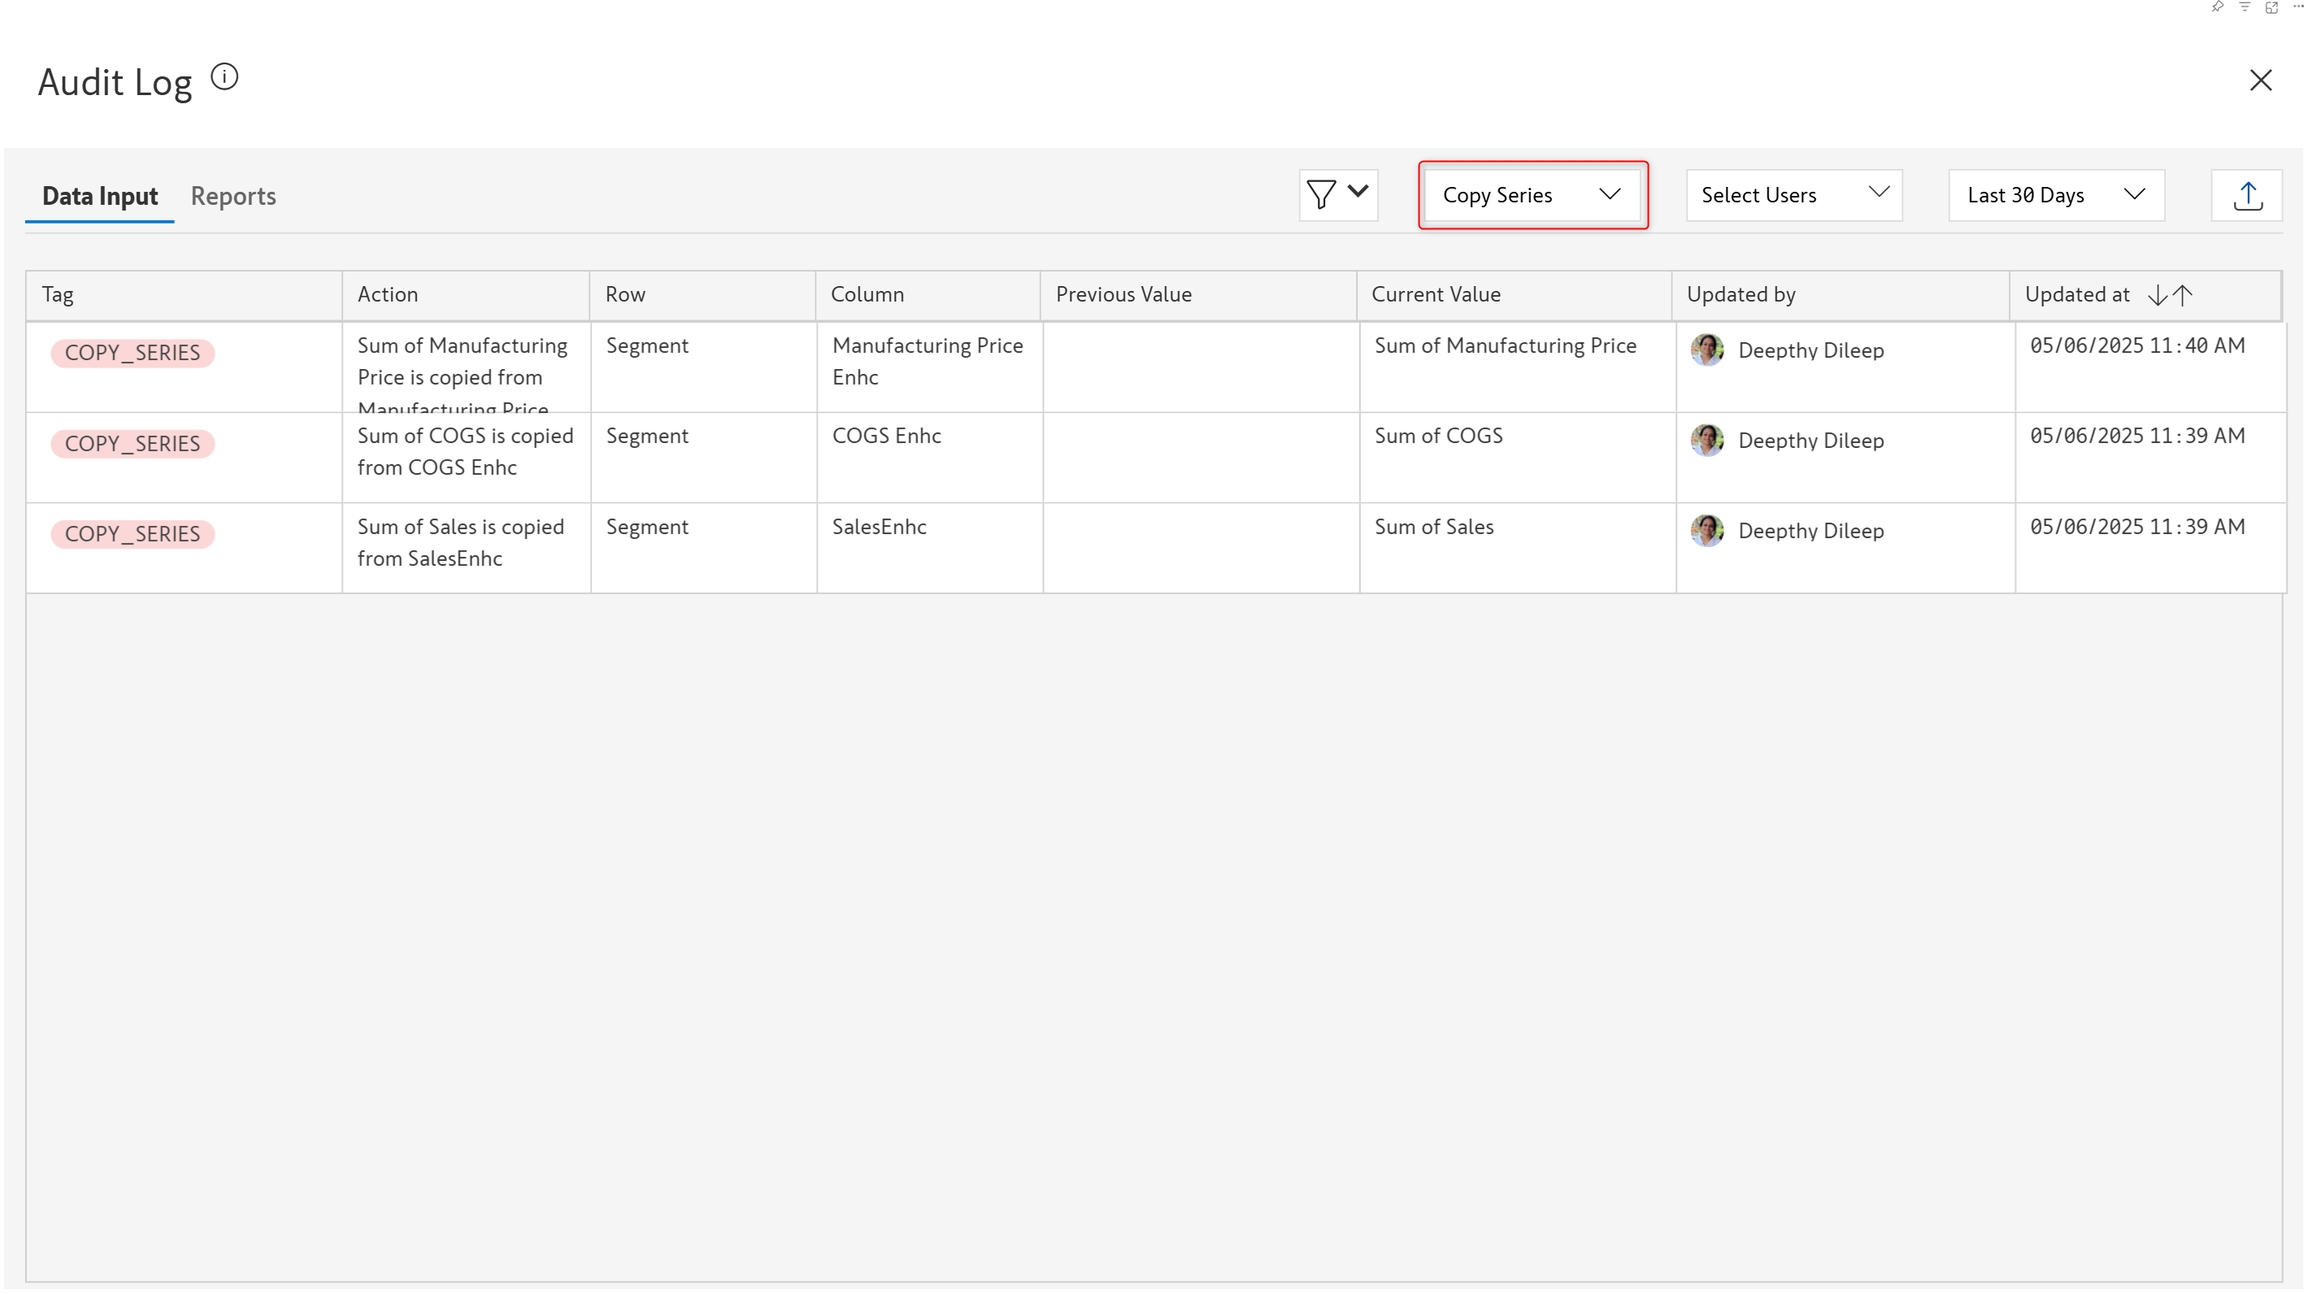
1.4. Copy series
Captures numeric data inputs that are sourced from existing fields using the Copy from another series option.
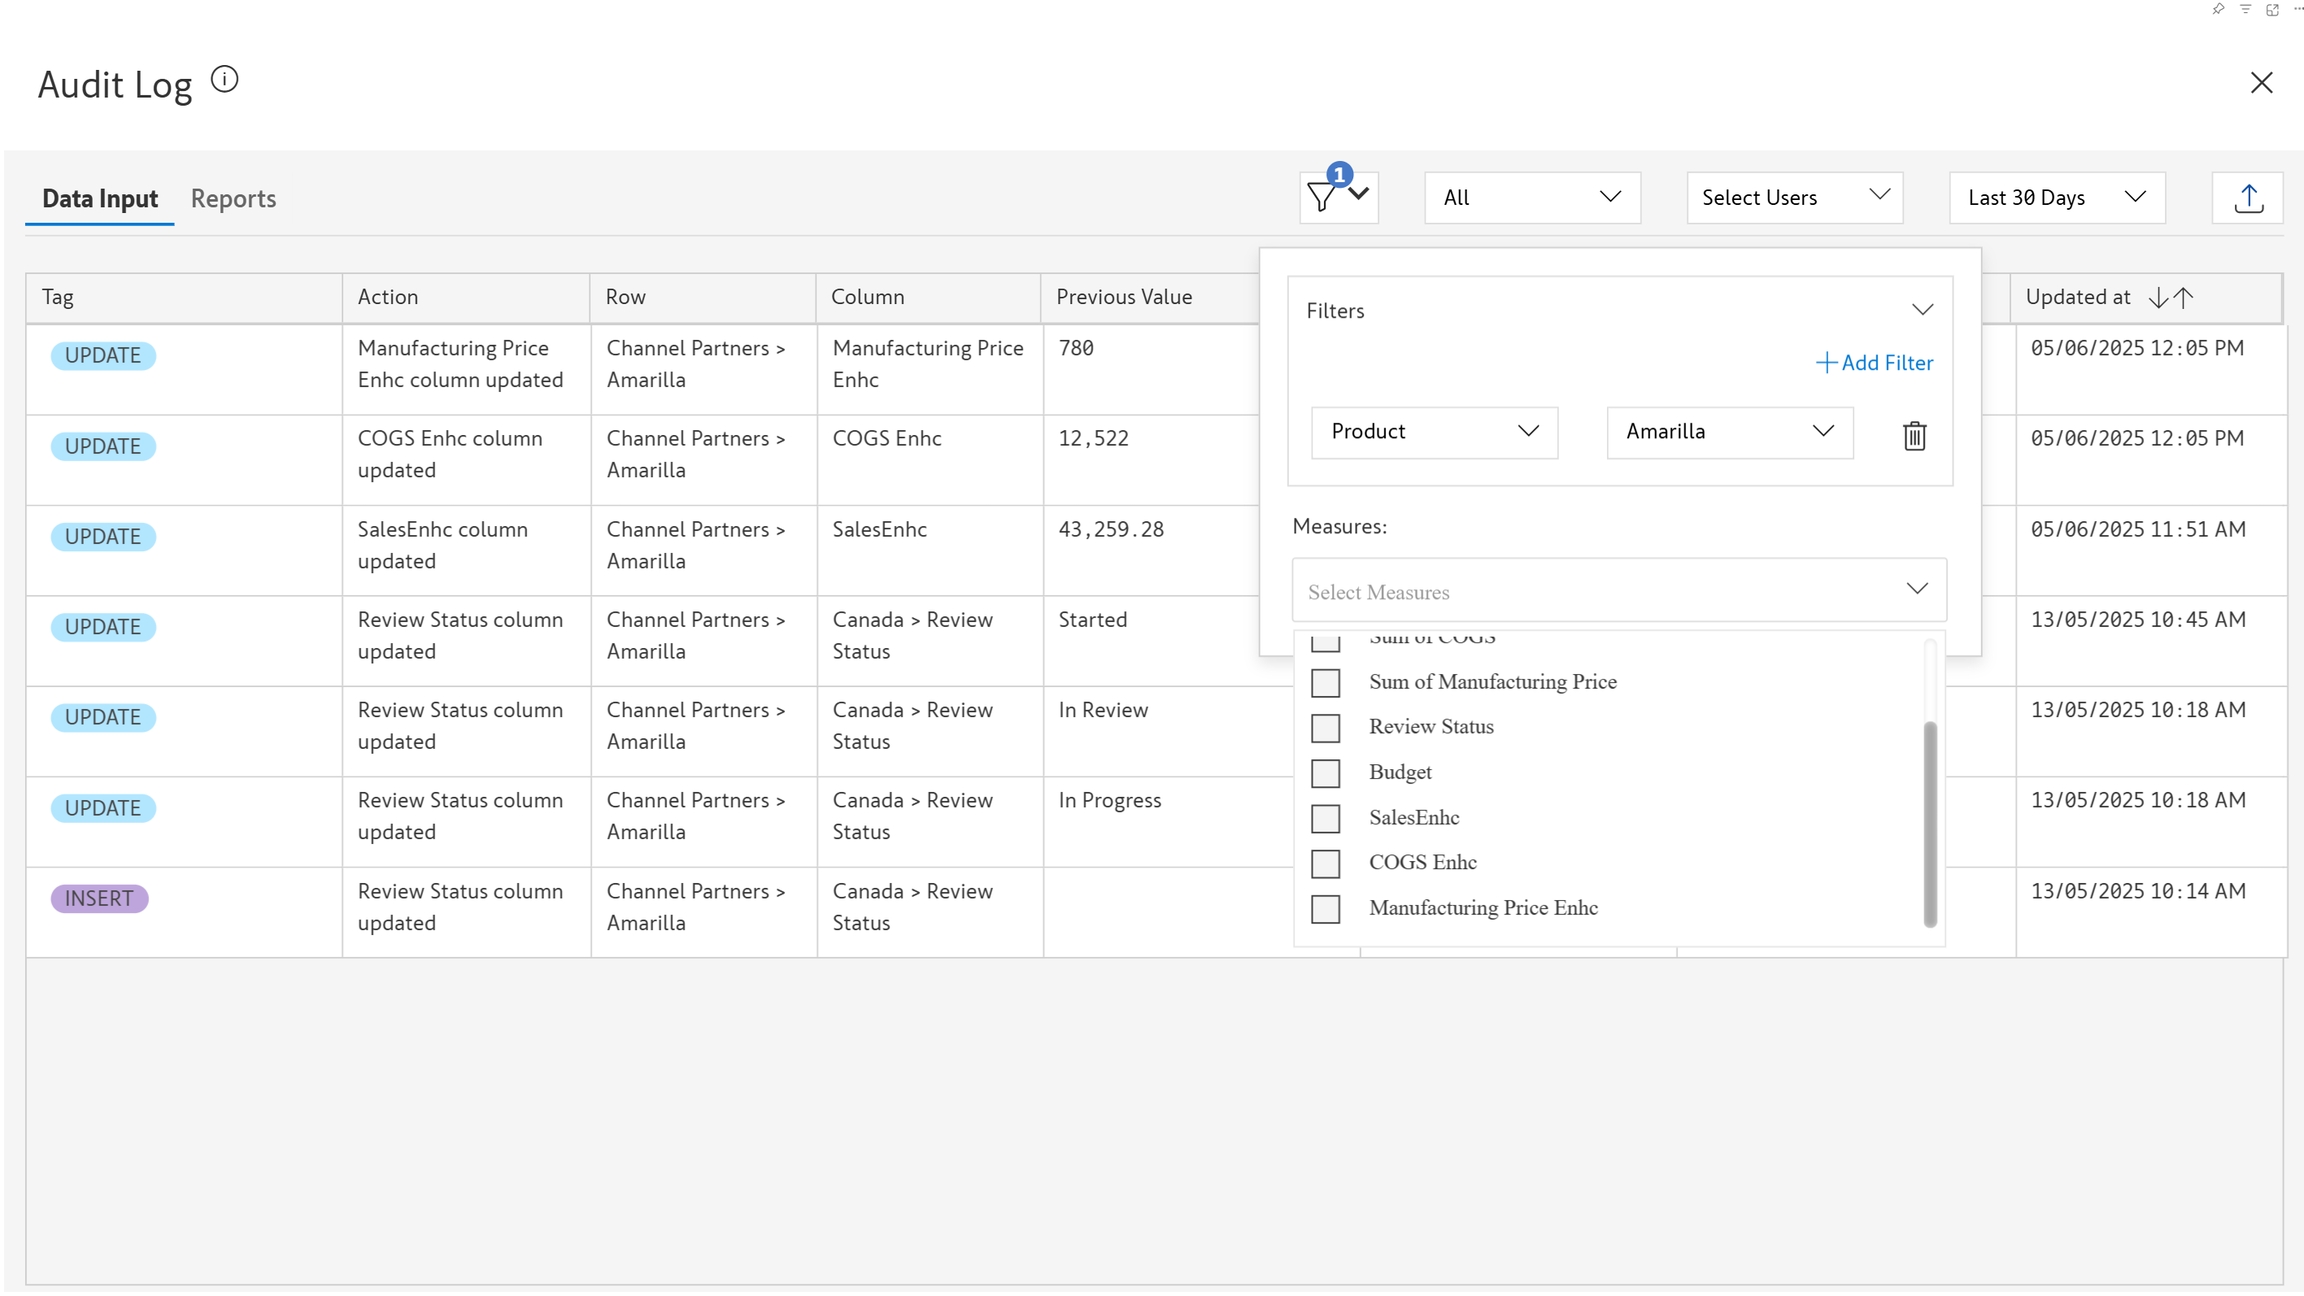
1.5. Filtering audit logs based on dimension categories and measures
Click the ![]() icon to filter the audit log based on row dimension categories or measures.
icon to filter the audit log based on row dimension categories or measures.
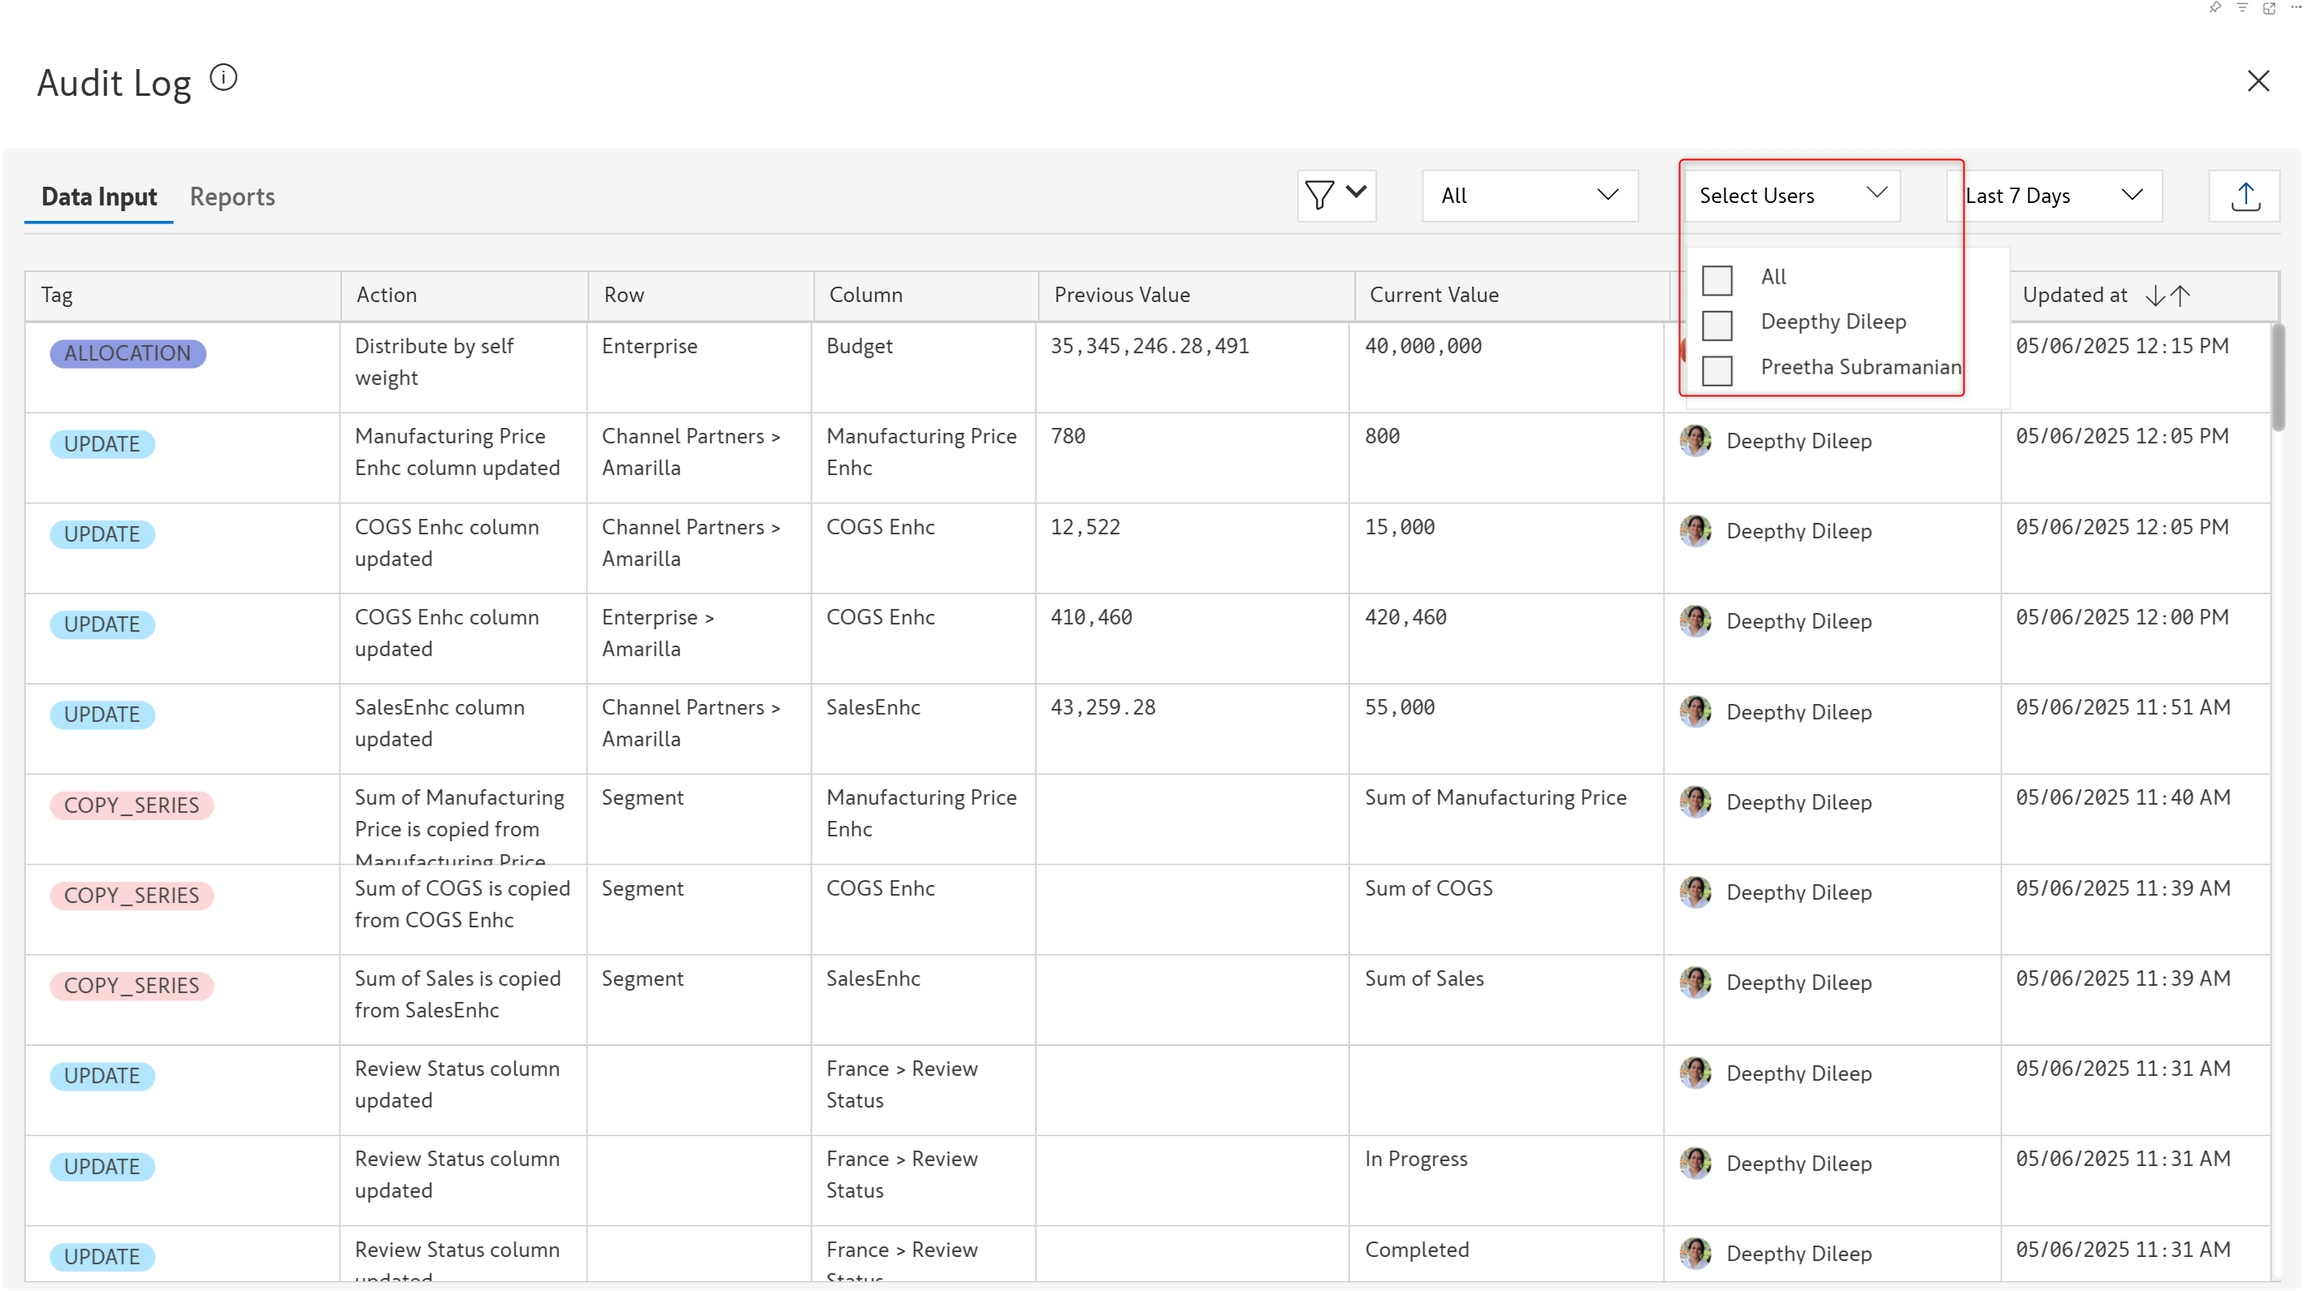
1.6. Filtering audit logs based on user
When you have multiple users entering and updating values in a data input field, you would need to track the changes made by each user. You can filter the data entry audit log based on the username. View the changes made by specific users by selecting them from the dropdown.
1.7. Sorting and filtering audit logs based on date
View audit trail for the past week, past month, or a specified time range.
You can sort the Updated at field in ascending or descending order by clicking the![]() icon.
icon.
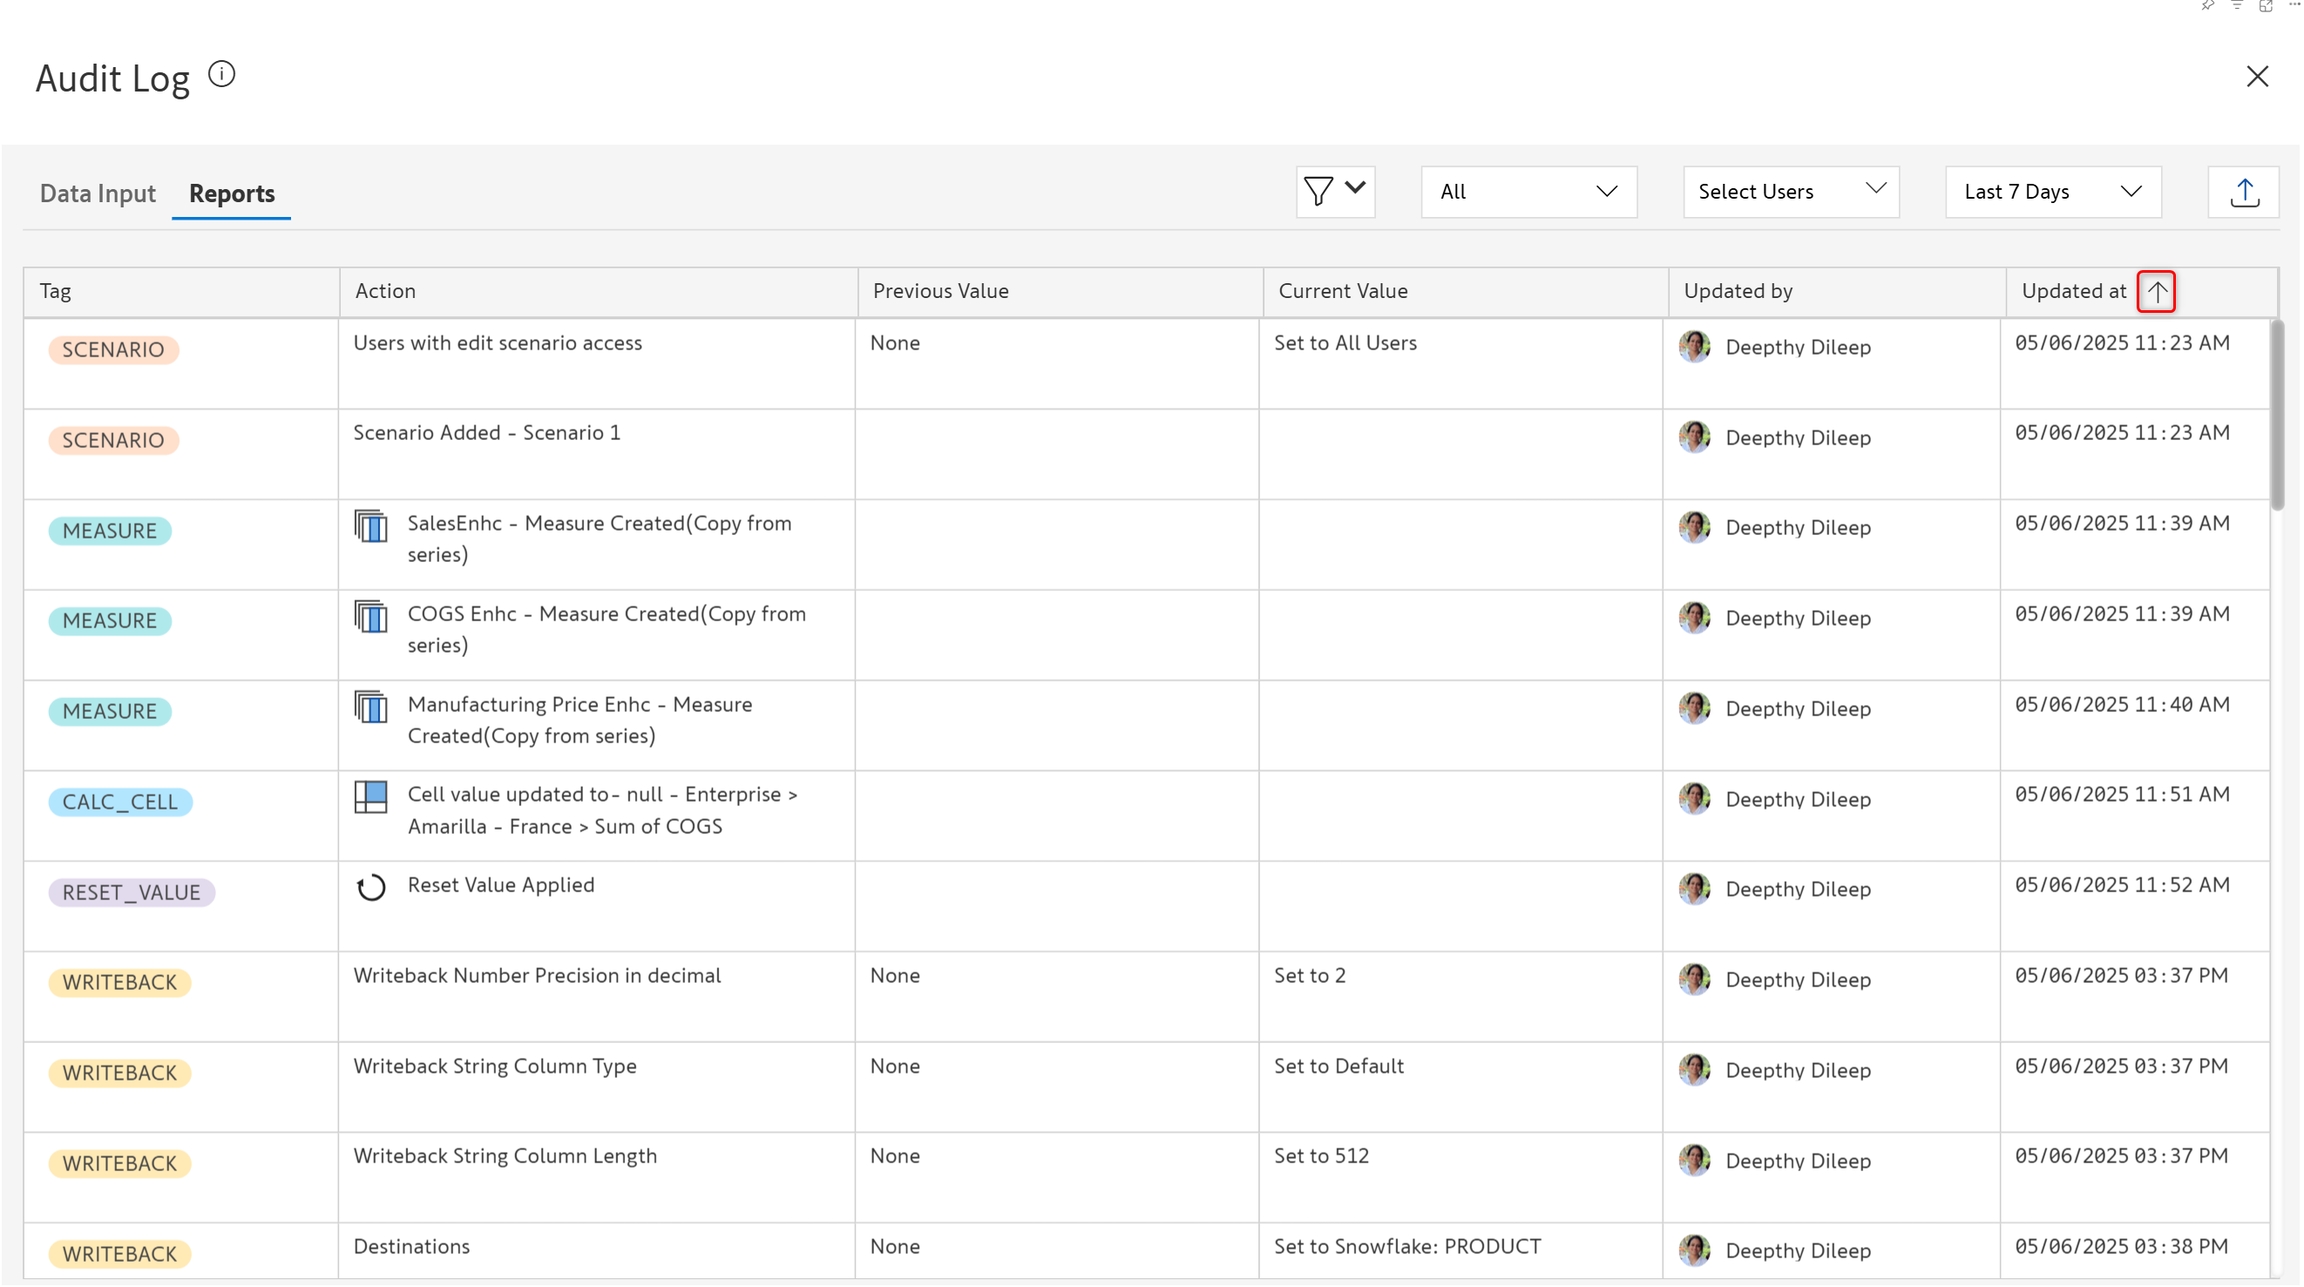
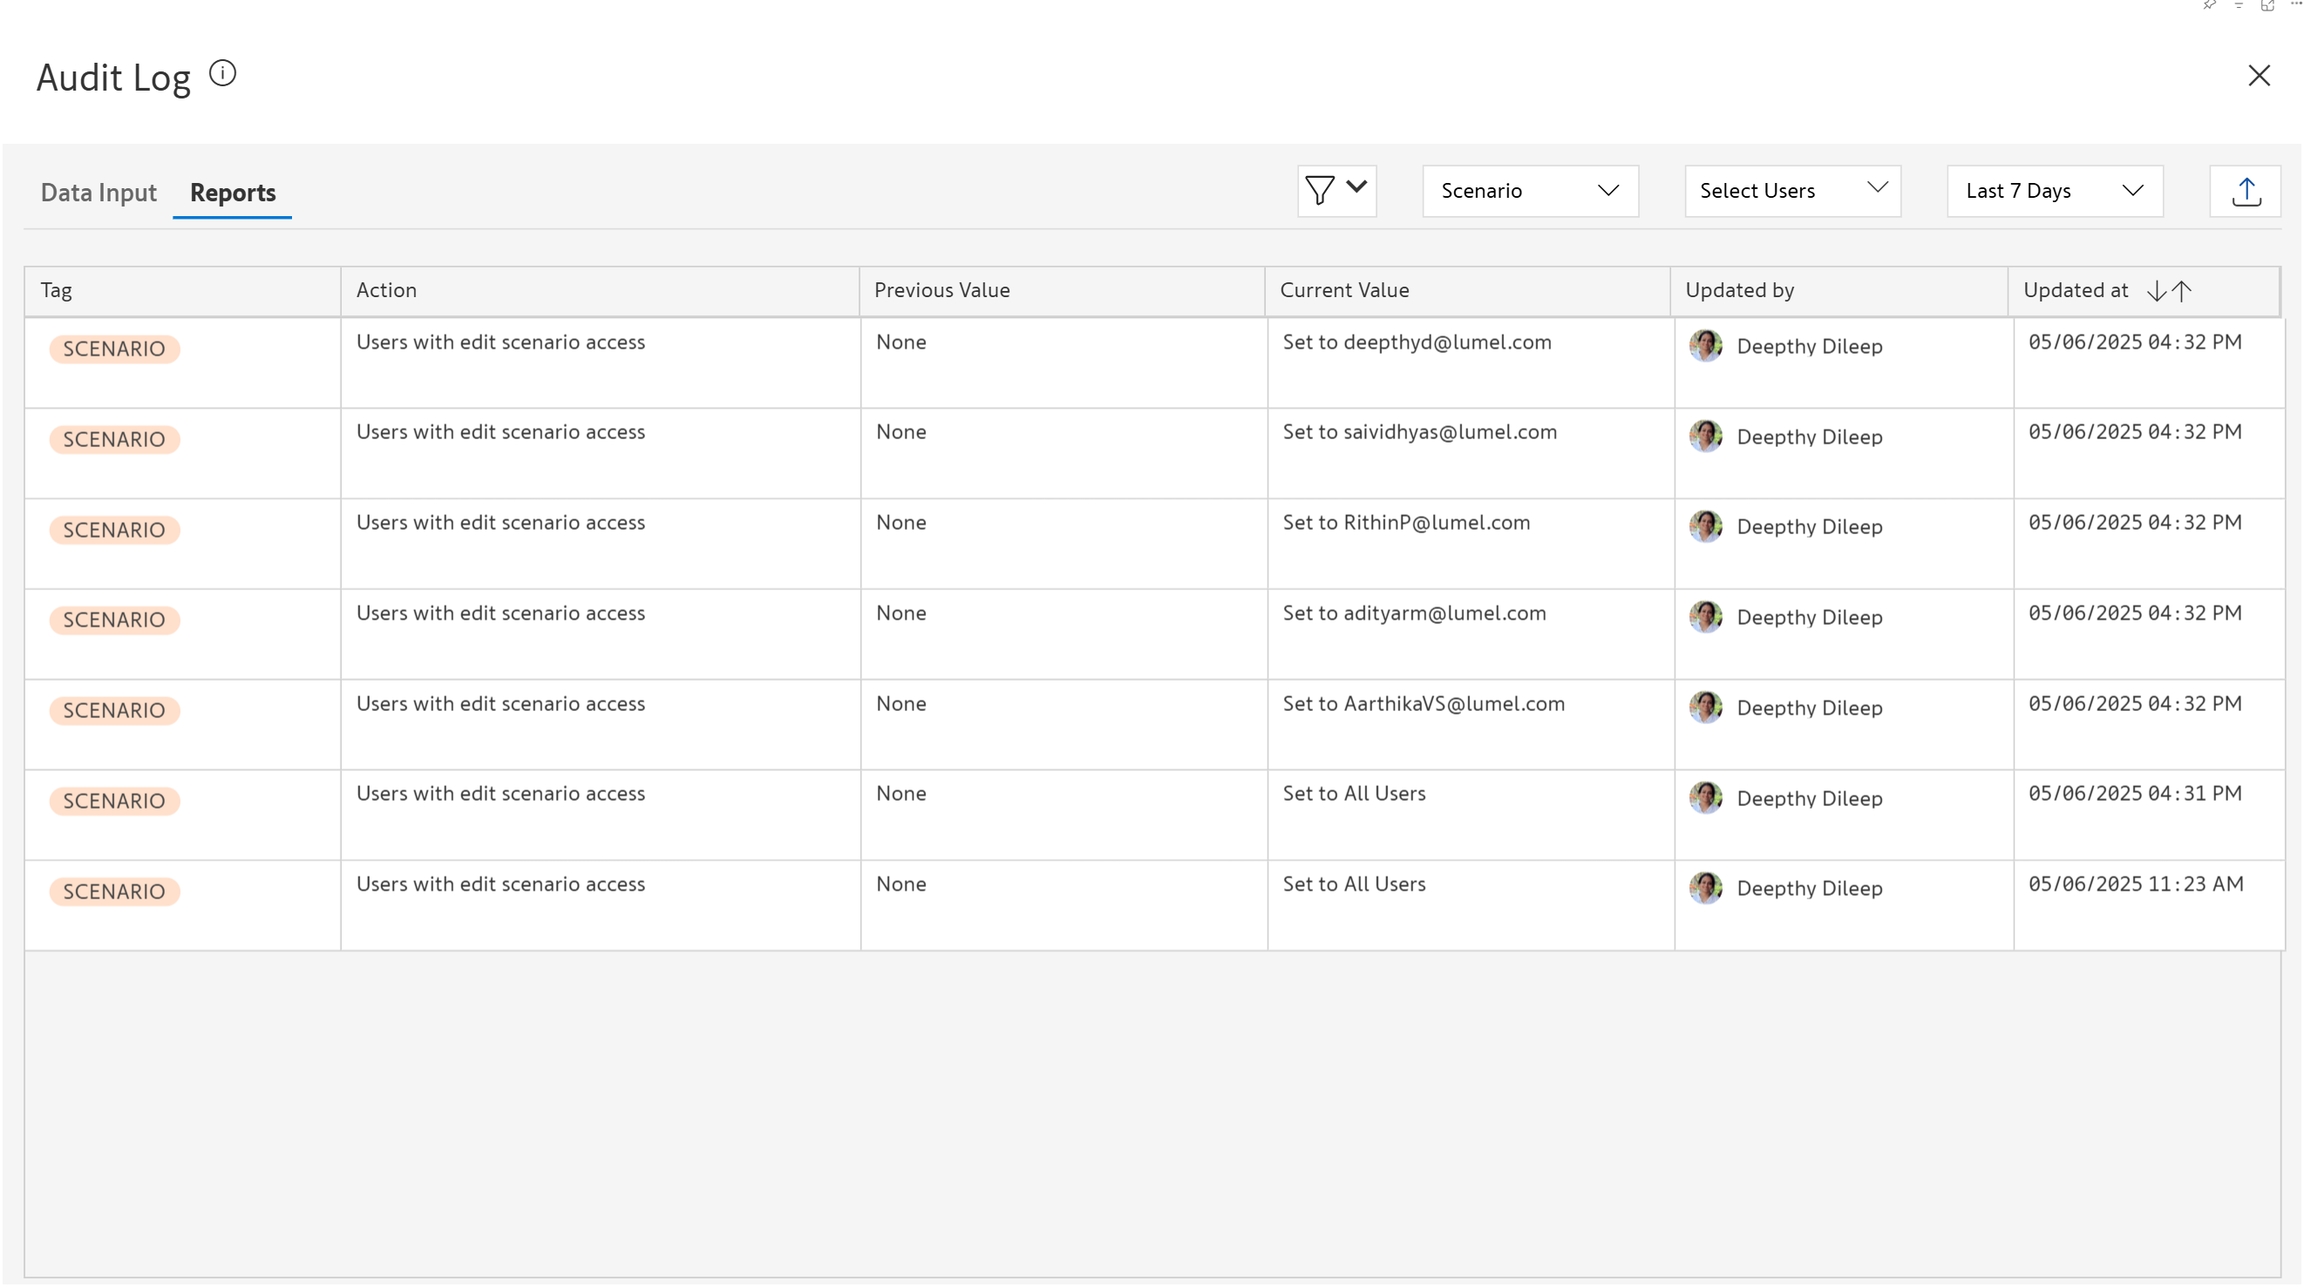
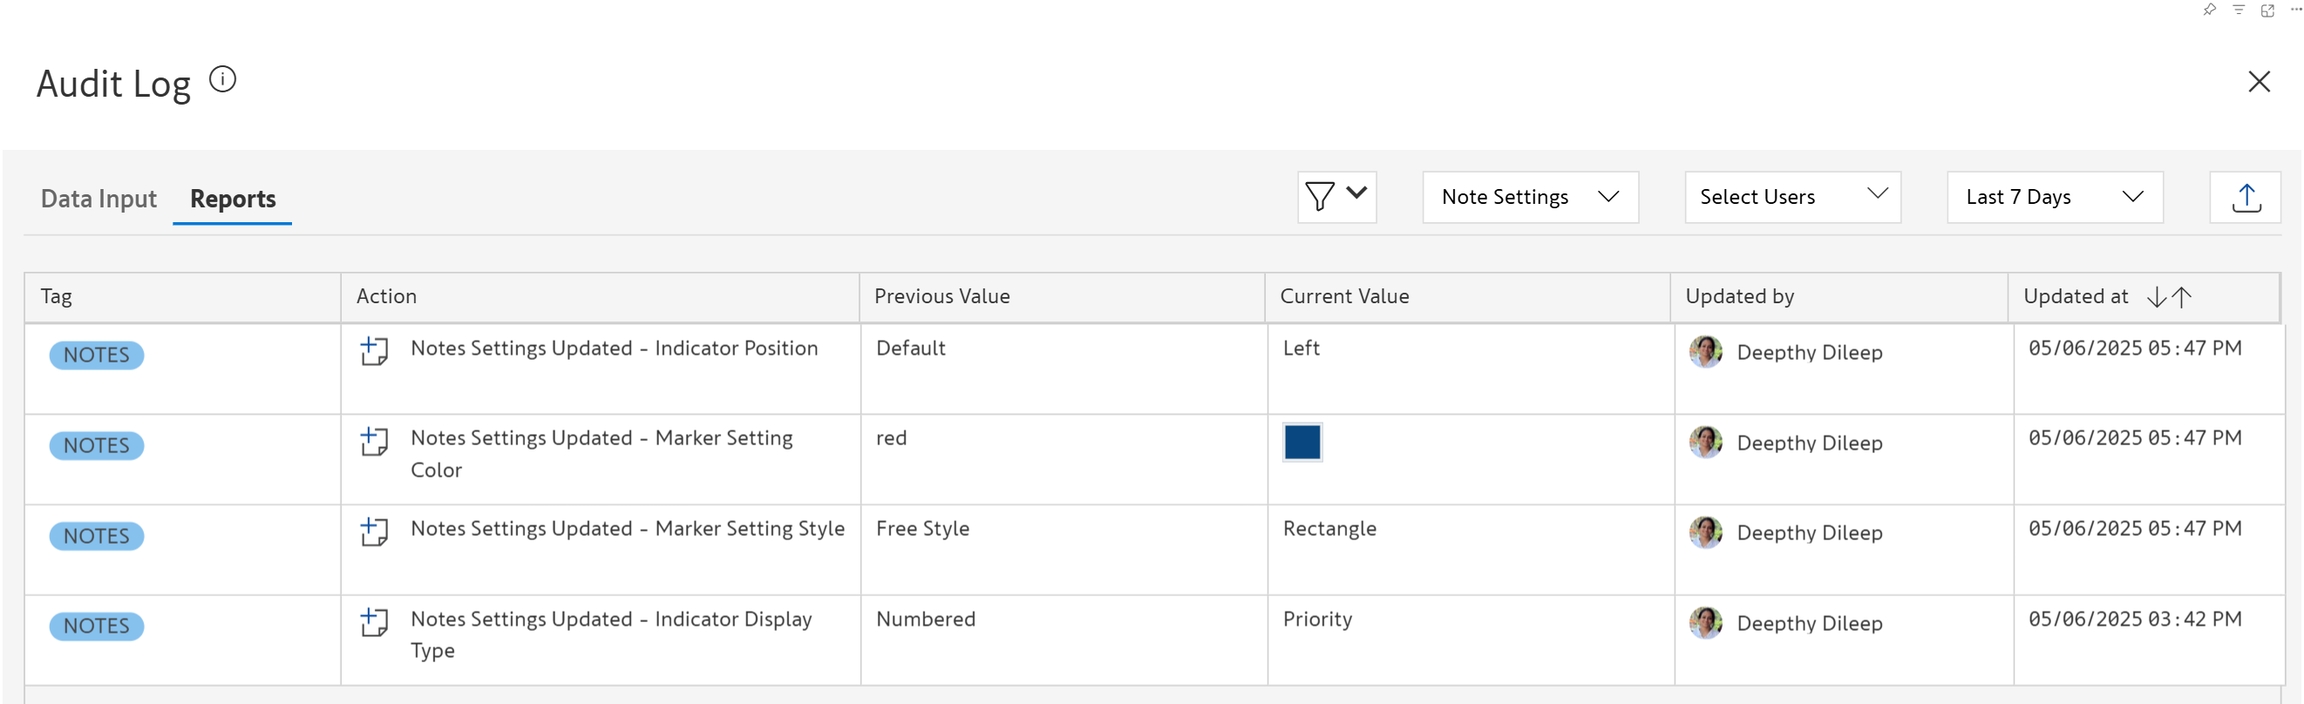
2. Reports tab
This tab captures actions such as changes to writeback settings, manage row/measure settings, display settings, or scenario settings.
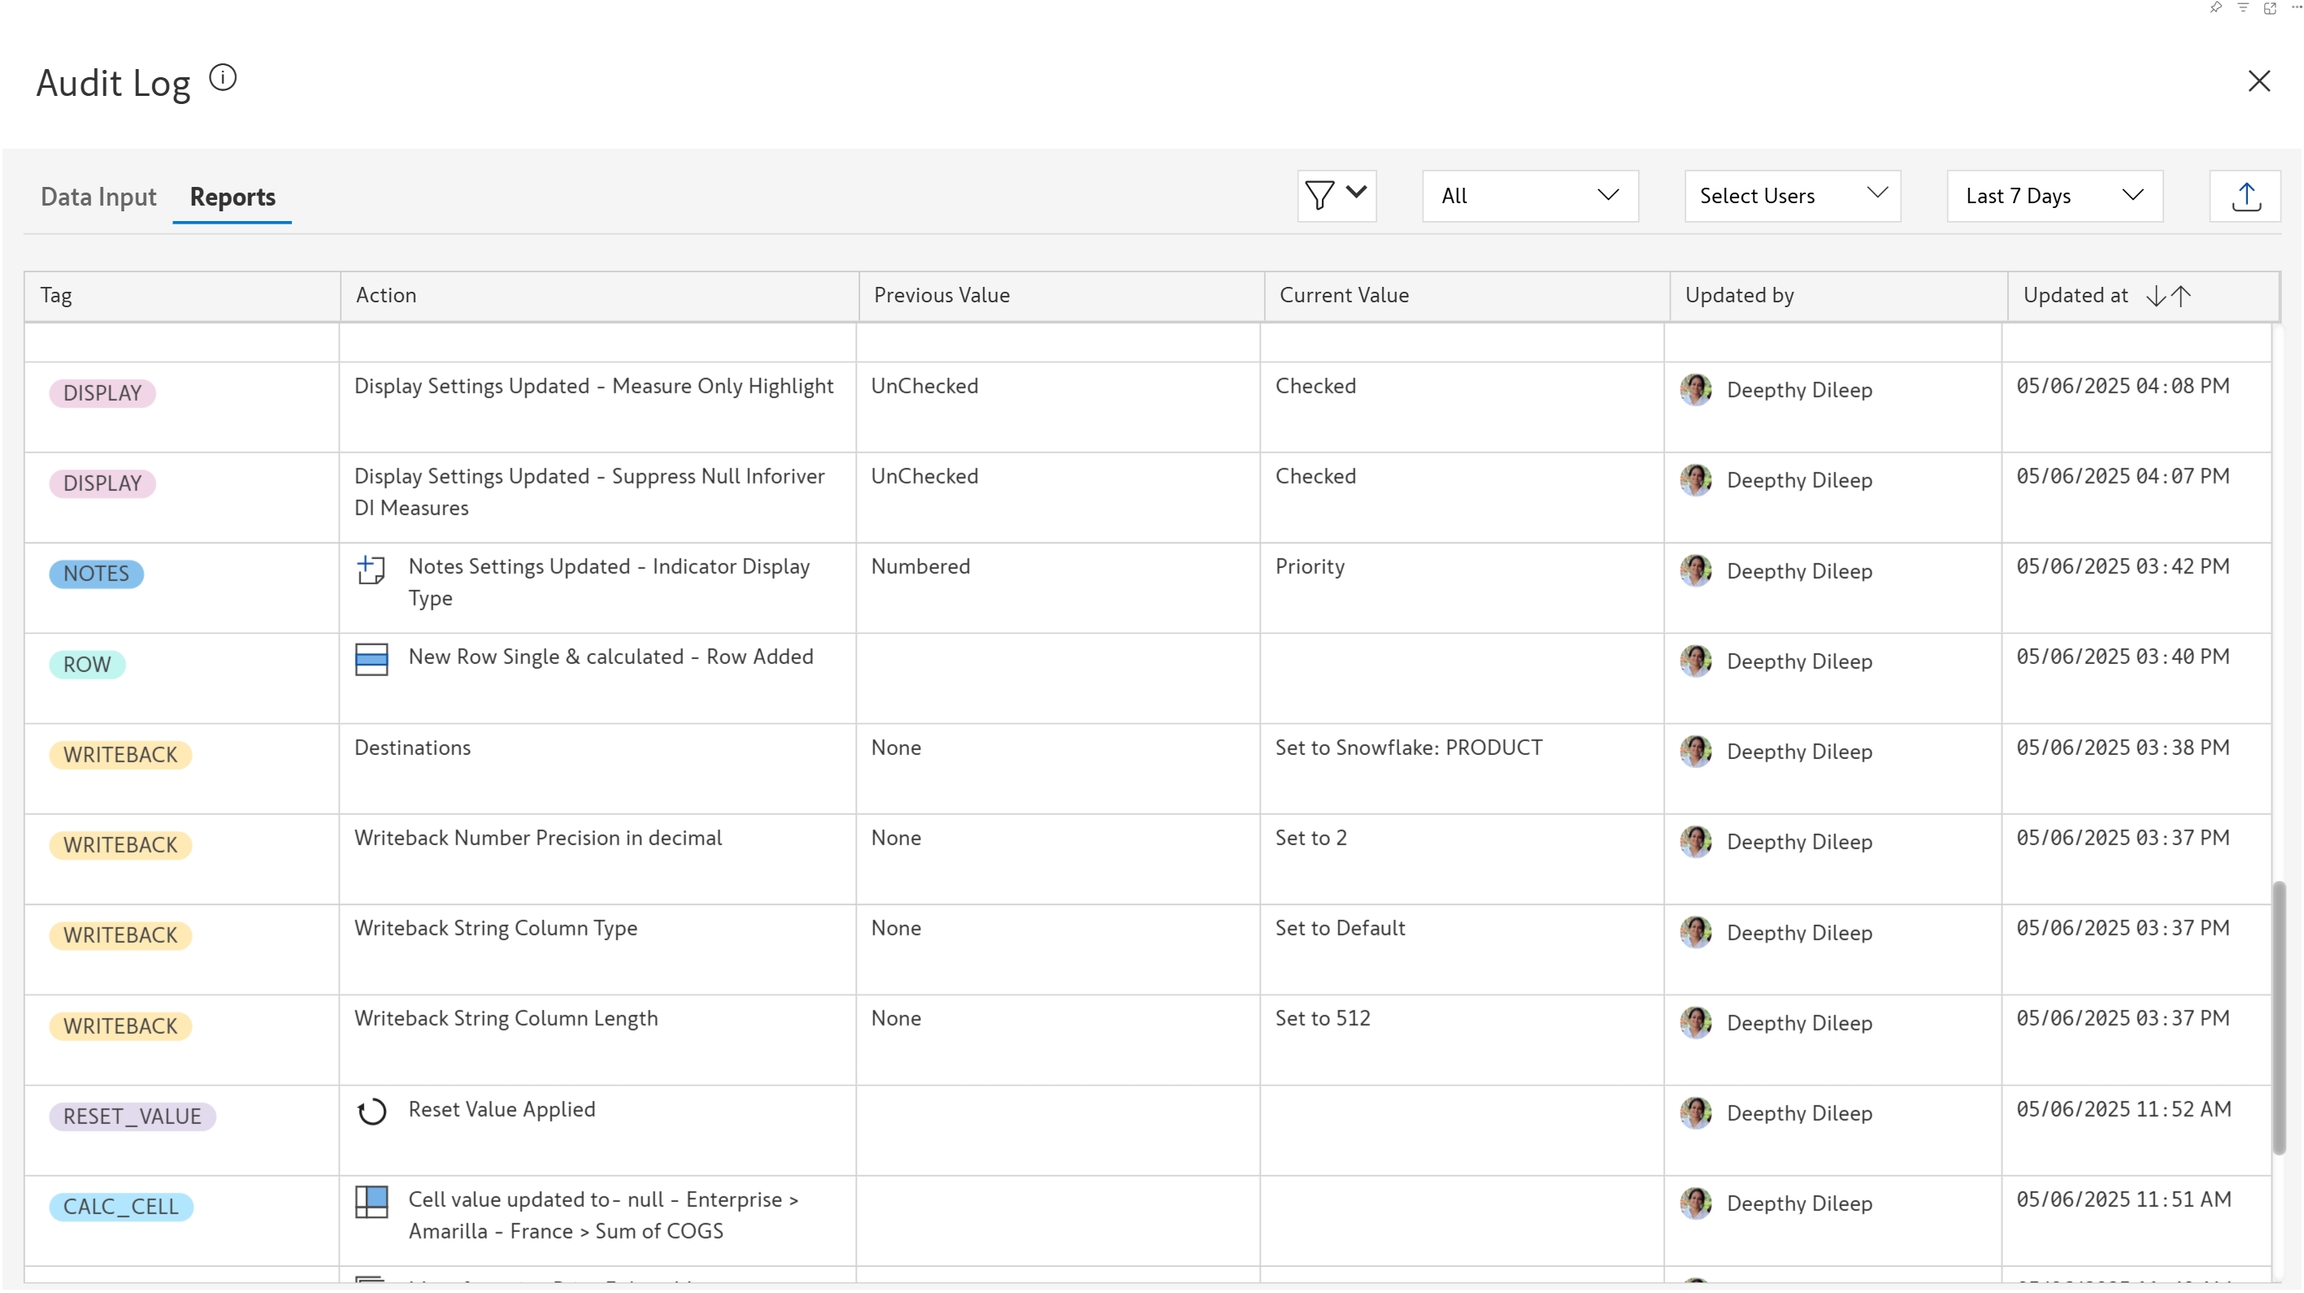
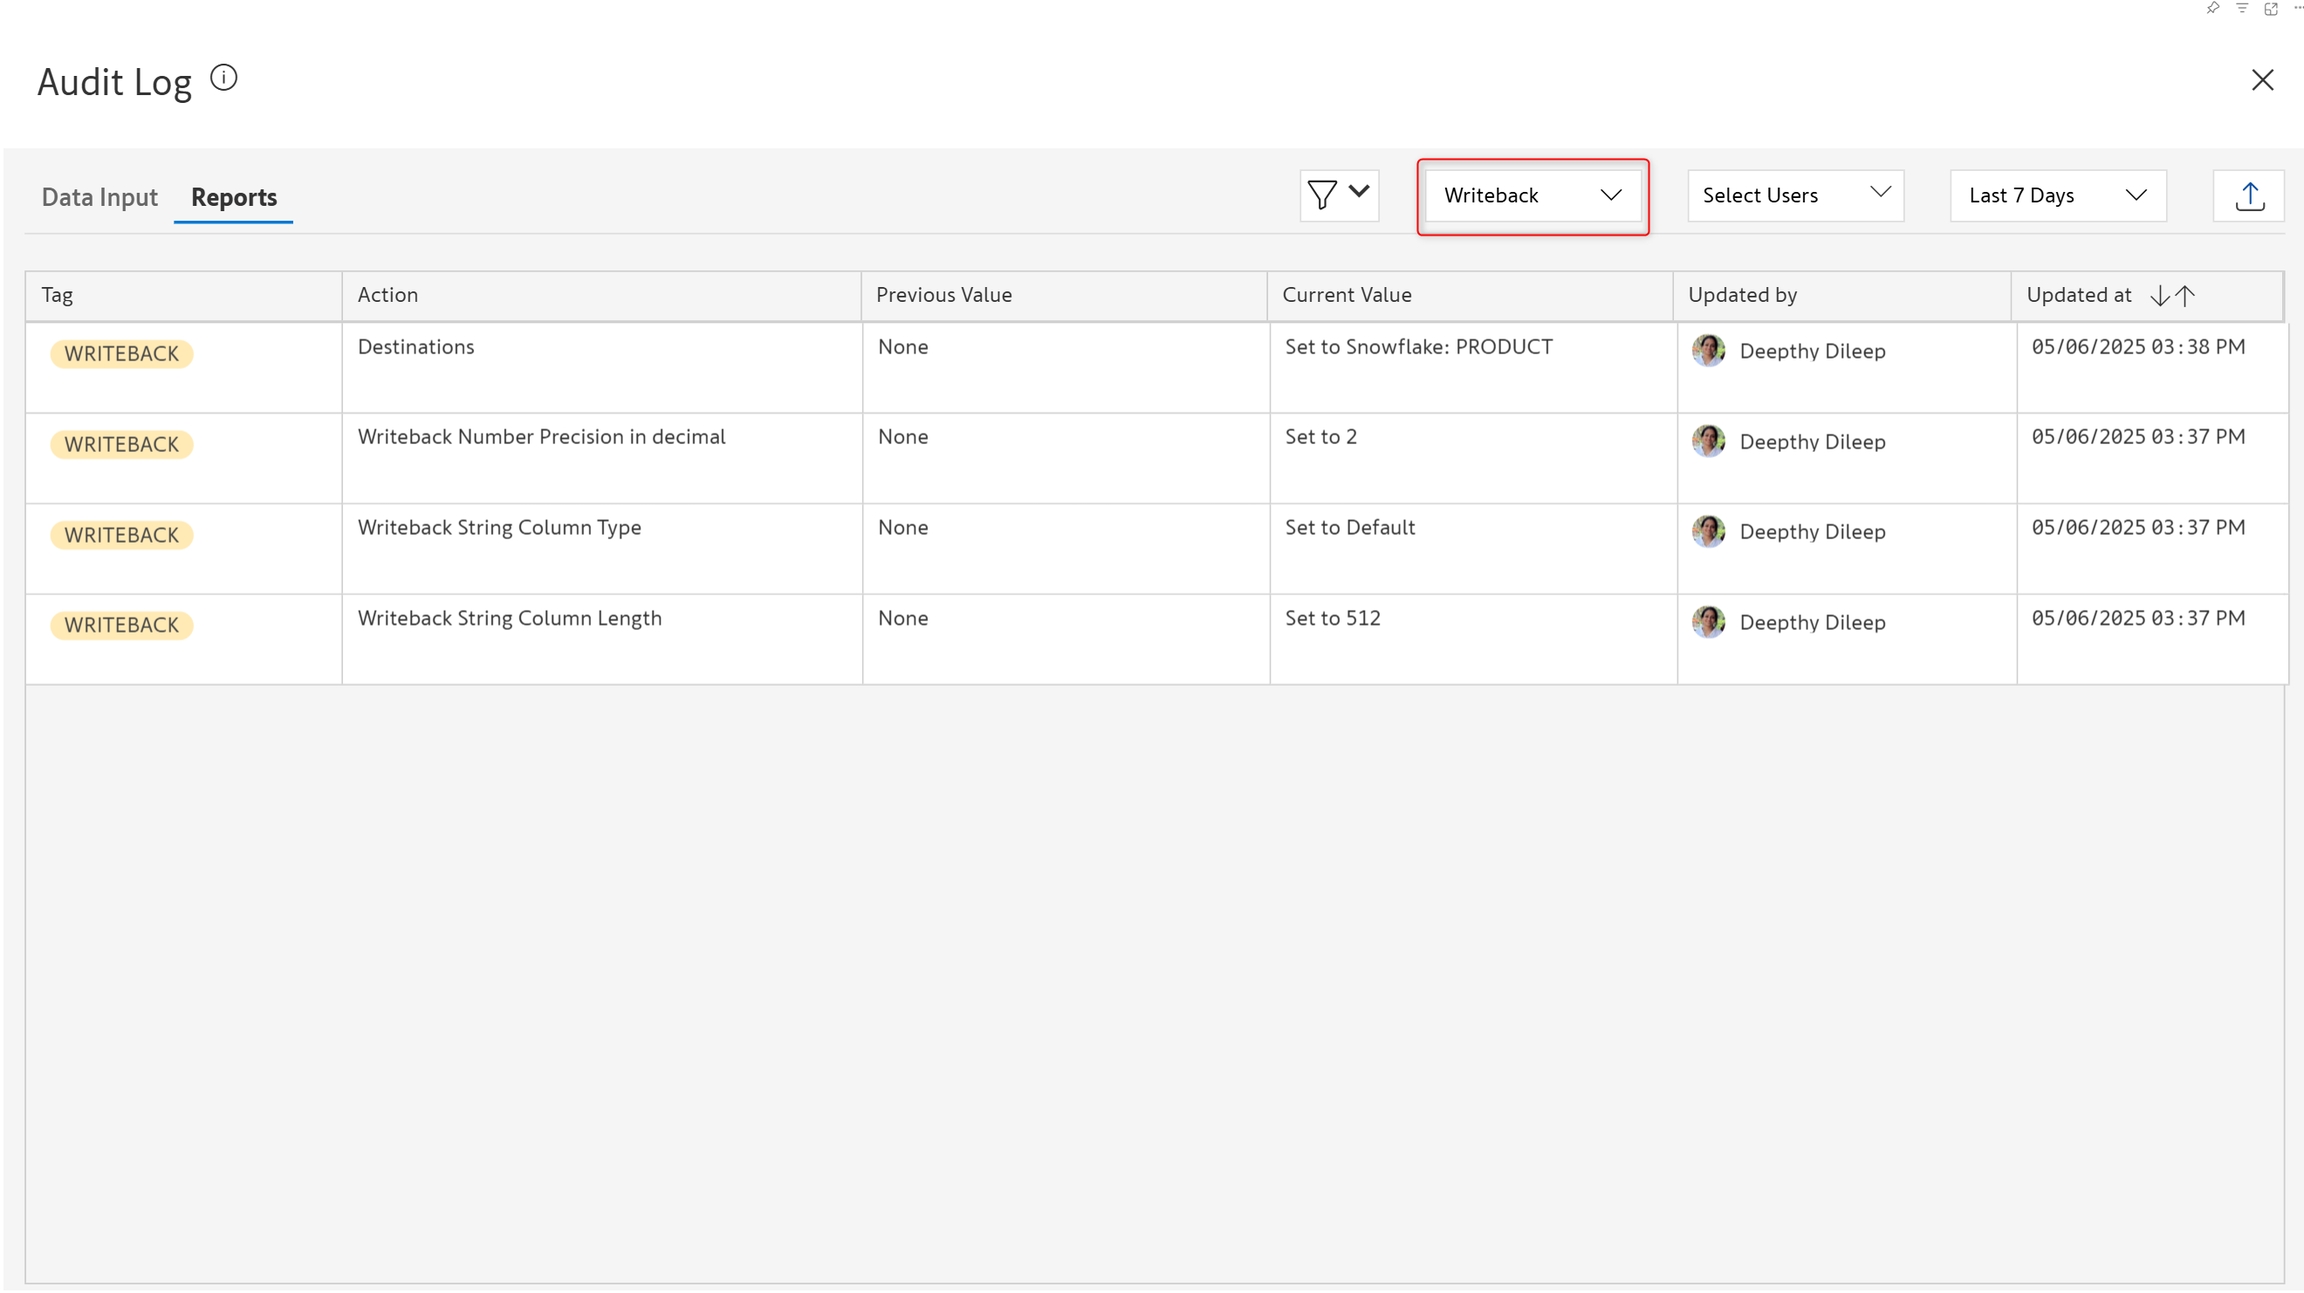
Just like we did for the Data Input tab, we can apply filters based on the type of change. Some examples are shown below.
Writeback settings
Scenario settings
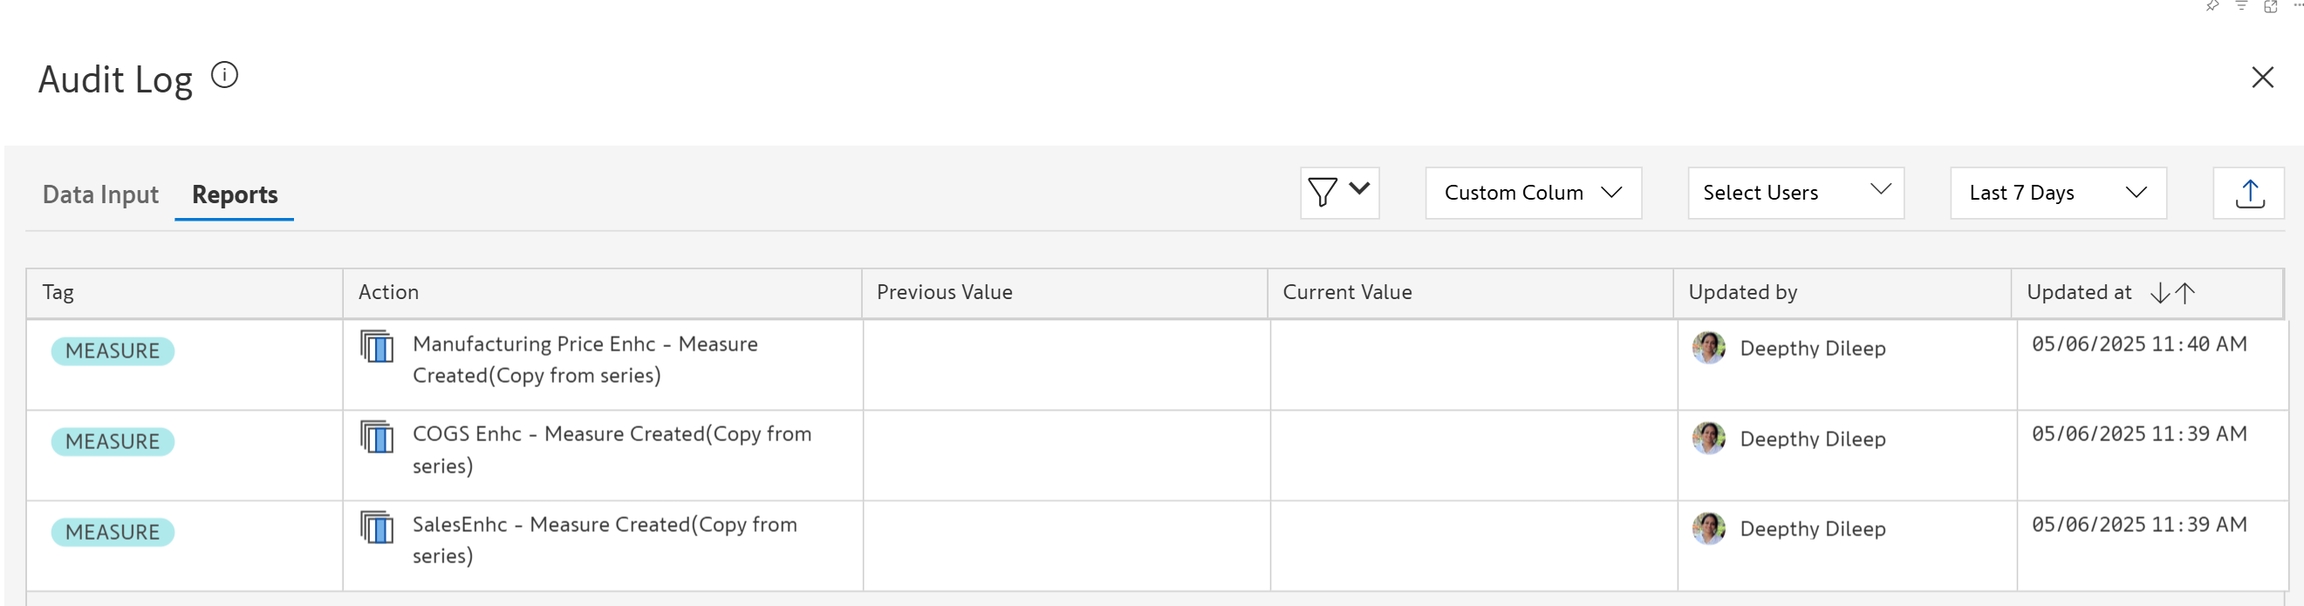
Custom column
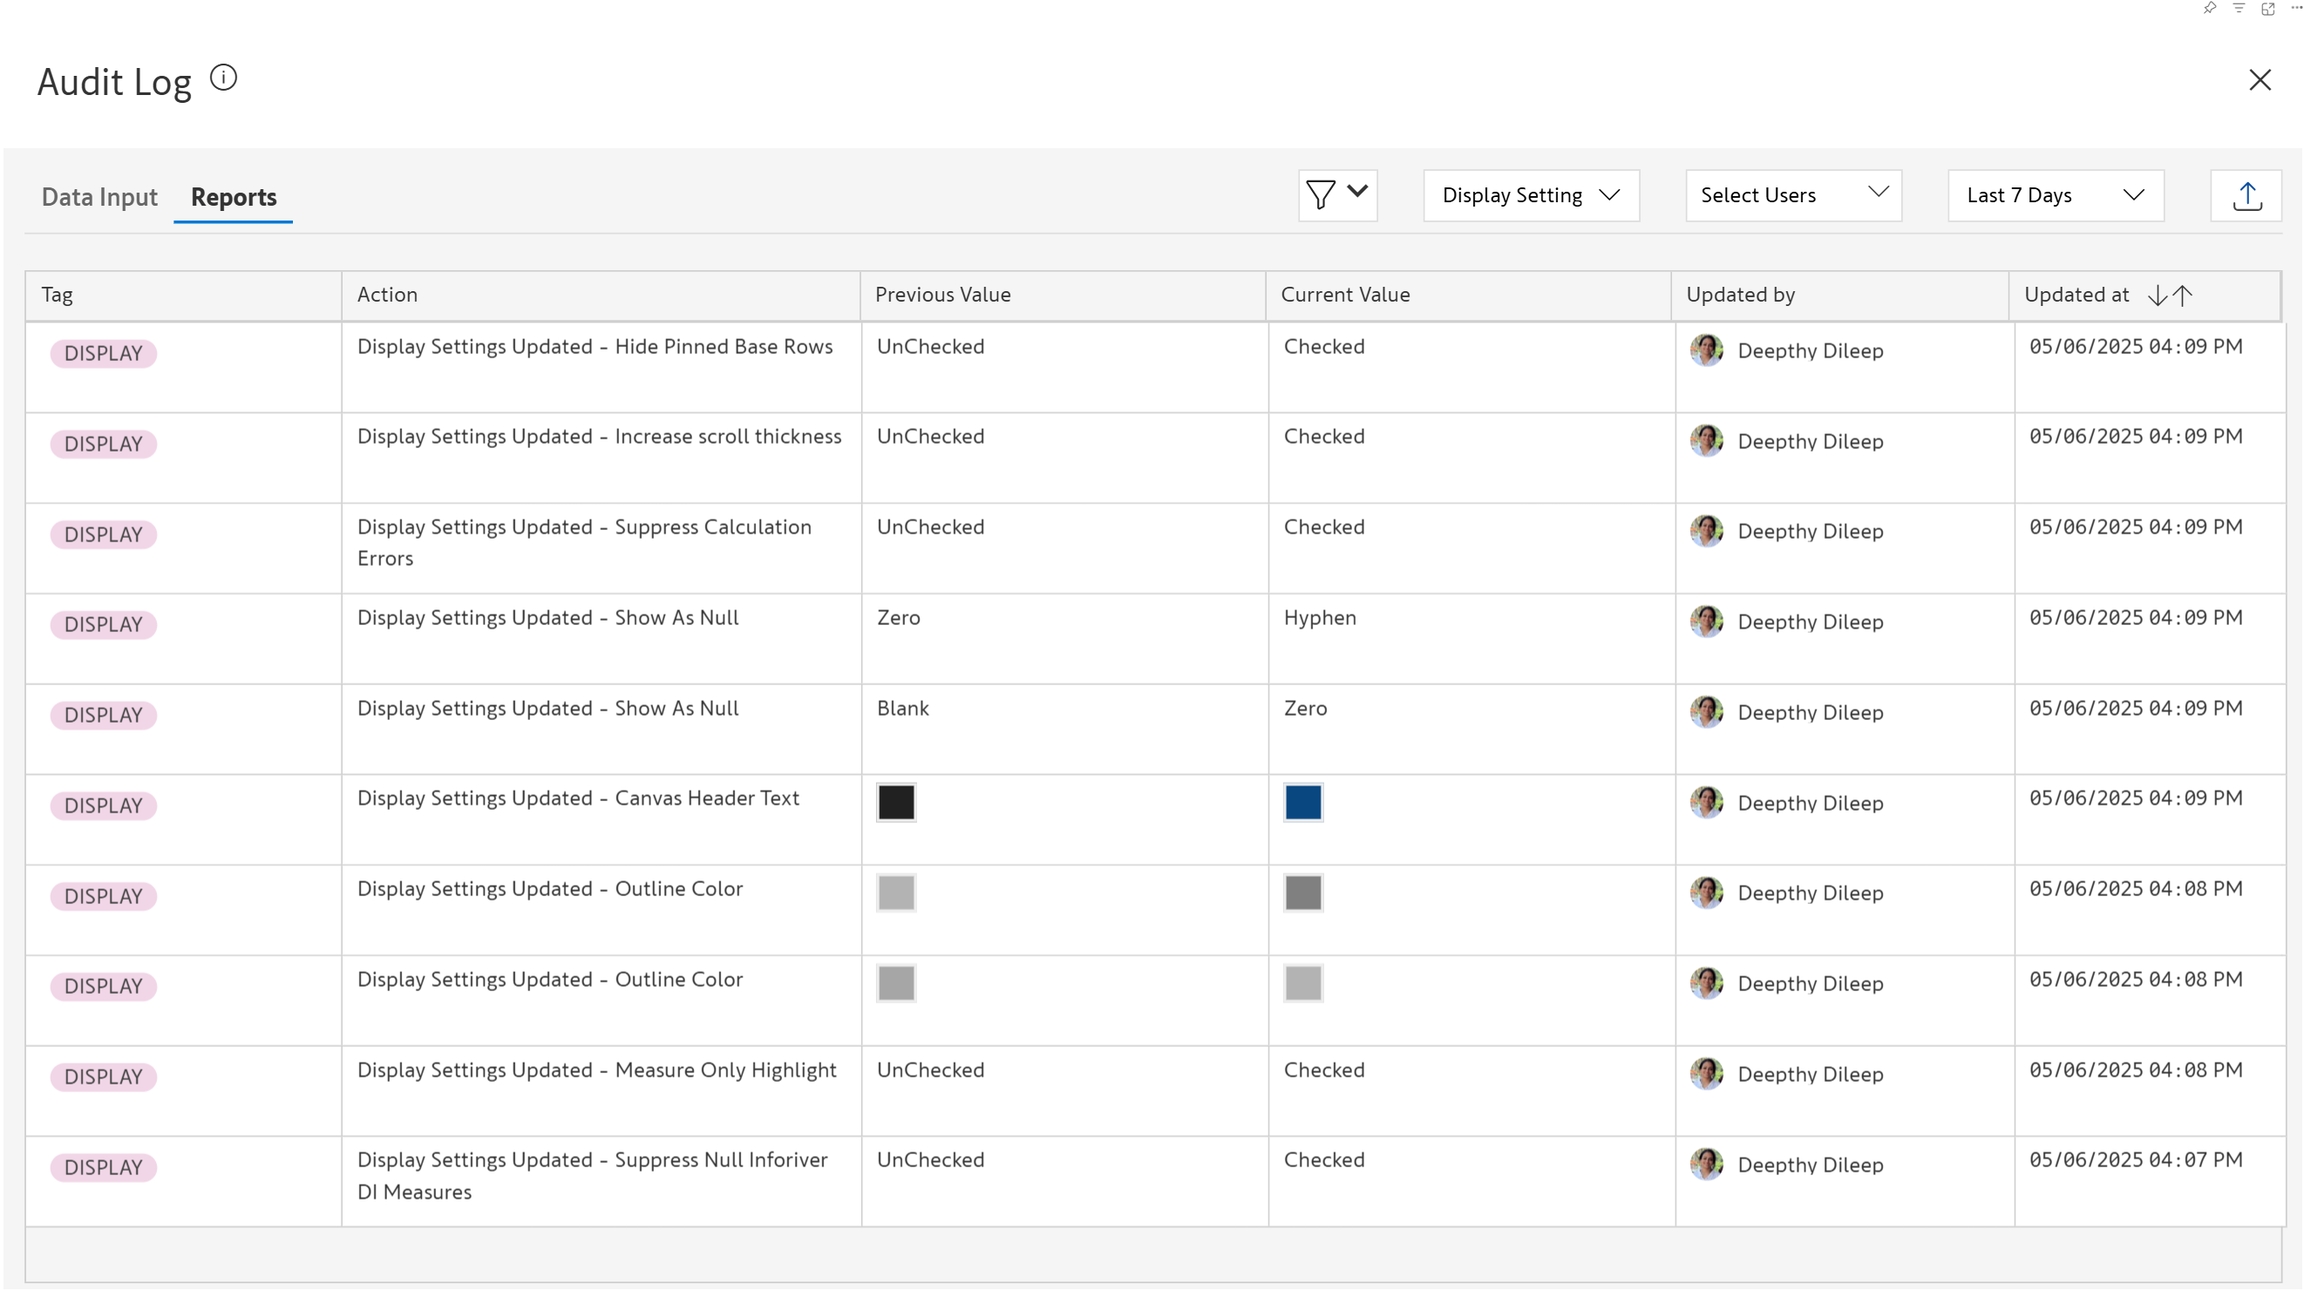
Display settings
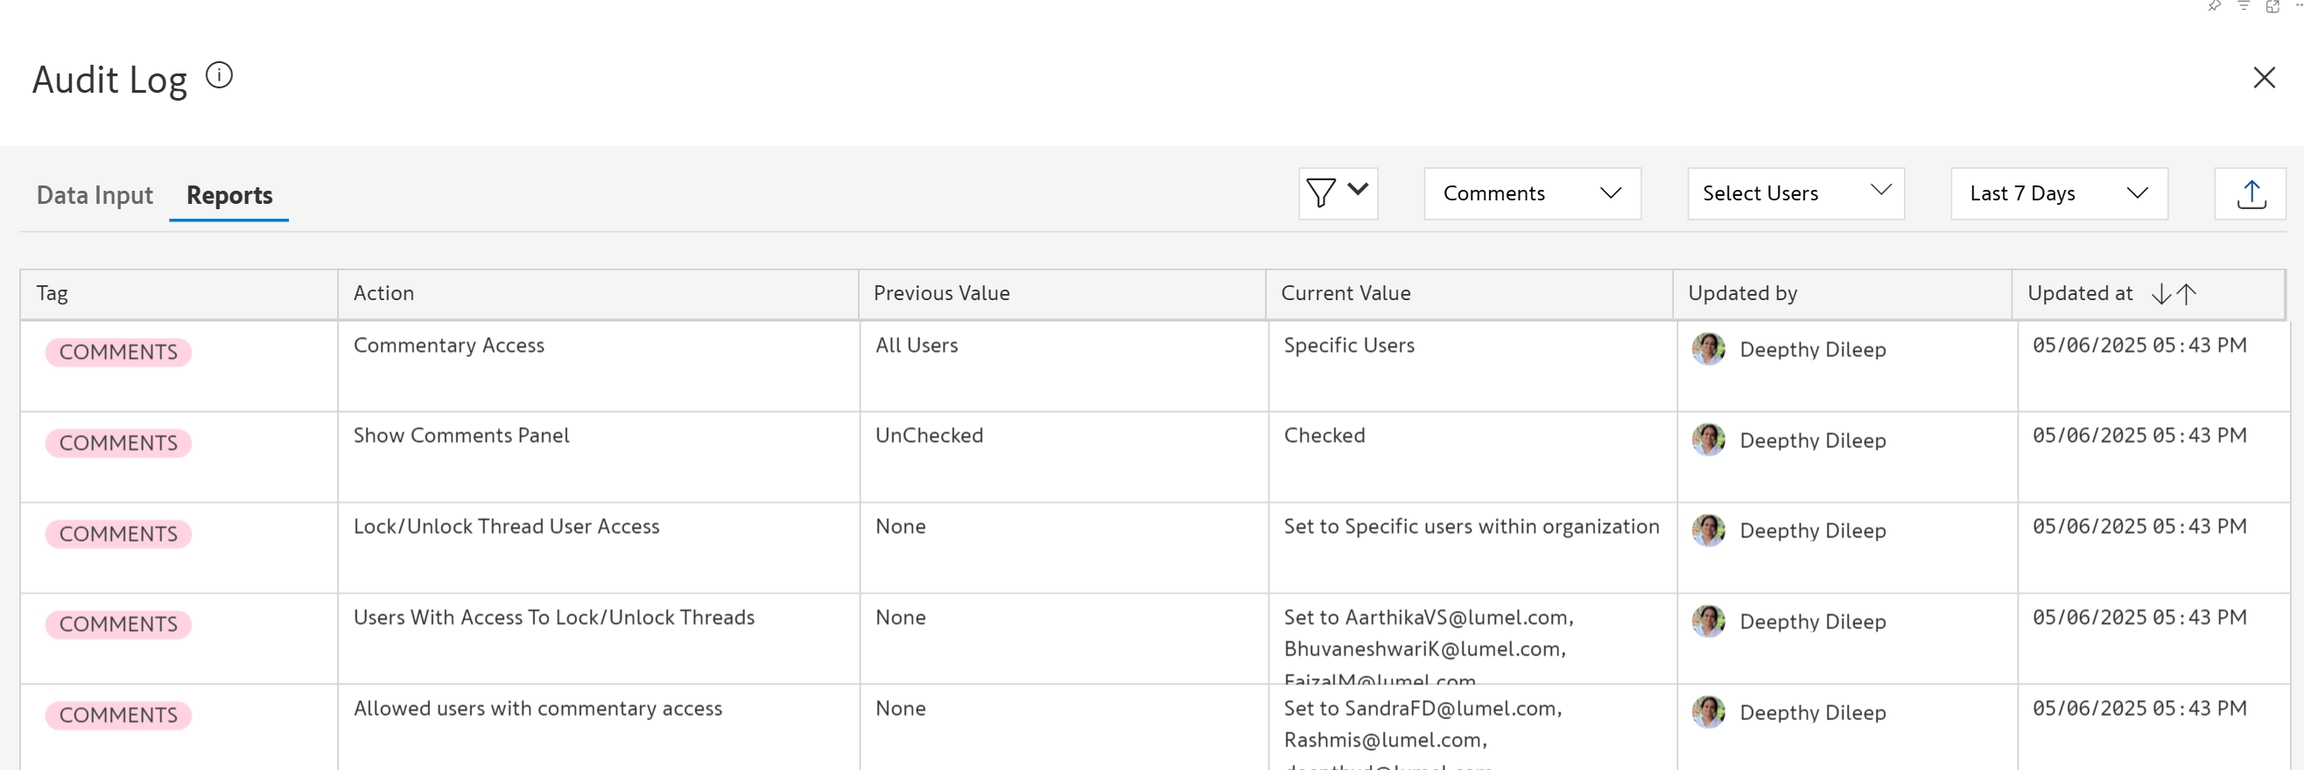
Comments settings
Notes settings
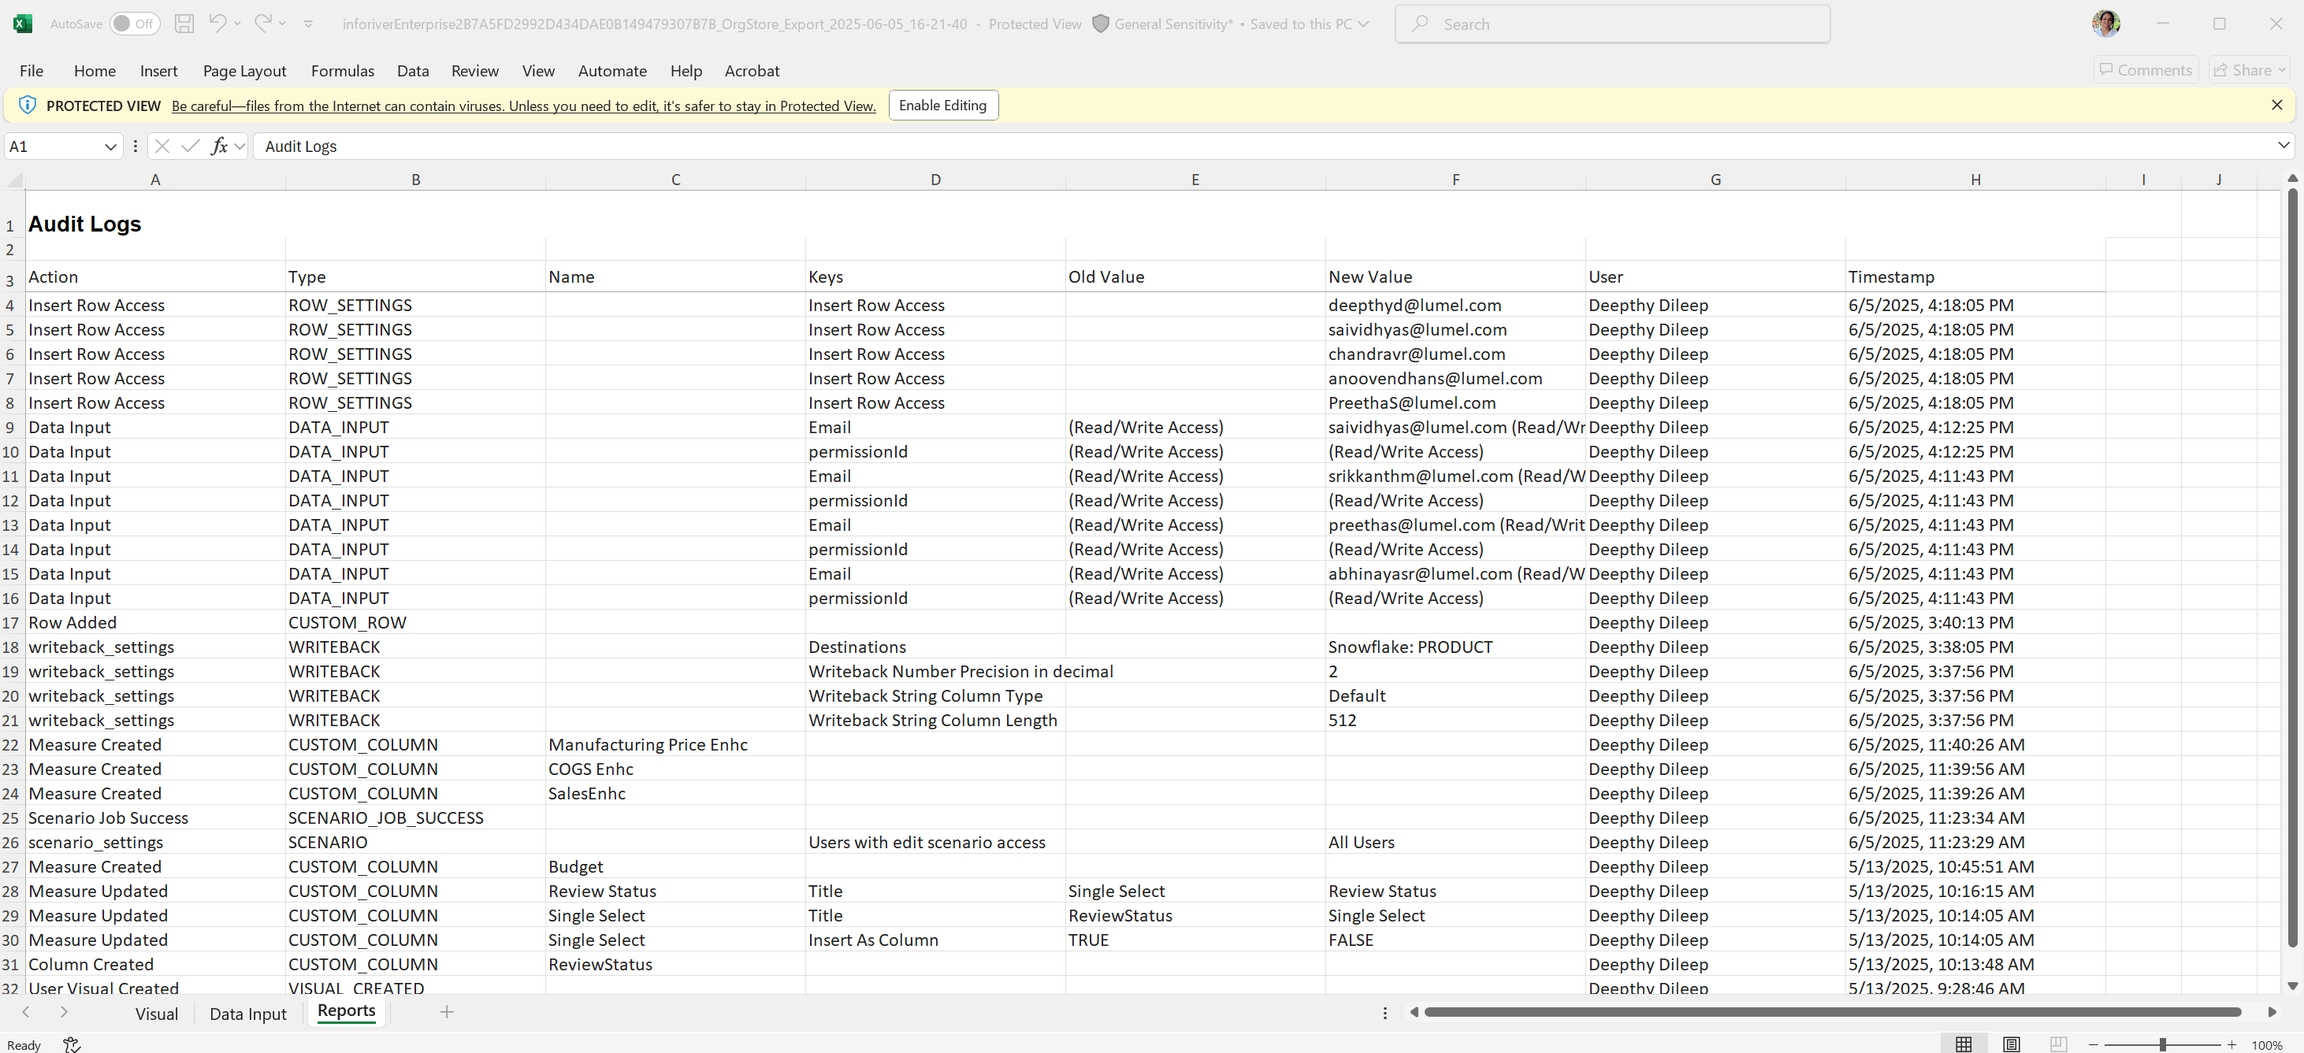
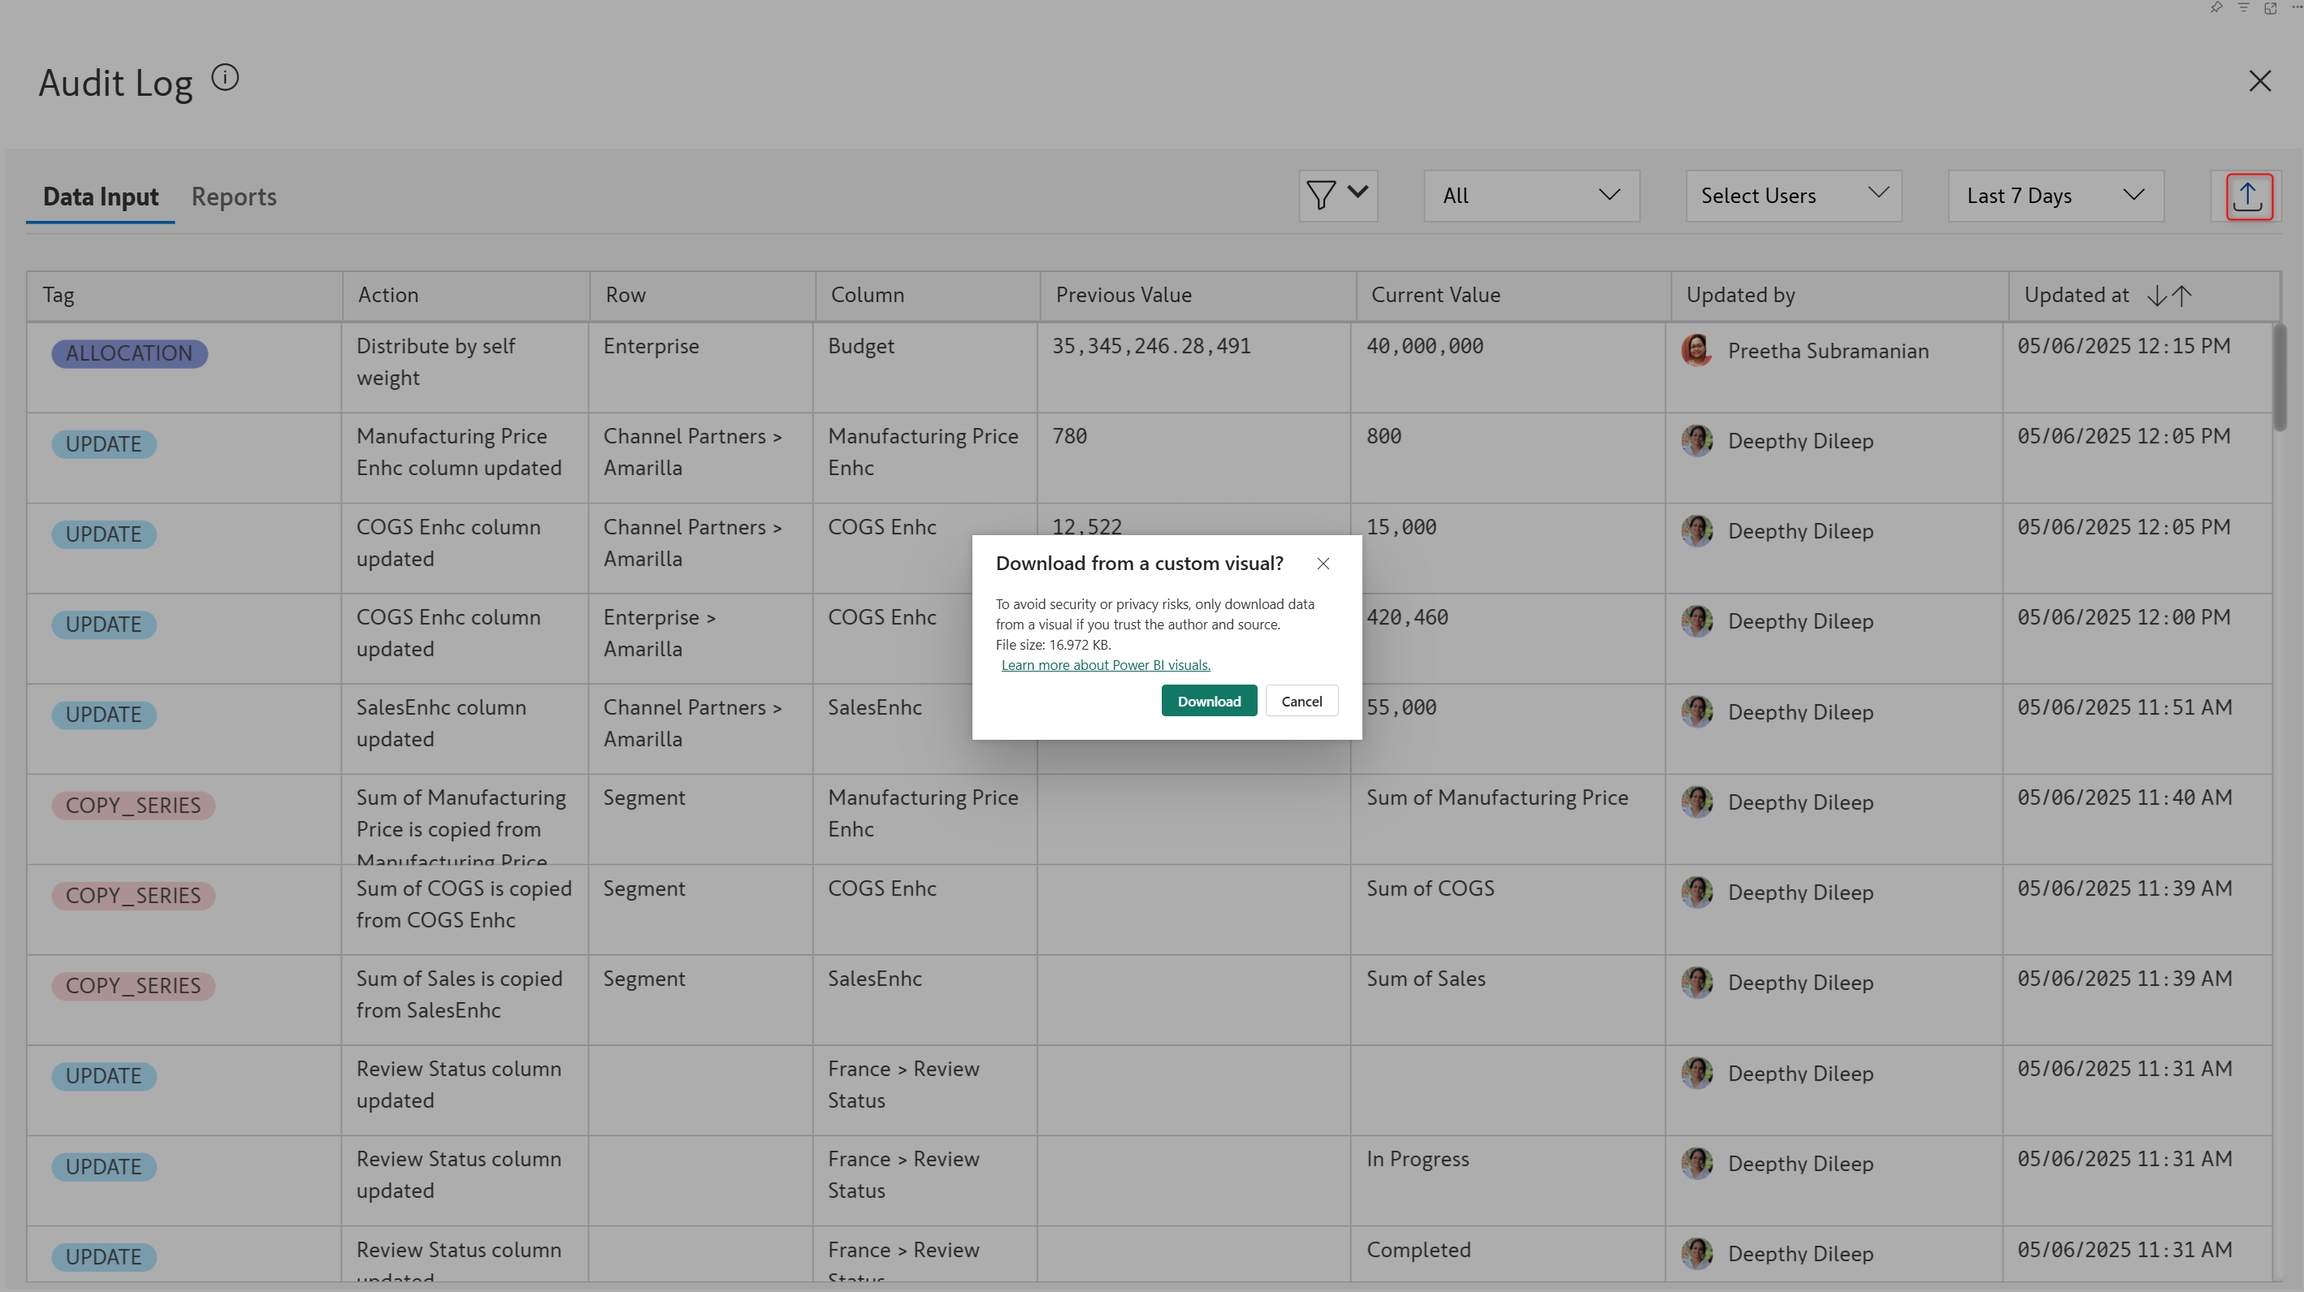
3. Export
Click the icon to export the audit log as an Excel file for any further analysis.
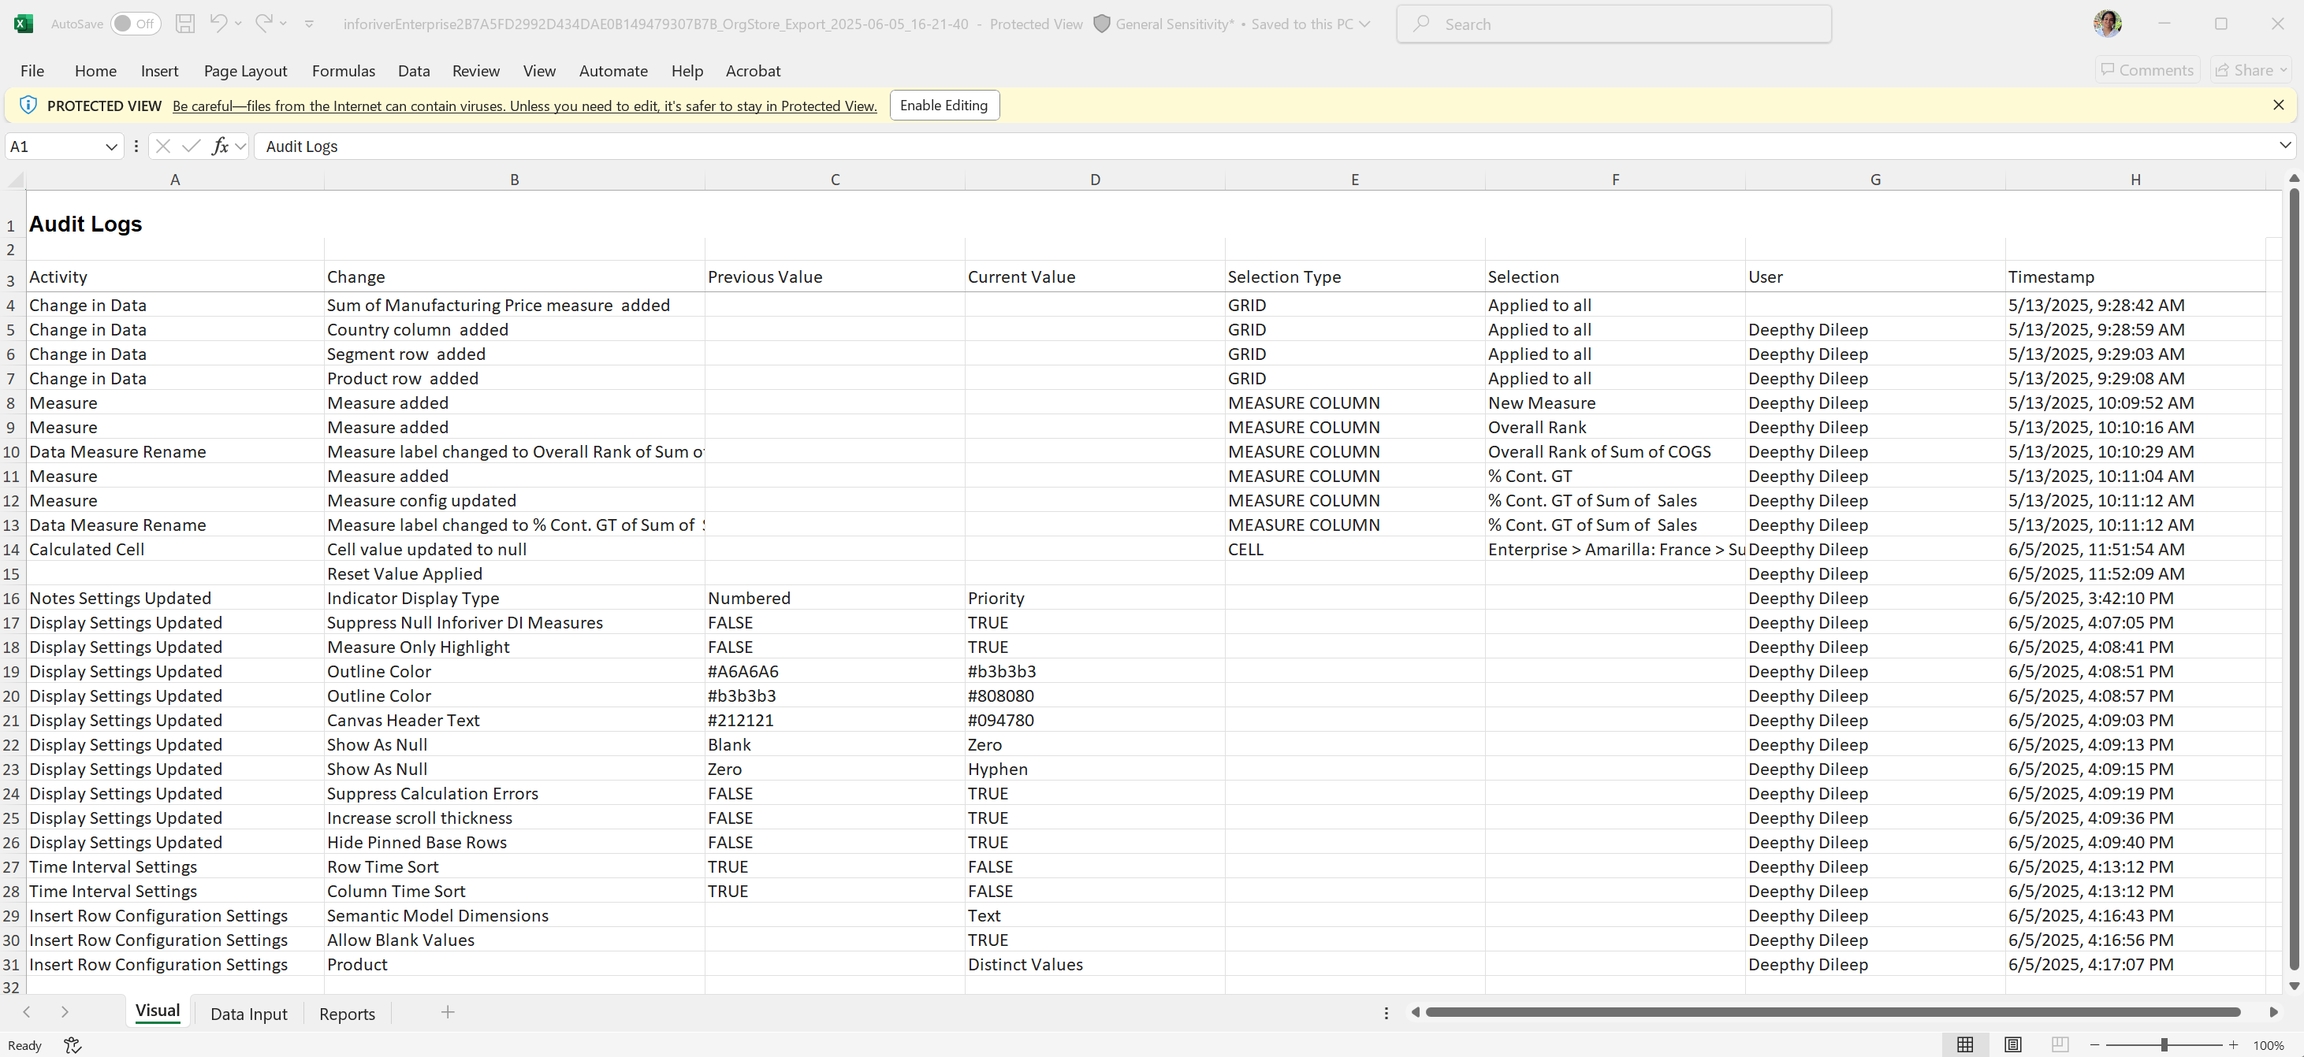
The downloaded audit log contains 3 tabs:
Visual: Captures visual-level changes like assigning native measures/dimensions, changing measure labels, updating cells, or changing settings.
Activity: View the type of change, such as a change in data, row reorder, data measure rename, settings update, etc.
Change - Description for the change, such as the name of the field that was added/removed, label change, specific setting that was updated etc.
Selection type - Indicates whether the change affected the entire table/matrix or a specific row/column/cell.
Selection - In case the change was applicable to a row/column/cell, the particular selection is mentioned.
User - The User who made the change
Timestamp - Captures when the change was made
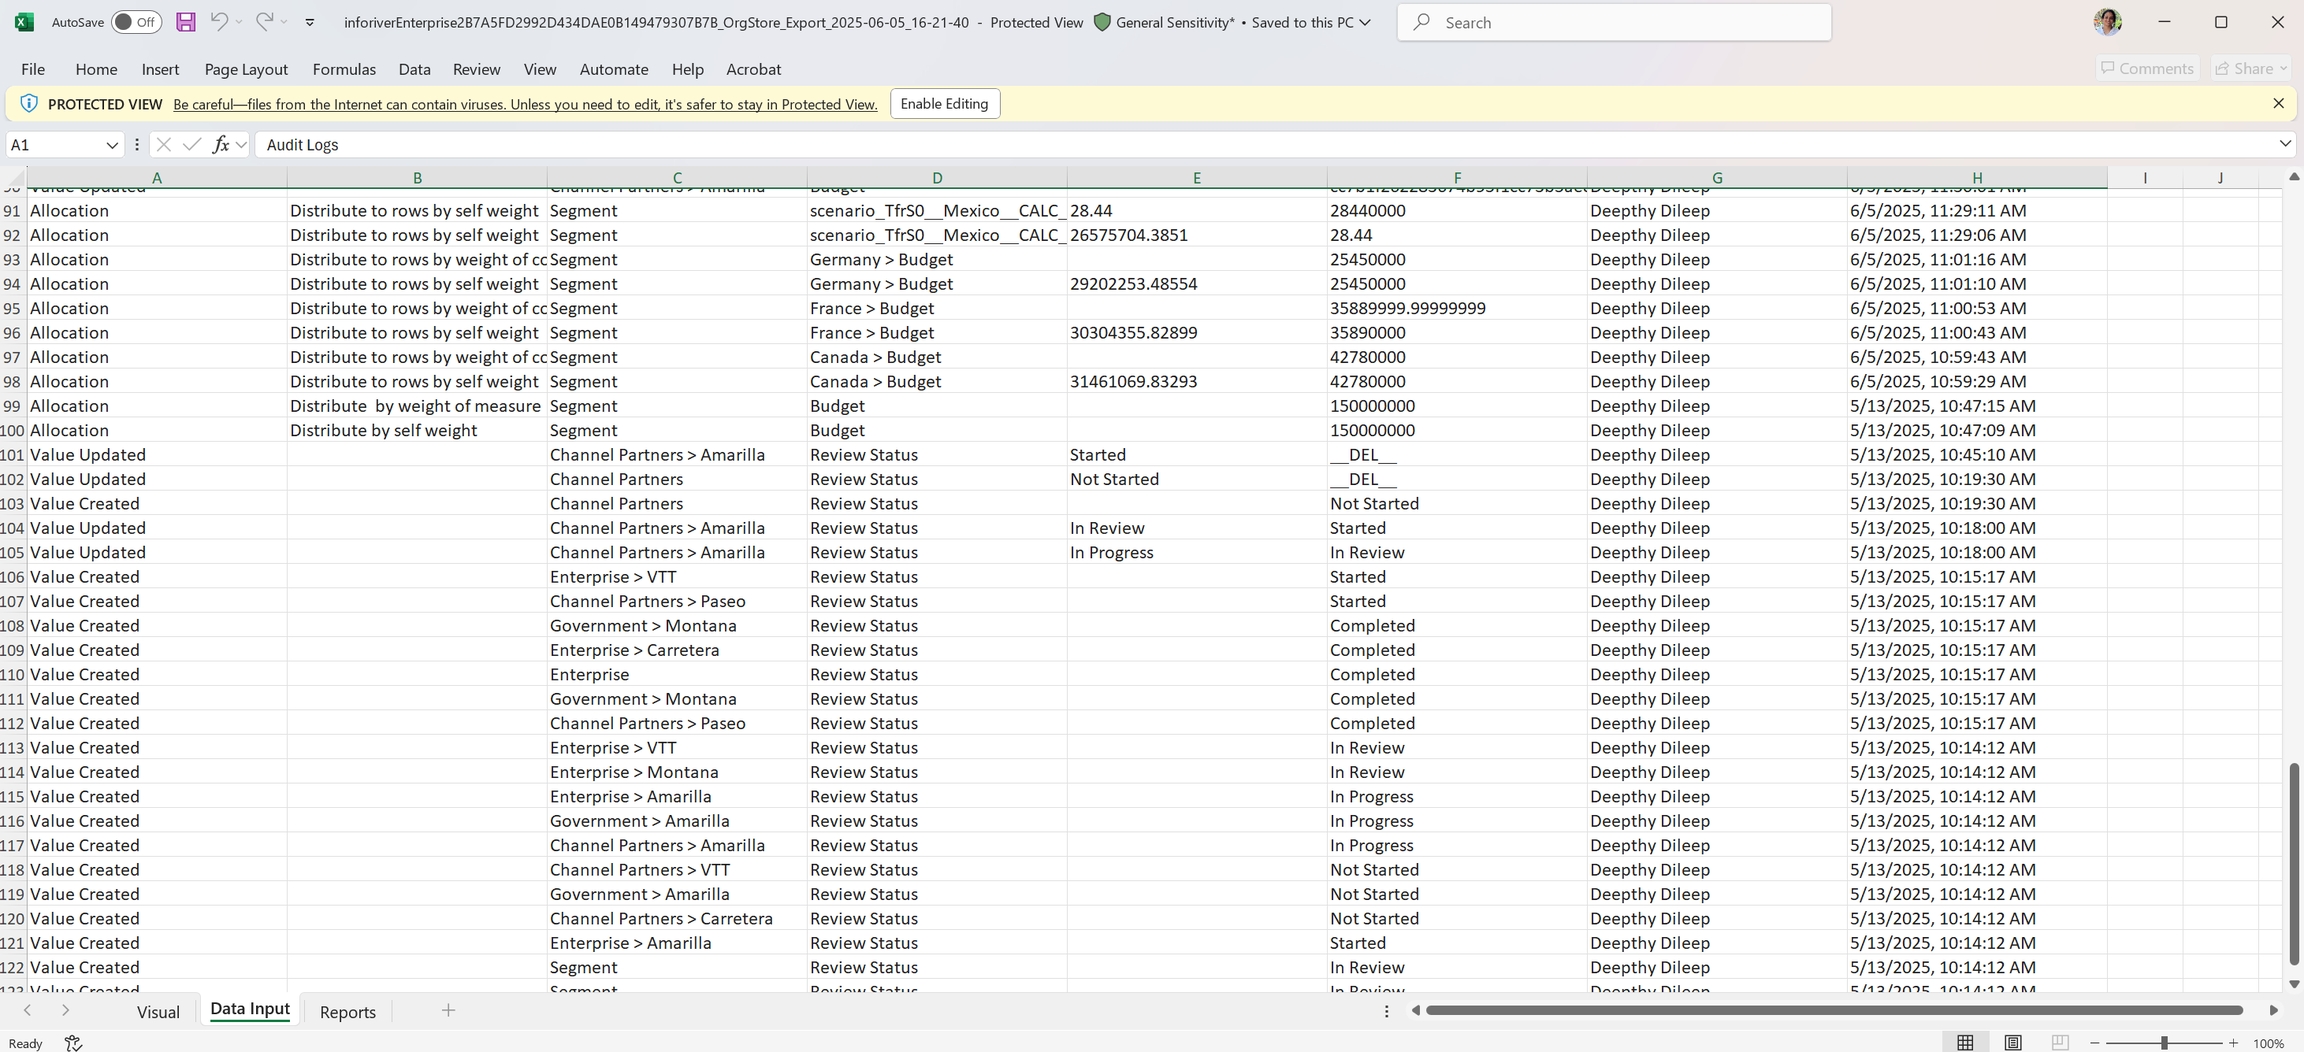
Data input: Captures updates made to data input fields, like value updates and allocations.
Action type: The type of change, such as value updates and allocations, etc.
Activity: Details such as which measure was used for distribution or the trend applied.
Row name: Impacted row dimension category
Column name: Impacted measure or column name
Previous value: The earlier value before updation
Current value: The latest updated value
User: User who made the change
Timestamp: Time of modification
Reports: Captures changes such as the creation of measures or scenarios within Inforiver. It also captures changes to read/write access settings.
Action: The type of change, such as measure, column, or scenario creation, or changing permissions.
Type: Can be CUSTOM_COLUMN/SCENARIO/ROW_SETTINGS, etc
Name: The name of the measure created in the visual
Old value: Previous measure label or
New Value: Updated label
User: User who made the change
Timestamp: Time of modification