Inforiver
Premium Table
Premium Table
  • Introduction to Premium Table
    • Get Started
      • Installing from AppSource
      • Installing Inforiver for your organization (Org visual)
      • Inforiver Writeback Matrix pre-requisites
        • Whitelist Inforiver IPs
        • Admin consent for Inforiver's Entra ID
          • Basic consent
          • Full admin consent
      • Inforiver Customer Portal
        • Billing Admin
          • Update Profile
          • Update Subscriptions
        • License Admin
      • Licensing
        • License renewal
      • Registering Inforiver on Azure AD (Entra ID)
  • Working with Premium Table
    • 1. Build your first Inforiver Table report
    • 2. Displaying information
      • Report interface
      • Templates
      • Basic formatting
        • Number formatting
        • Cell, header & value formatting
        • Totals & subtotals
        • Insert blank rows
      • Basic inline charts
    • 3. Basic interactions
      • Explore & filter data
        • Search & Filter
        • Explorer
        • Top N + others
      • Sort & reorder data
      • Show/hide values
      • Manage column widths
      • Manage hierarchies
      • Create visual hierarchies
      • Pin rows & columns
      • Blend measures
      • Dynamic measure headers
      • Context menus
        • Column gripper
        • Row gripper
      • Actions
        • Rails
        • Toolbar options
        • Keyboard shortcuts
        • Reset
    • 4. Adding business logic and formulae
      • Insert calculated rows
        • Template rows
      • Insert calculated columns
      • Insert manual input rows
      • Insert manual input columns
        • Number
        • Dropdown
          • Dropdown options from semantic models
          • Lookup visuals for dropdowns
        • Text, checkbox & date
        • Writeback Matrix features
        • Importing data
      • Invert sign
      • Editing cells
      • Quick formula
      • Visual column inside visual measures
      • Manage inserted rows
      • Manage inserted measures & columns
      • Pivot data
      • Insert image URLs
    • 6. Working with charts
      • Sparkline charts
      • Stacked charts
      • Bullet charts and clustered bar charts
      • Waterfall charts
      • Bar and pin charts
      • Change/deviation charts
    • 5. Conditional formatting
      • One-click options
      • Create rule
        • Rules (If conditions)
        • Color scale & data bars
        • Classification
        • Ranking
      • Manage rules
    • 7. Planning, budgeting & forecasting
      • What-if analysis & simulations
      • Goal Seek
      • Budgeting & allocations
      • Set version
    • 8. Paginated reporting
      • Pagination
      • Header & footer
        • Text
        • Images
        • Charts
        • KPI cards
      • Report layouts (Report+)
      • Display and themes
    • 10. Exporting reports
      • Export to PDF & Excel
        • Excel export - operational boundaries
      • Ad hoc emails
    • 11. Scheduling reports
      • Create new subscription
        • Select a report
        • Set subscription frequency
        • Select destination(s)
          • Email
          • OneDrive
          • Microsoft Teams
          • SharePoint
        • Review & save subscription
      • Manage your subscriptions
      • Administration
    • 12. Data writeback
      • Settings
        • General Settings
        • Data Settings
        • Destination Settings
        • Writeback security settings
        • Writeback time-out & batch size settings
        • Advanced Settings
      • Destinations
        • Azure SQL (Managed DB)
        • Azure SQL
        • Microsoft SQL Server
        • Synapse Dedicated SQL Pool
        • Azure Data Lake Storage
        • Databricks
        • Snowflake
          • Setting up Snowflake OAuth
        • Amazon Redshift
        • BigQuery
        • SingleStore
        • SAP HANA
        • Oracle
        • PostgreSQL
        • MySQL
        • OneDrive
        • SharePoint
        • Dataverse
        • Fabric Warehouse
        • Fabric lakehouse
        • Fabric SQL
        • URL as destination
      • Logs
      • Reading mode
    • 14. Manage aggregation
      • Row aggregation
      • Column aggregation
    • 18. Variables
      • Variable types
        • Number
        • Select
        • Text
        • Date
        • Date range
        • Boolean
        • Button
      • Variable bookmarks
  • Admin Console
    • Manage Profile
    • User management
      • User Roles and Permissions
      • Create custom roles and policies
    • Settings
      • General
      • Generate builds - on prem
      • Forecast
      • Holidays
      • API token
      • Writeback
      • Managed DB
      • Assets
    • Onboarding actions
    • Writeback
  • Display settings
    • General settings
    • Hierarchy settings
    • Number settings
    • Miscellaneous settings
    • On-load scripting
  • Formula syntax
    • Conditional statements
      • IF
      • IFNA
      • SWITCH
      • FILTERIF
    • Logical functions
      • AND
      • IN
      • ISBLANK
      • ISEMPTY
      • ISNUMBER
      • NOT
      • OR
      • XOR
    • Math functions
      • ABS
      • AVERAGE
      • AVERAGEEXNEG
      • AVERAGEEXZERO
      • AVERAGEEXZERONEG
      • AVERAGEIF
      • CEILING
      • COUNT
      • COUNTIF
      • DIVIDE
      • EVEN
      • EXP
      • FLOOR
      • INDEXOF
      • LOG
      • ODD
      • MAX
      • MIN
      • NORMDIST
      • NORMSDIST
      • NORMINV
      • NORMSINV
      • PCT
      • POWER
      • RAND
      • RANDBETWEEN
      • ROUND
      • ROUNDDOWN
      • ROUNDUP
      • MROUND
      • SORT
      • SQRT
      • SUM
      • PMT
    • Text formatting functions
      • CONCATENATE
      • HYPERLINK
      • LEFT
      • LOWER
      • MID
      • PROPER
      • REPLACE
      • REPT
      • RIGHT
      • TEXT
      • TRIM
      • UPPER
      • VALUE
    • Date functions
      • DATEADD
      • DATEDIFF
      • DAY
      • DATE
      • DATE.SET
      • DATE.FORMAT
      • SOWEEK
      • SOMONTH
      • SOQTR
      • SOYEAR
      • EOWEEK
      • EOMONTH
      • EOQTR
      • EOYEAR
      • NETWORKDAYS
      • ADDDAYS
      • ADDWEEKS
      • ADDMONTHS
      • ADDQTRS
      • ADDYEARS
      • FROMEXCELDATE
      • MONTH
      • NOW
      • PERIOD_RANGE
      • TODAY
      • TOEXCELDATE
      • YEAR
    • Time intelligence functions
      • AGGREGATE
      • FILTER
      • COLUMN_PERIOD
      • LASTNDAY
      • LASTNMONTH
      • LASTNQTR
      • LASTNYEAR
      • MONTHPERIOD
      • MOVINGAVERAGE
      • MOVINGSUM
      • MTD
      • NEXTNDAY
      • NEXTNMONTH
      • NEXTNQTR
      • NEXTNYEAR
      • QTD
      • QTRPERIOD
      • SHIFT
      • TOTALYTD
      • TOTALQTD
      • TOTALMTD
      • VALUEAT
      • YEARPERIOD
      • YTD
    • Other operators
    • Identifiers
      • CLOSEDPERIOD
      • COLUMN.DATE
      • COLUMN.PARENT
      • COLUMNS
      • CURRENT_PERIOD
      • DESCENDANTS
      • FORECAST.CLOSED_END
      • FORECAST.CLOSED_START
      • FORECAST.OPEN_END
      • FORECAST.OPEN_START
      • GROUP INDEX
      • HAS
      • HAS_ALL
      • HAS_SOME
      • LEAVES
      • LEVEL
      • LOGGEDIN_EMAIL
      • LOGGEDIN_NAME
      • MATCH
      • MAXDATE
      • MEMBERS
      • MINDATE
      • RELATIVE
      • RELATIVE_COLUMN
      • ROW.PARENT
      • ROW.LABEL
    • Scripting functions
      • DISPLAYTOAST
      • EXPORT
      • LAYOUT
      • SETCFRULE
      • SETFILTER
      • SETFILTERBYINDEX
      • SETVISIBILITY
      • SHOWBETWEENPERIOD
      • SHOWCLOSEDFORECAST
      • TOPN
      • DISPLAY SETTINGS
        • SETBLANKLABEL
        • SETSUPPRESSZEROS
        • SETRAGGEDHIERARCHY
        • SEPARATOR
        • SETCOMBINECOLUMNHEADER
        • SEMANTICFORMAT
        • SHOWNULLAS
        • SHOWZEROAS
        • SINGLECHILD
    • Statistical Functions
      • RANK
      • RANKEQ
      • RANKAVG
    • Miscellaneous functions
      • FETCH
      • LOOKUP
    • Measure/Column selection functions
      • GETCOLBETWEENPERIODS
      • GETMEASURE
  • Advanced topics
    • Audit log
    • Backup & restore report config
    • Enterprise themes
    • PowerPoint integration
    • Drill down and roll up in performance mode
  • Accessibility shortcut keys
Powered by GitBook
On this page
  • 1. Pin rows
  • 2. Pin columns
  • 3. Unpin
  1. Working with Premium Table
  2. 3. Basic interactions

Pin rows & columns

PreviousCreate visual hierarchiesNextBlend measures

Pinning rows and columns is very helpful when you have too many rows or columns in your report. You can use the pinning option to freeze them respectively at the top or left so that they are visible even when you scroll to another area of the report.

1. Pin rows

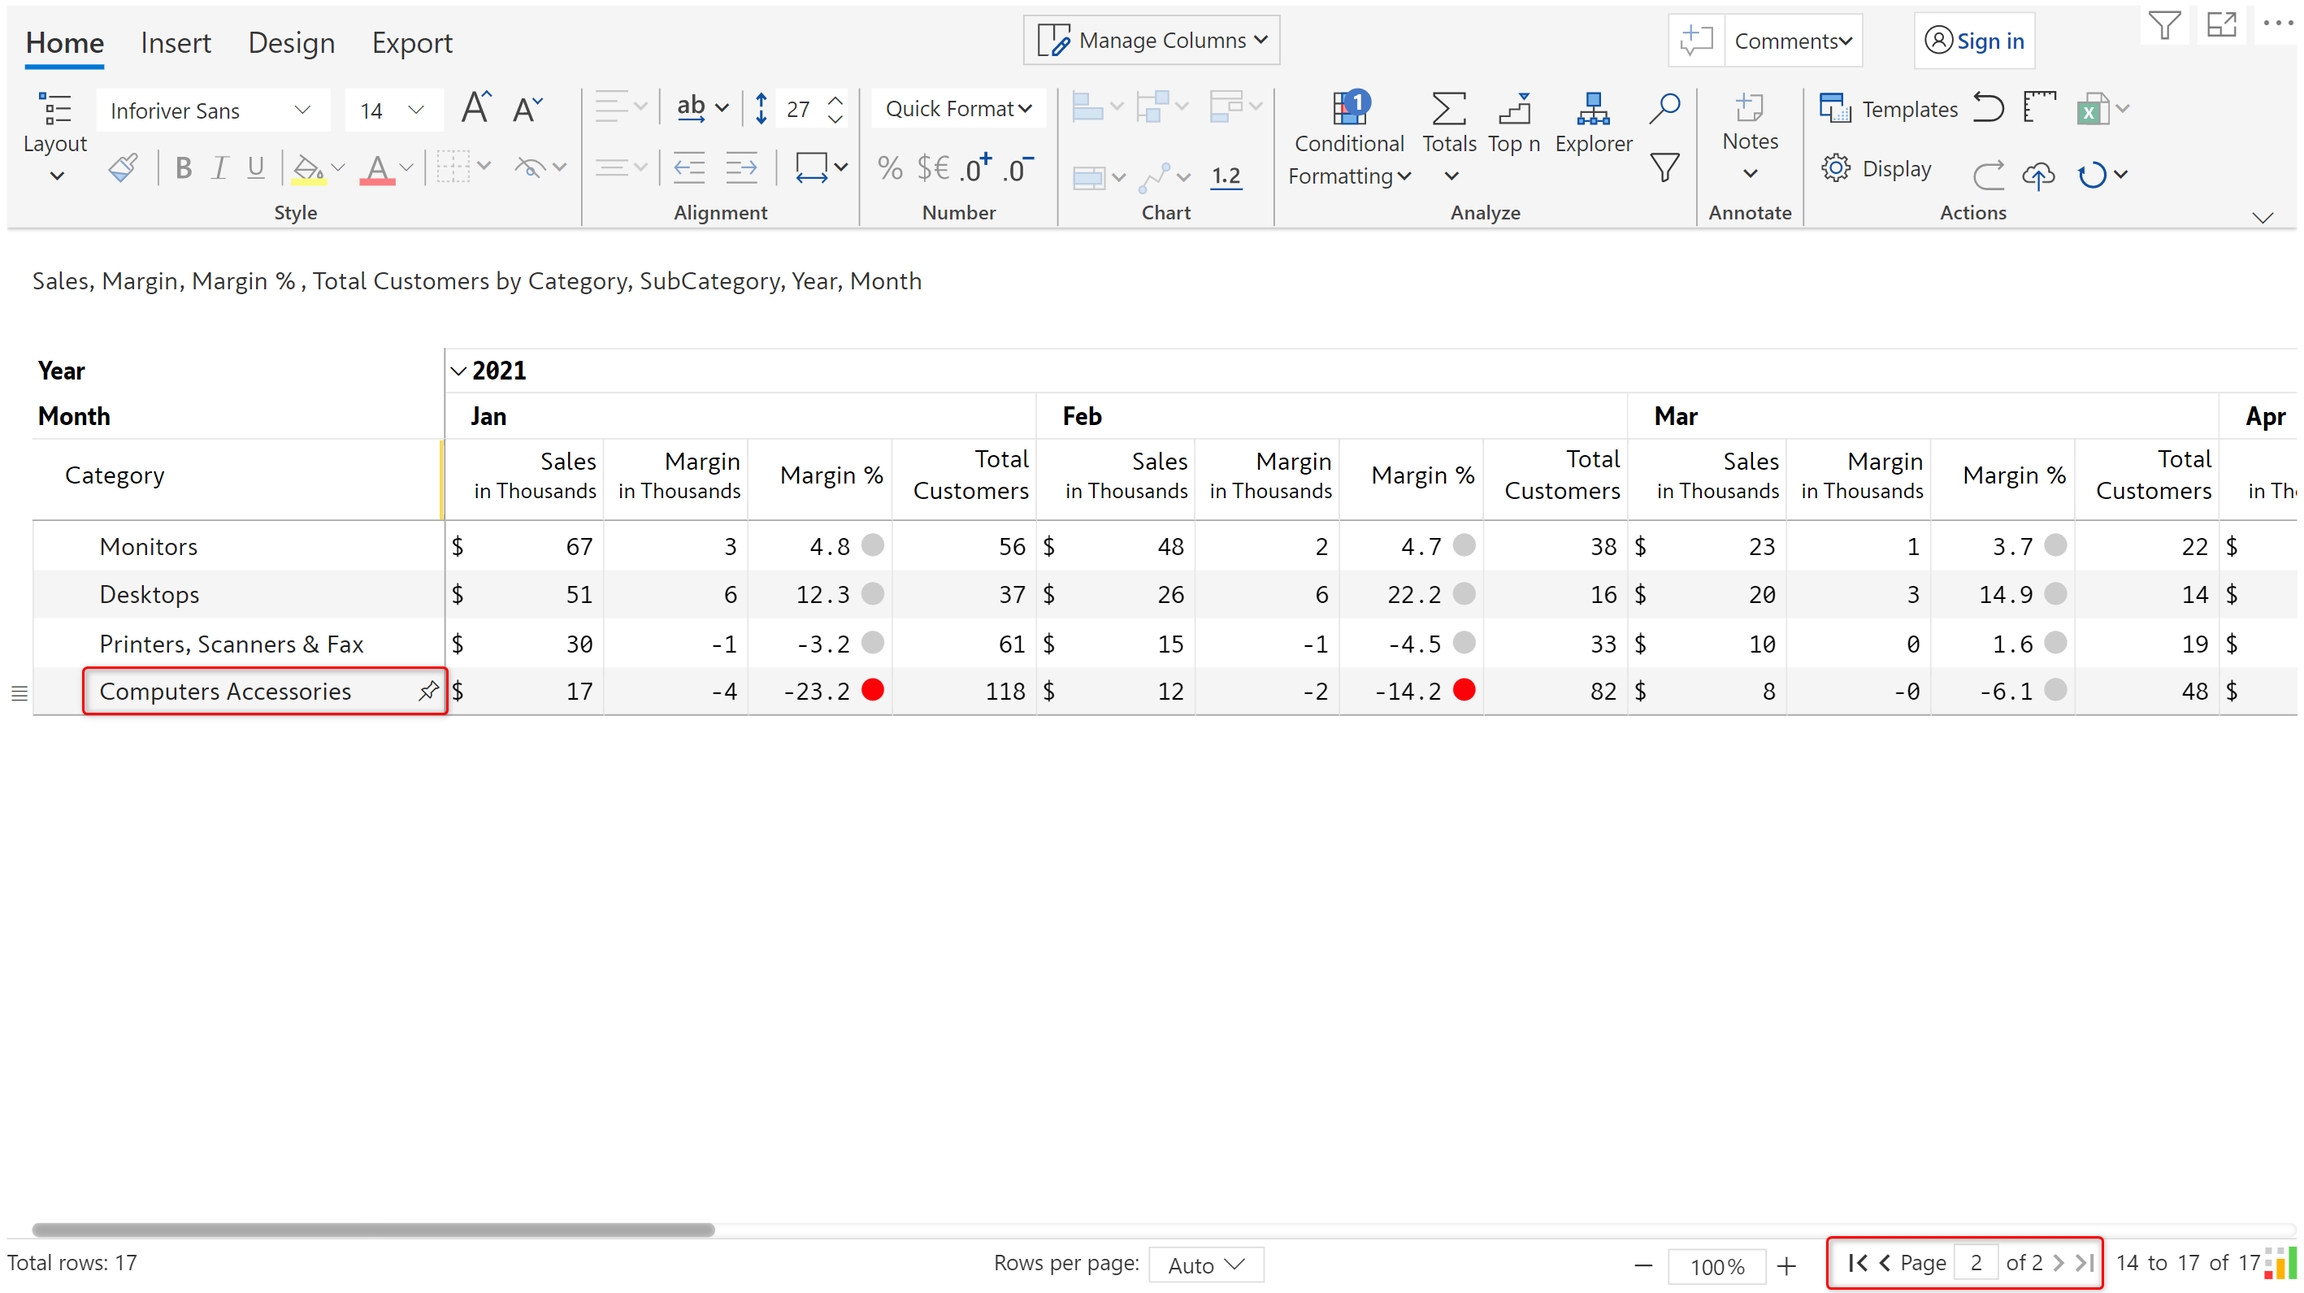
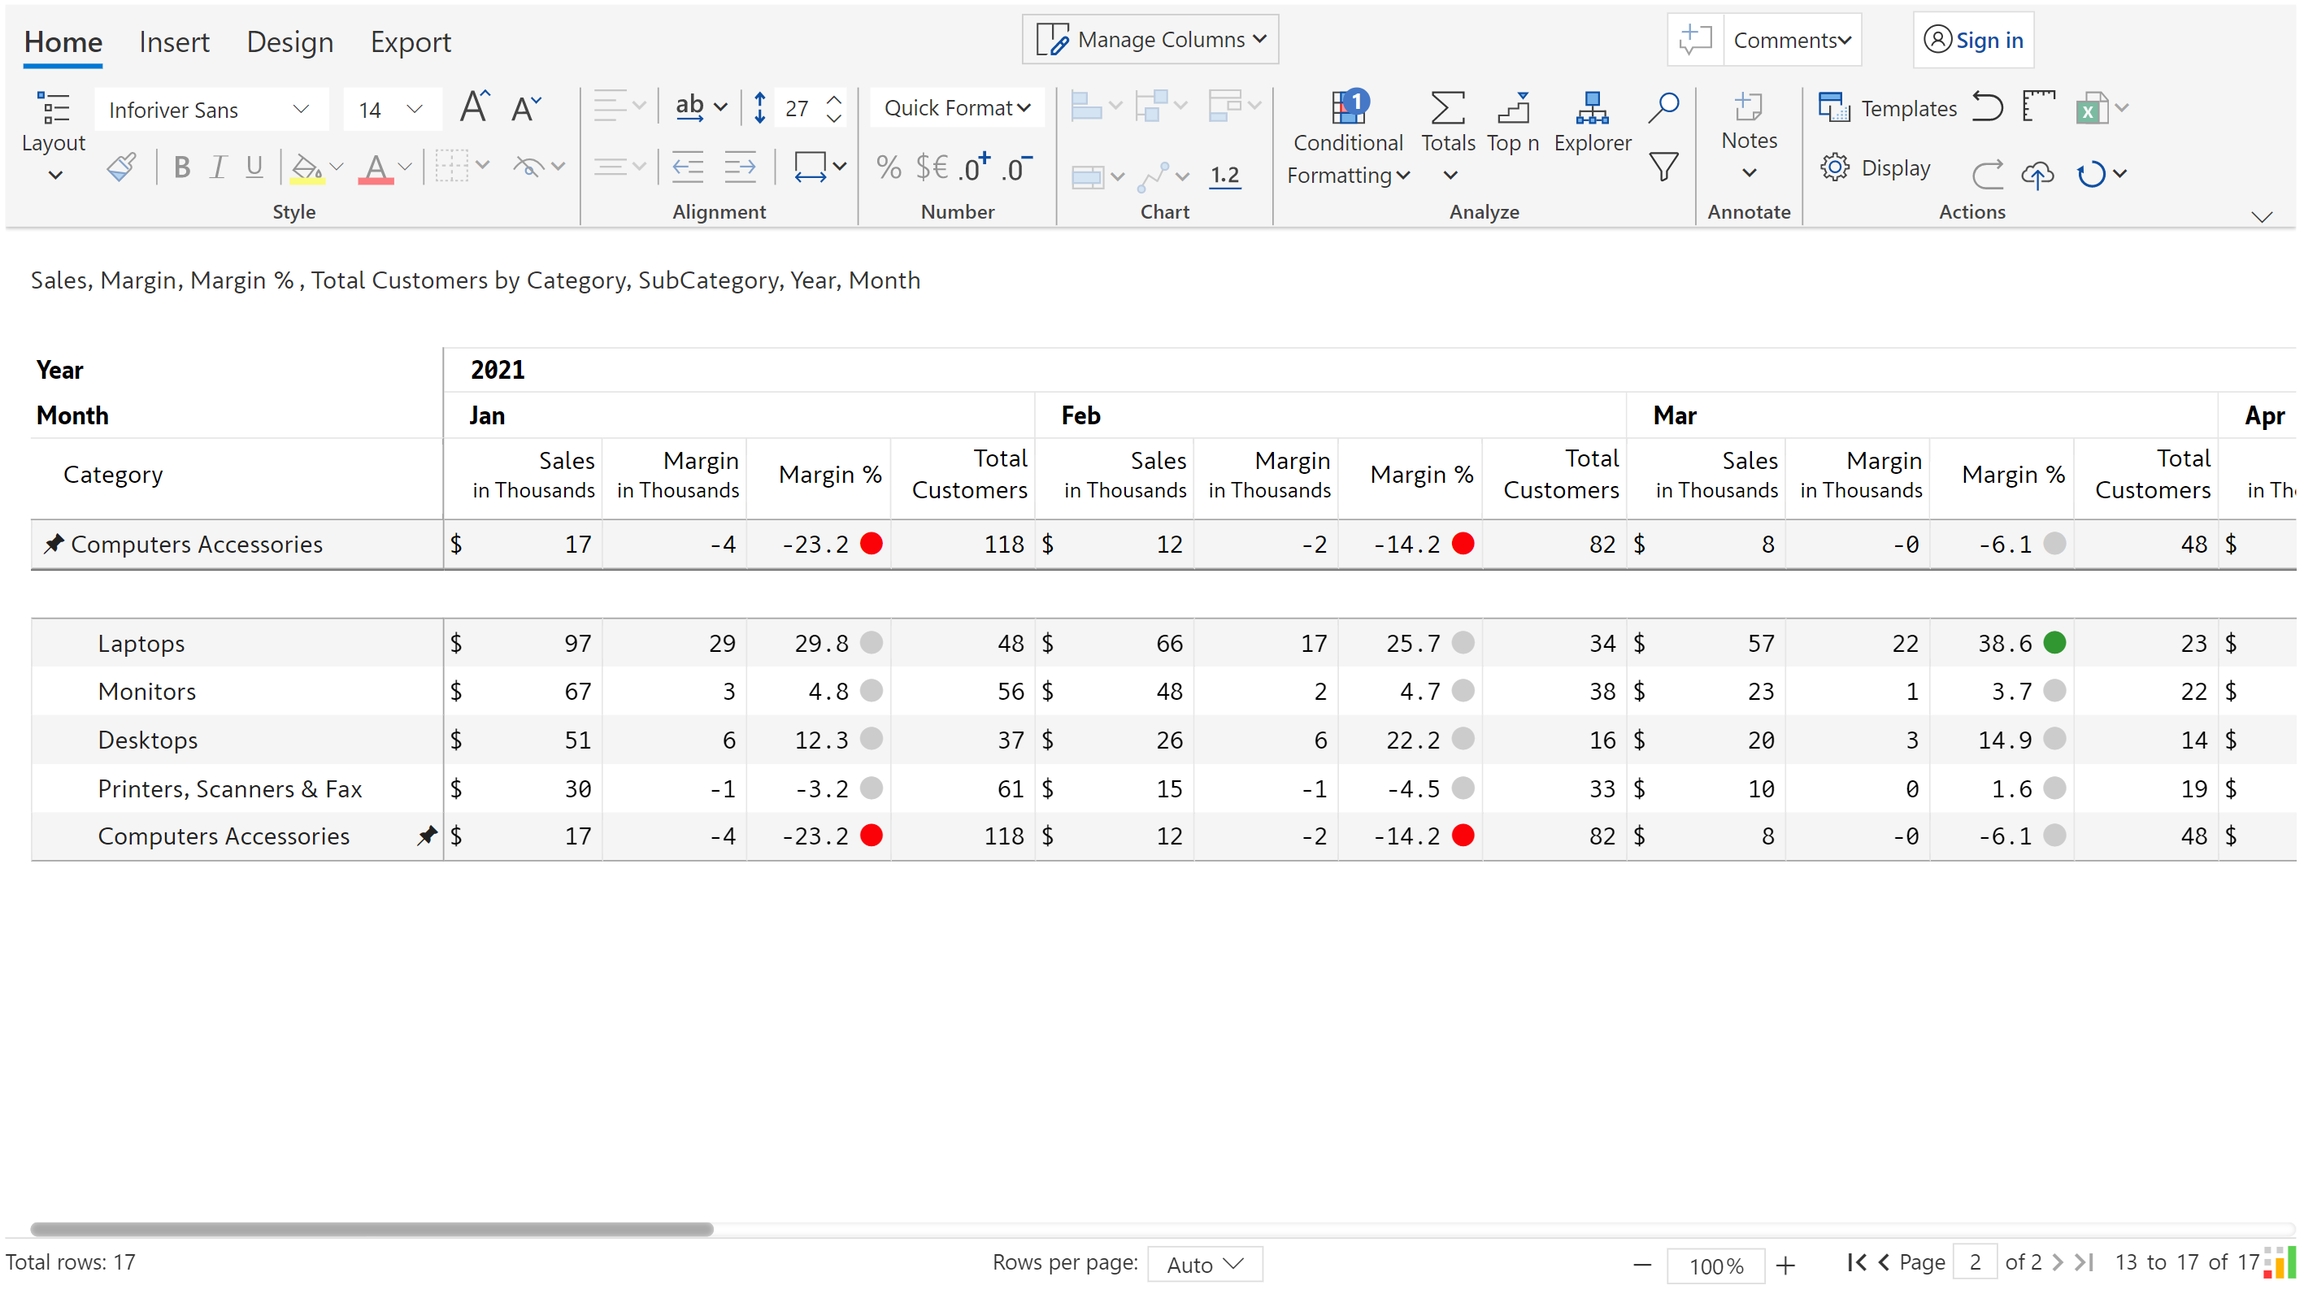
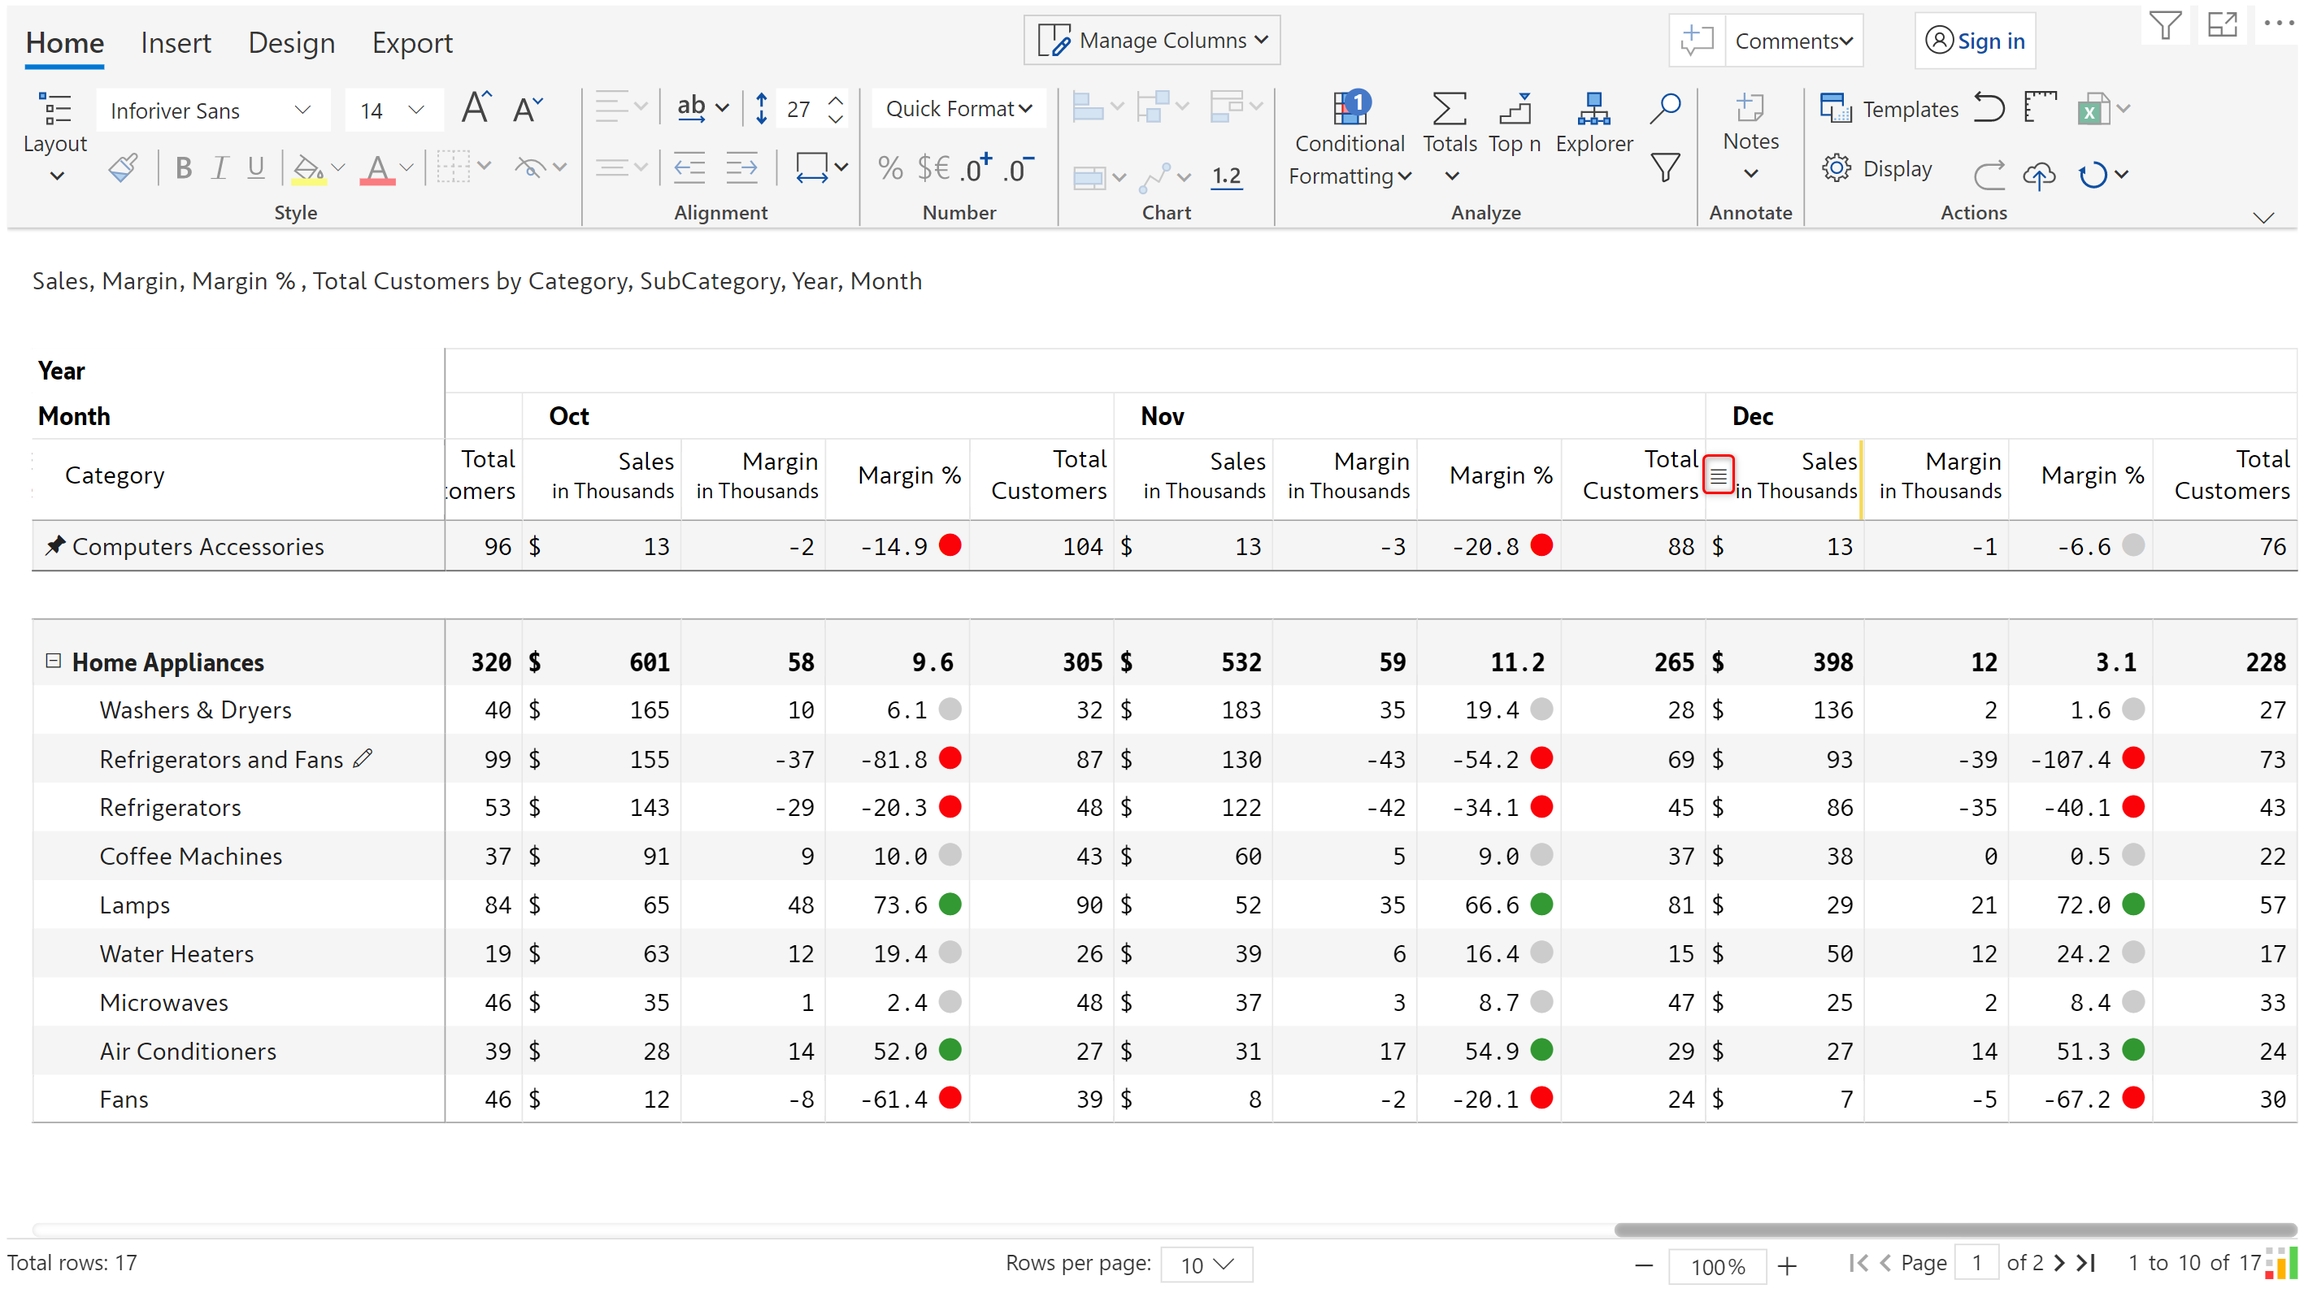
In this example, we have Computer accessories on the second page of the report. But this is an important category that is being tracked so we want it to be easily visible on the report.

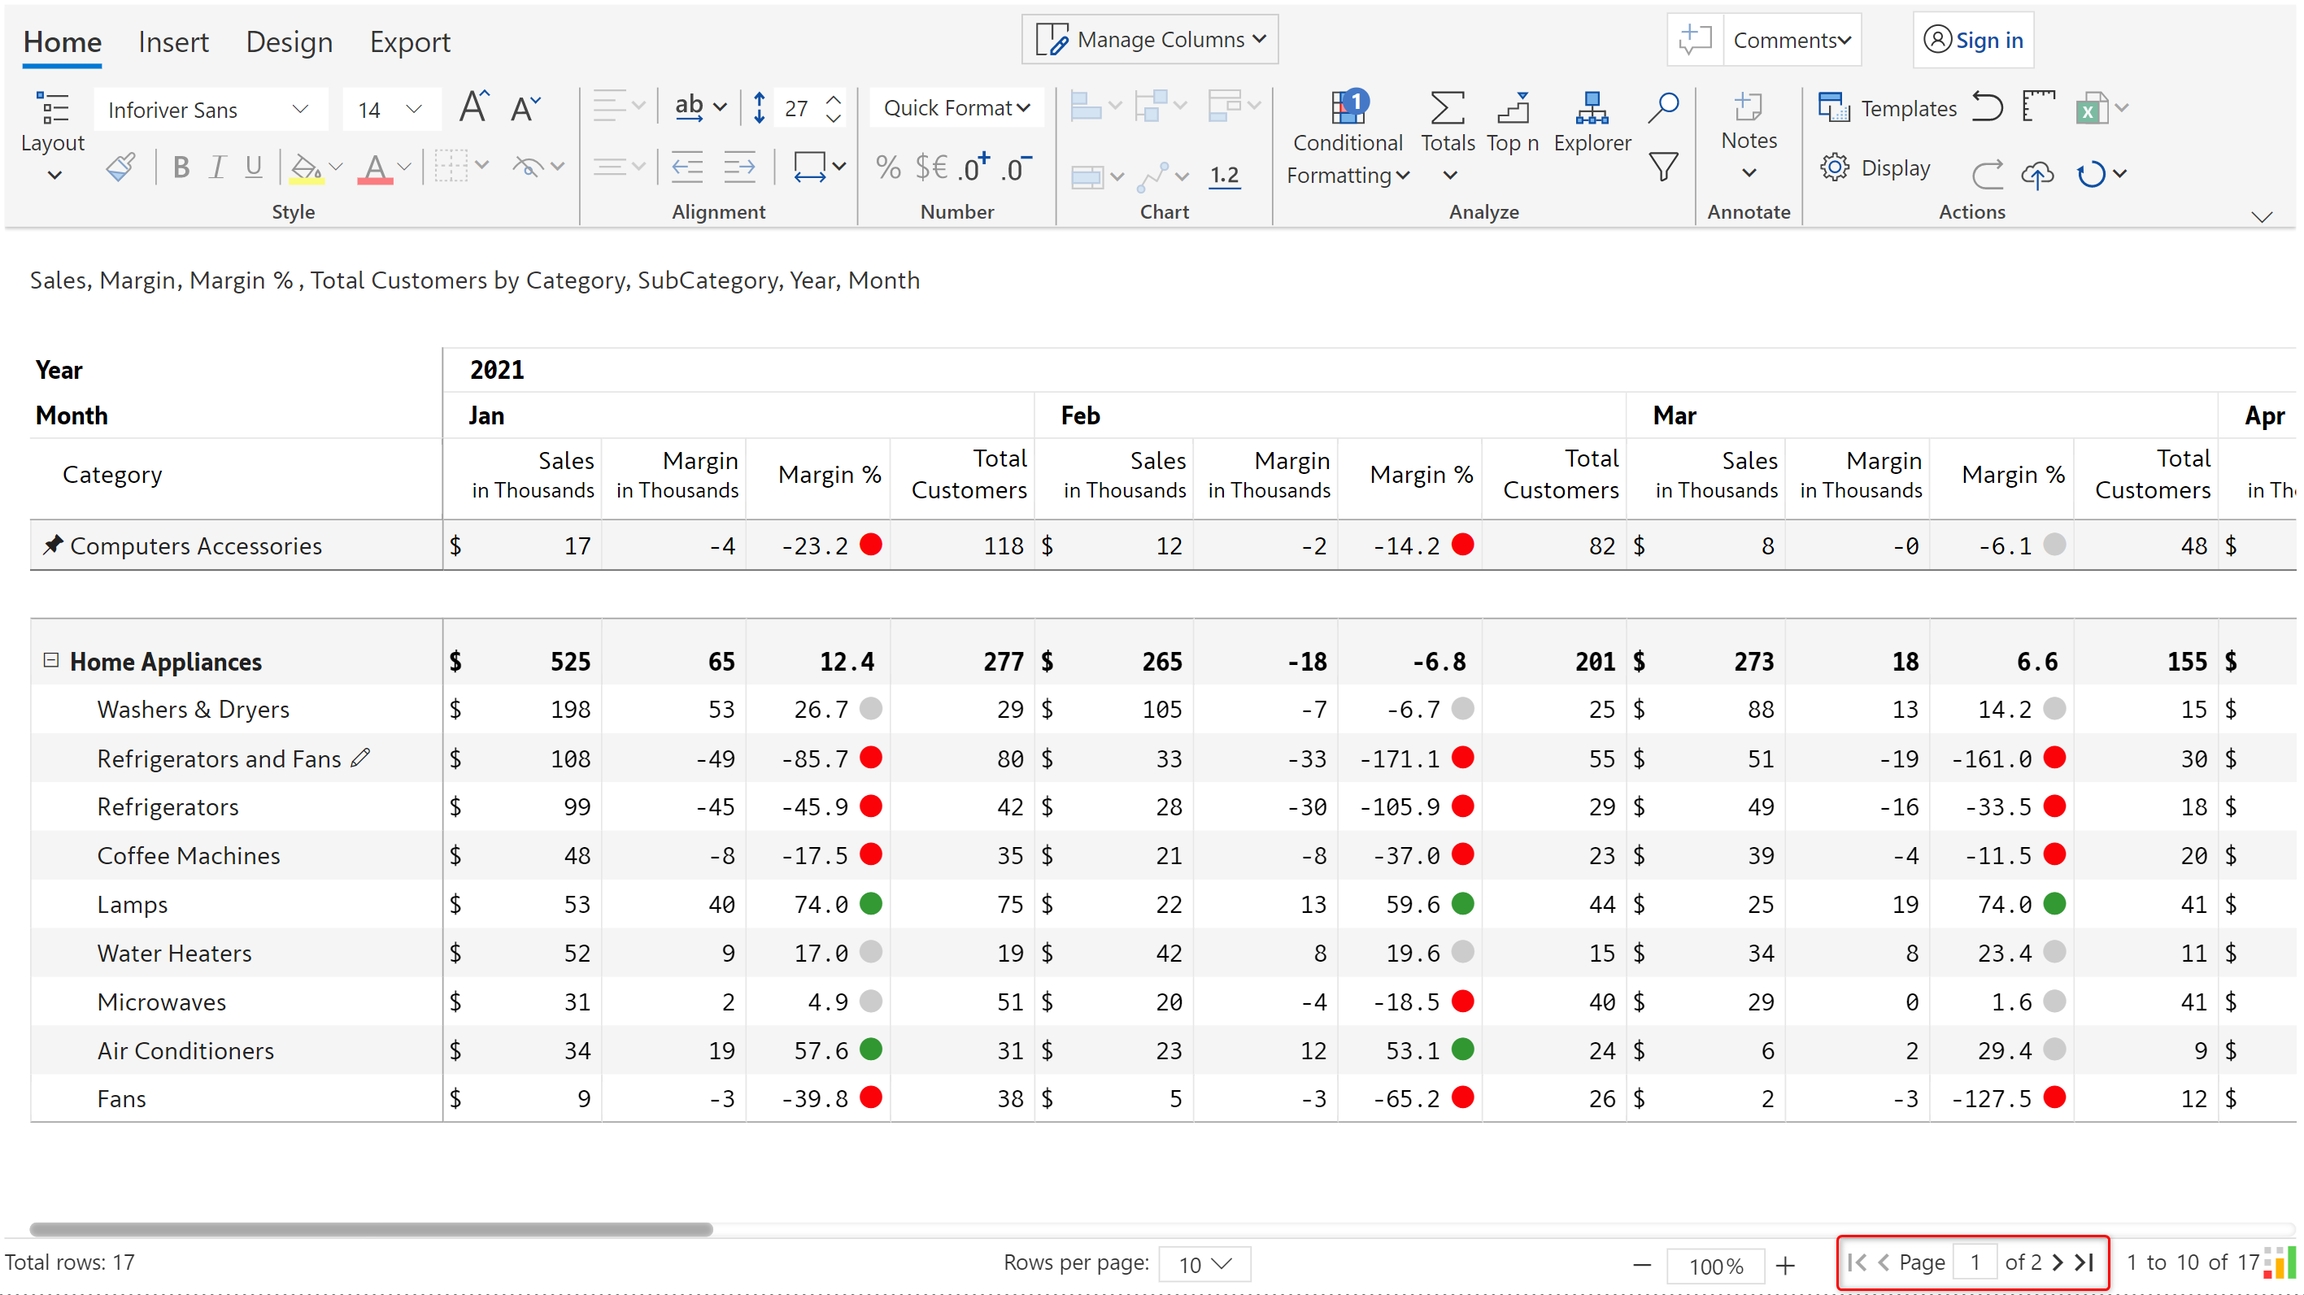
a) Hover over the row and click on the 'Pin' icon.

b) Computer accessories is pinned to the top.

c) If you navigate to another page in the visual, you can see that the row is still pinned.

2. Pin columns

In this example, we have monthly data for sales, margin, and customers. We would like to focus on last month's sales.

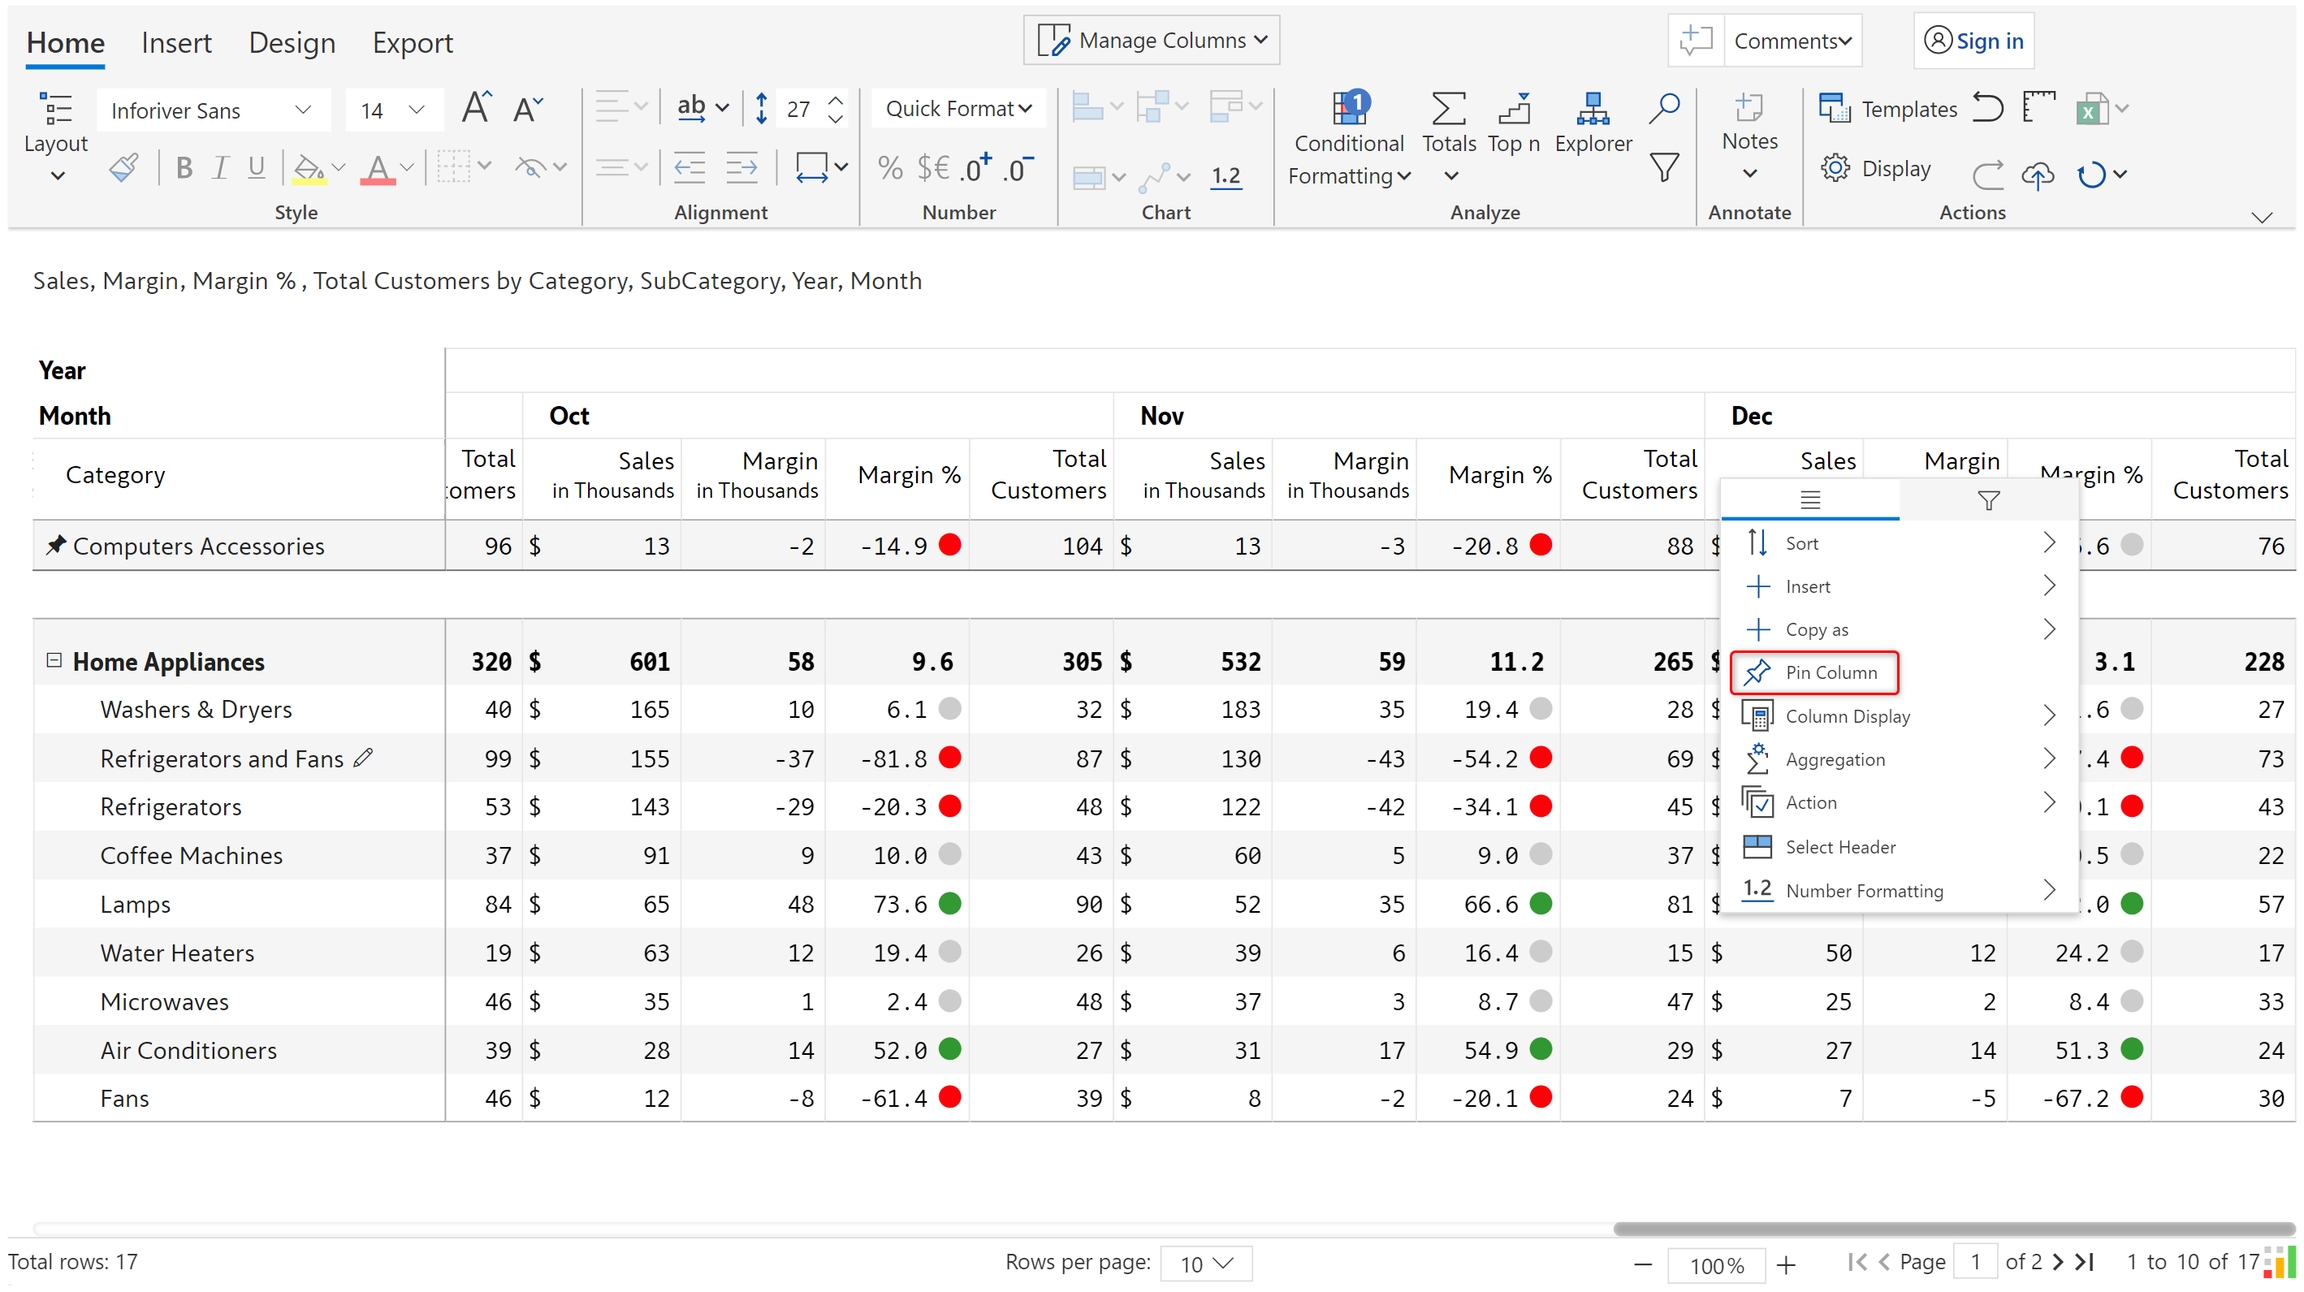
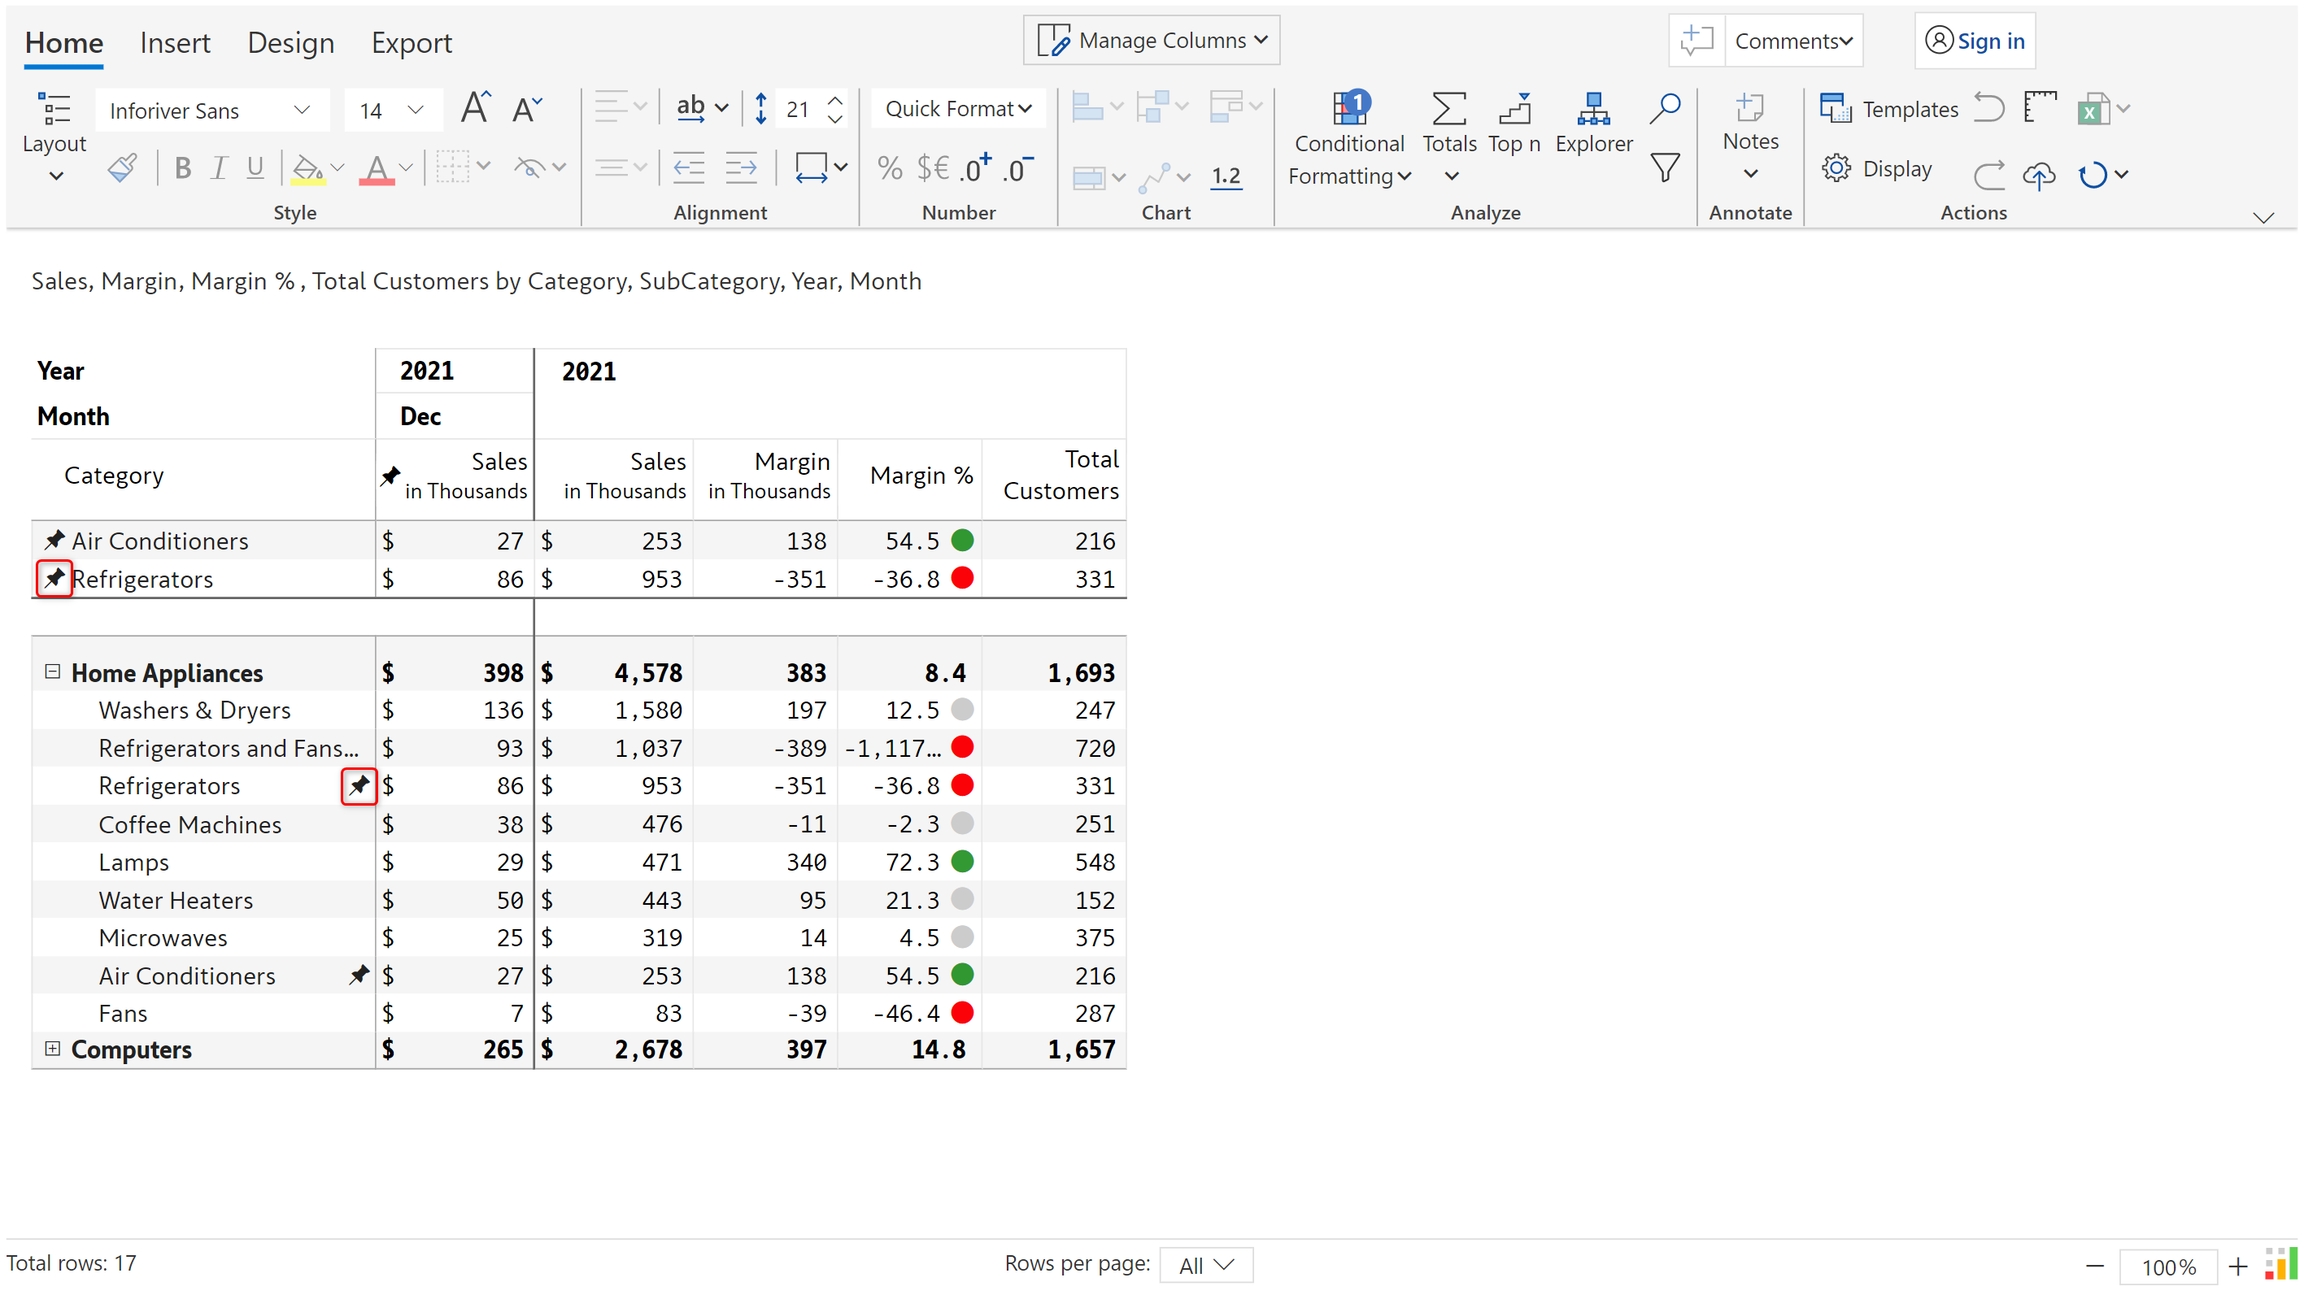
a) To do this, we can pin December sales. Hover over the column and click on the gripper.

b) Click on the 'Pin column' option.

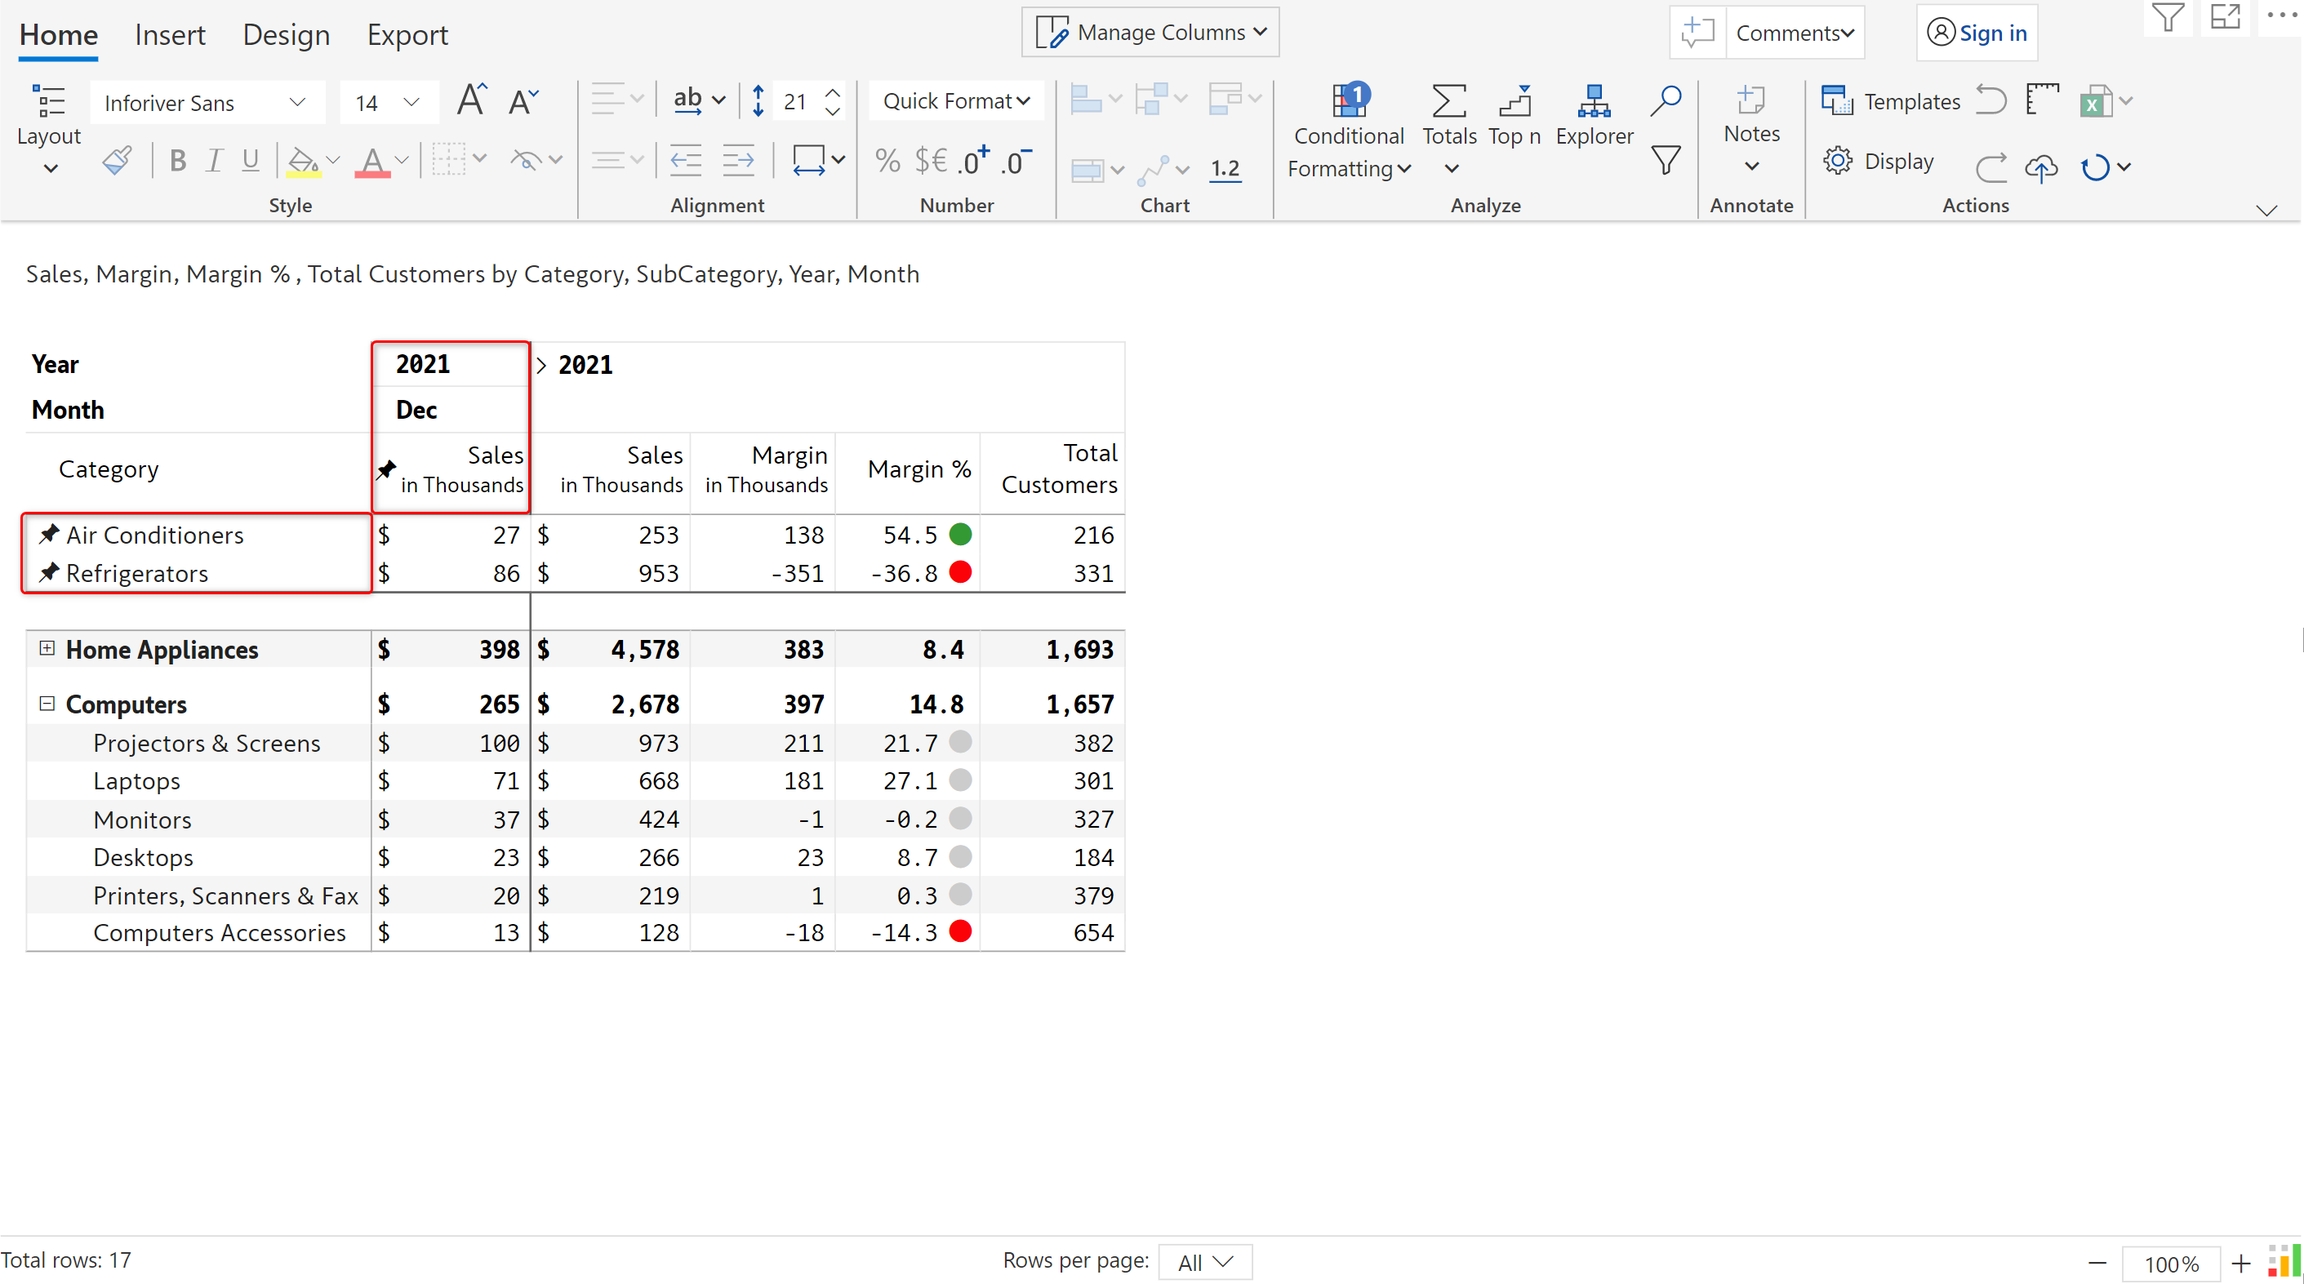
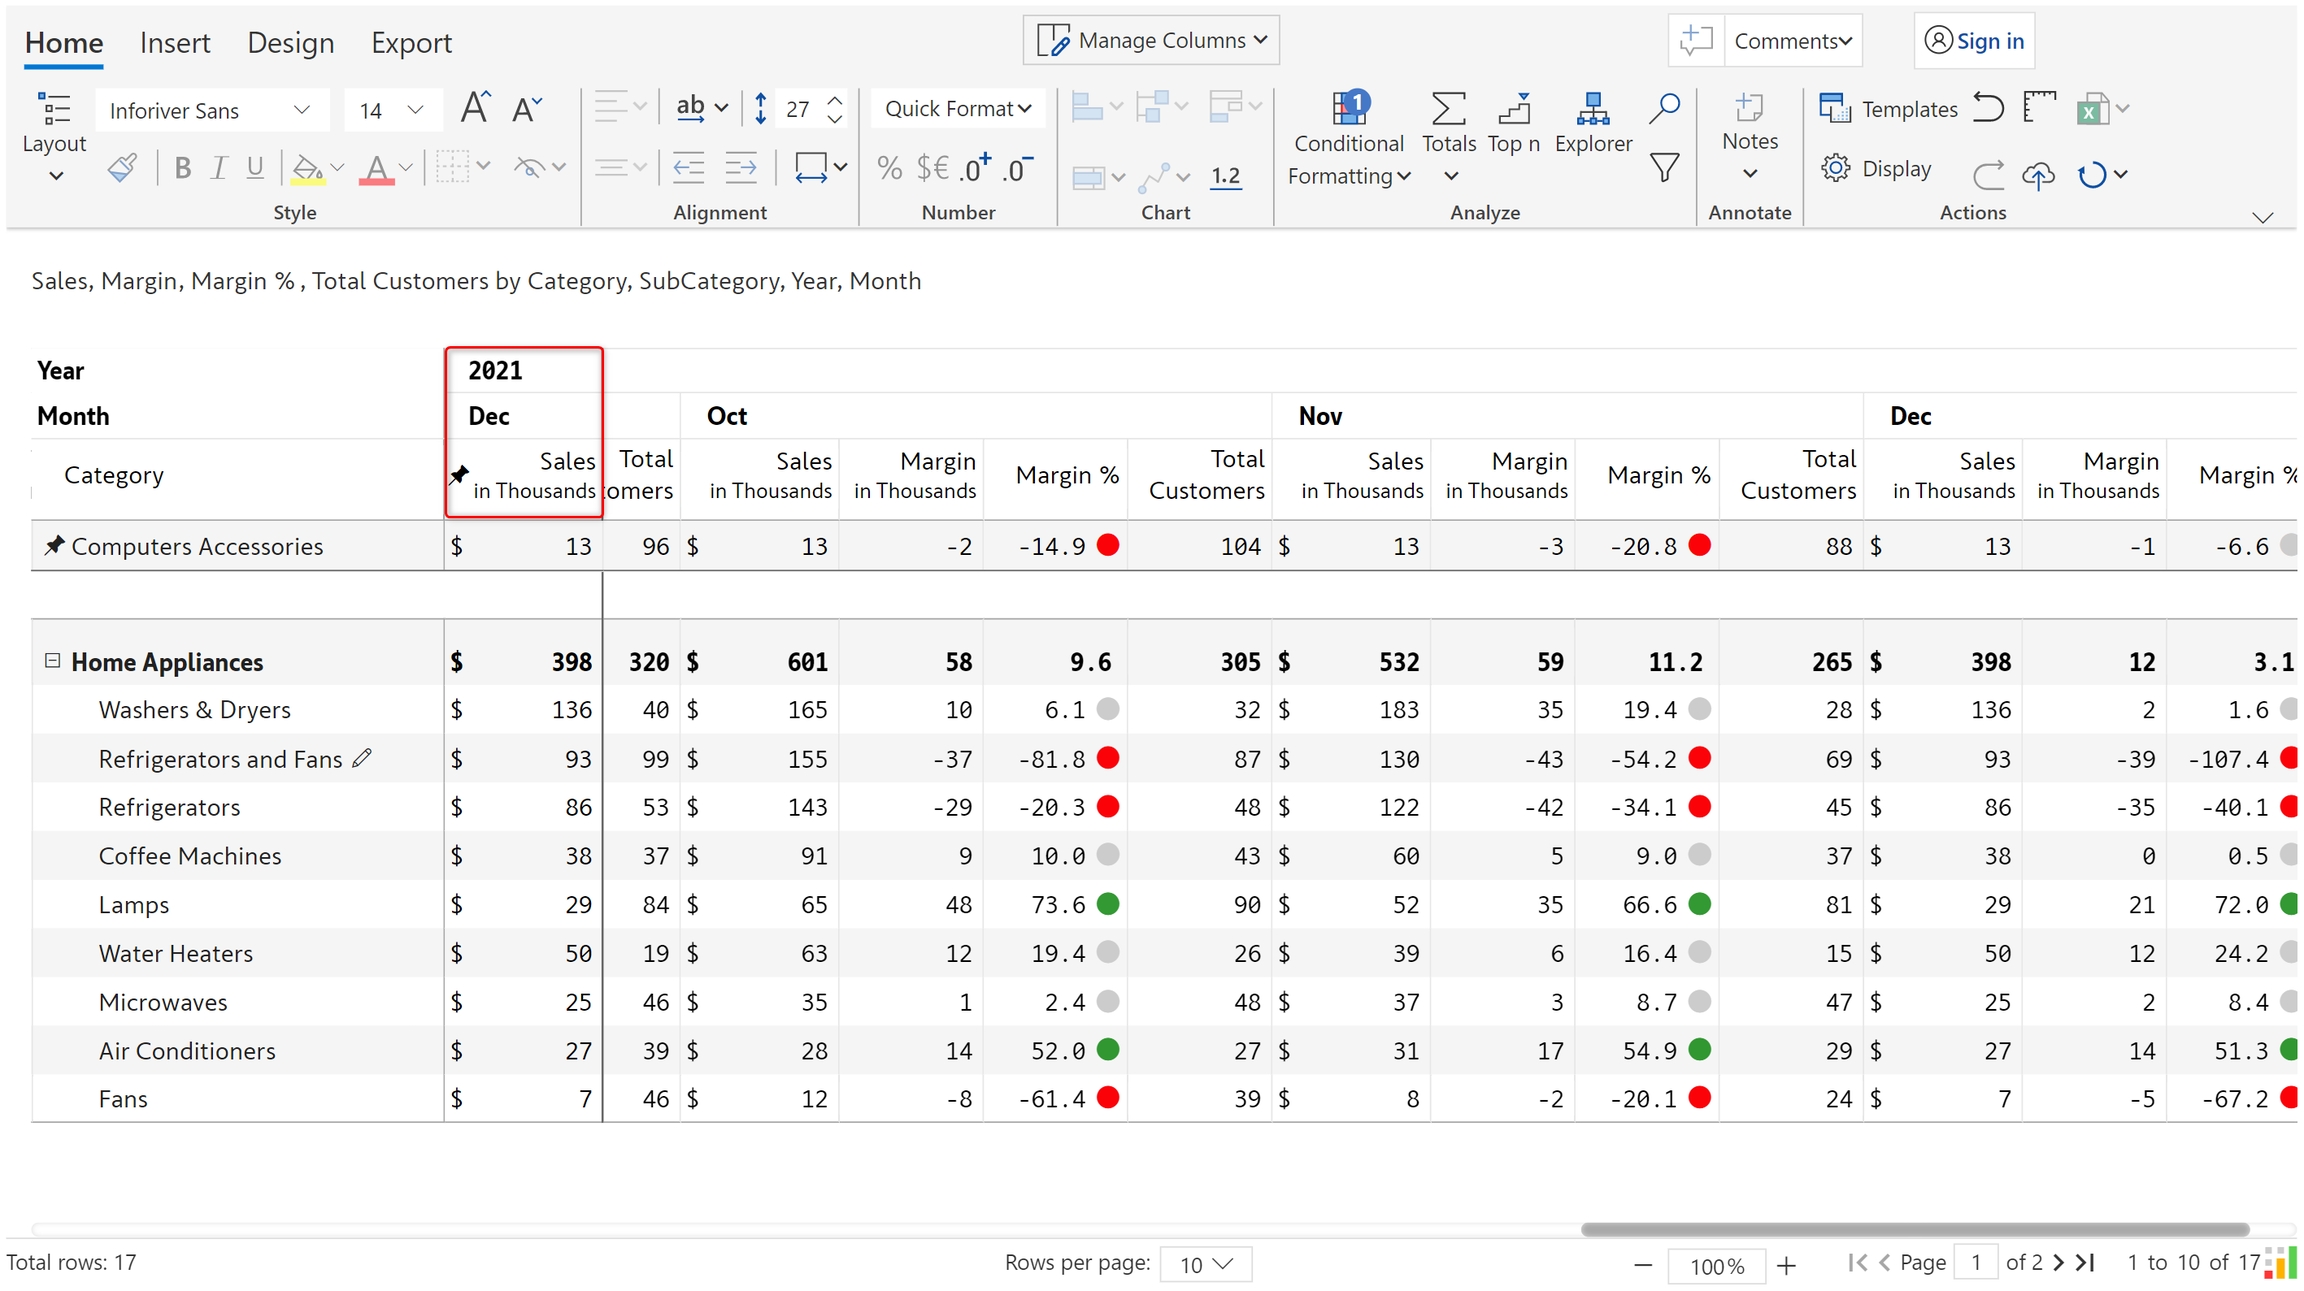
c) December sales gets pinned to the left.

3. Unpin

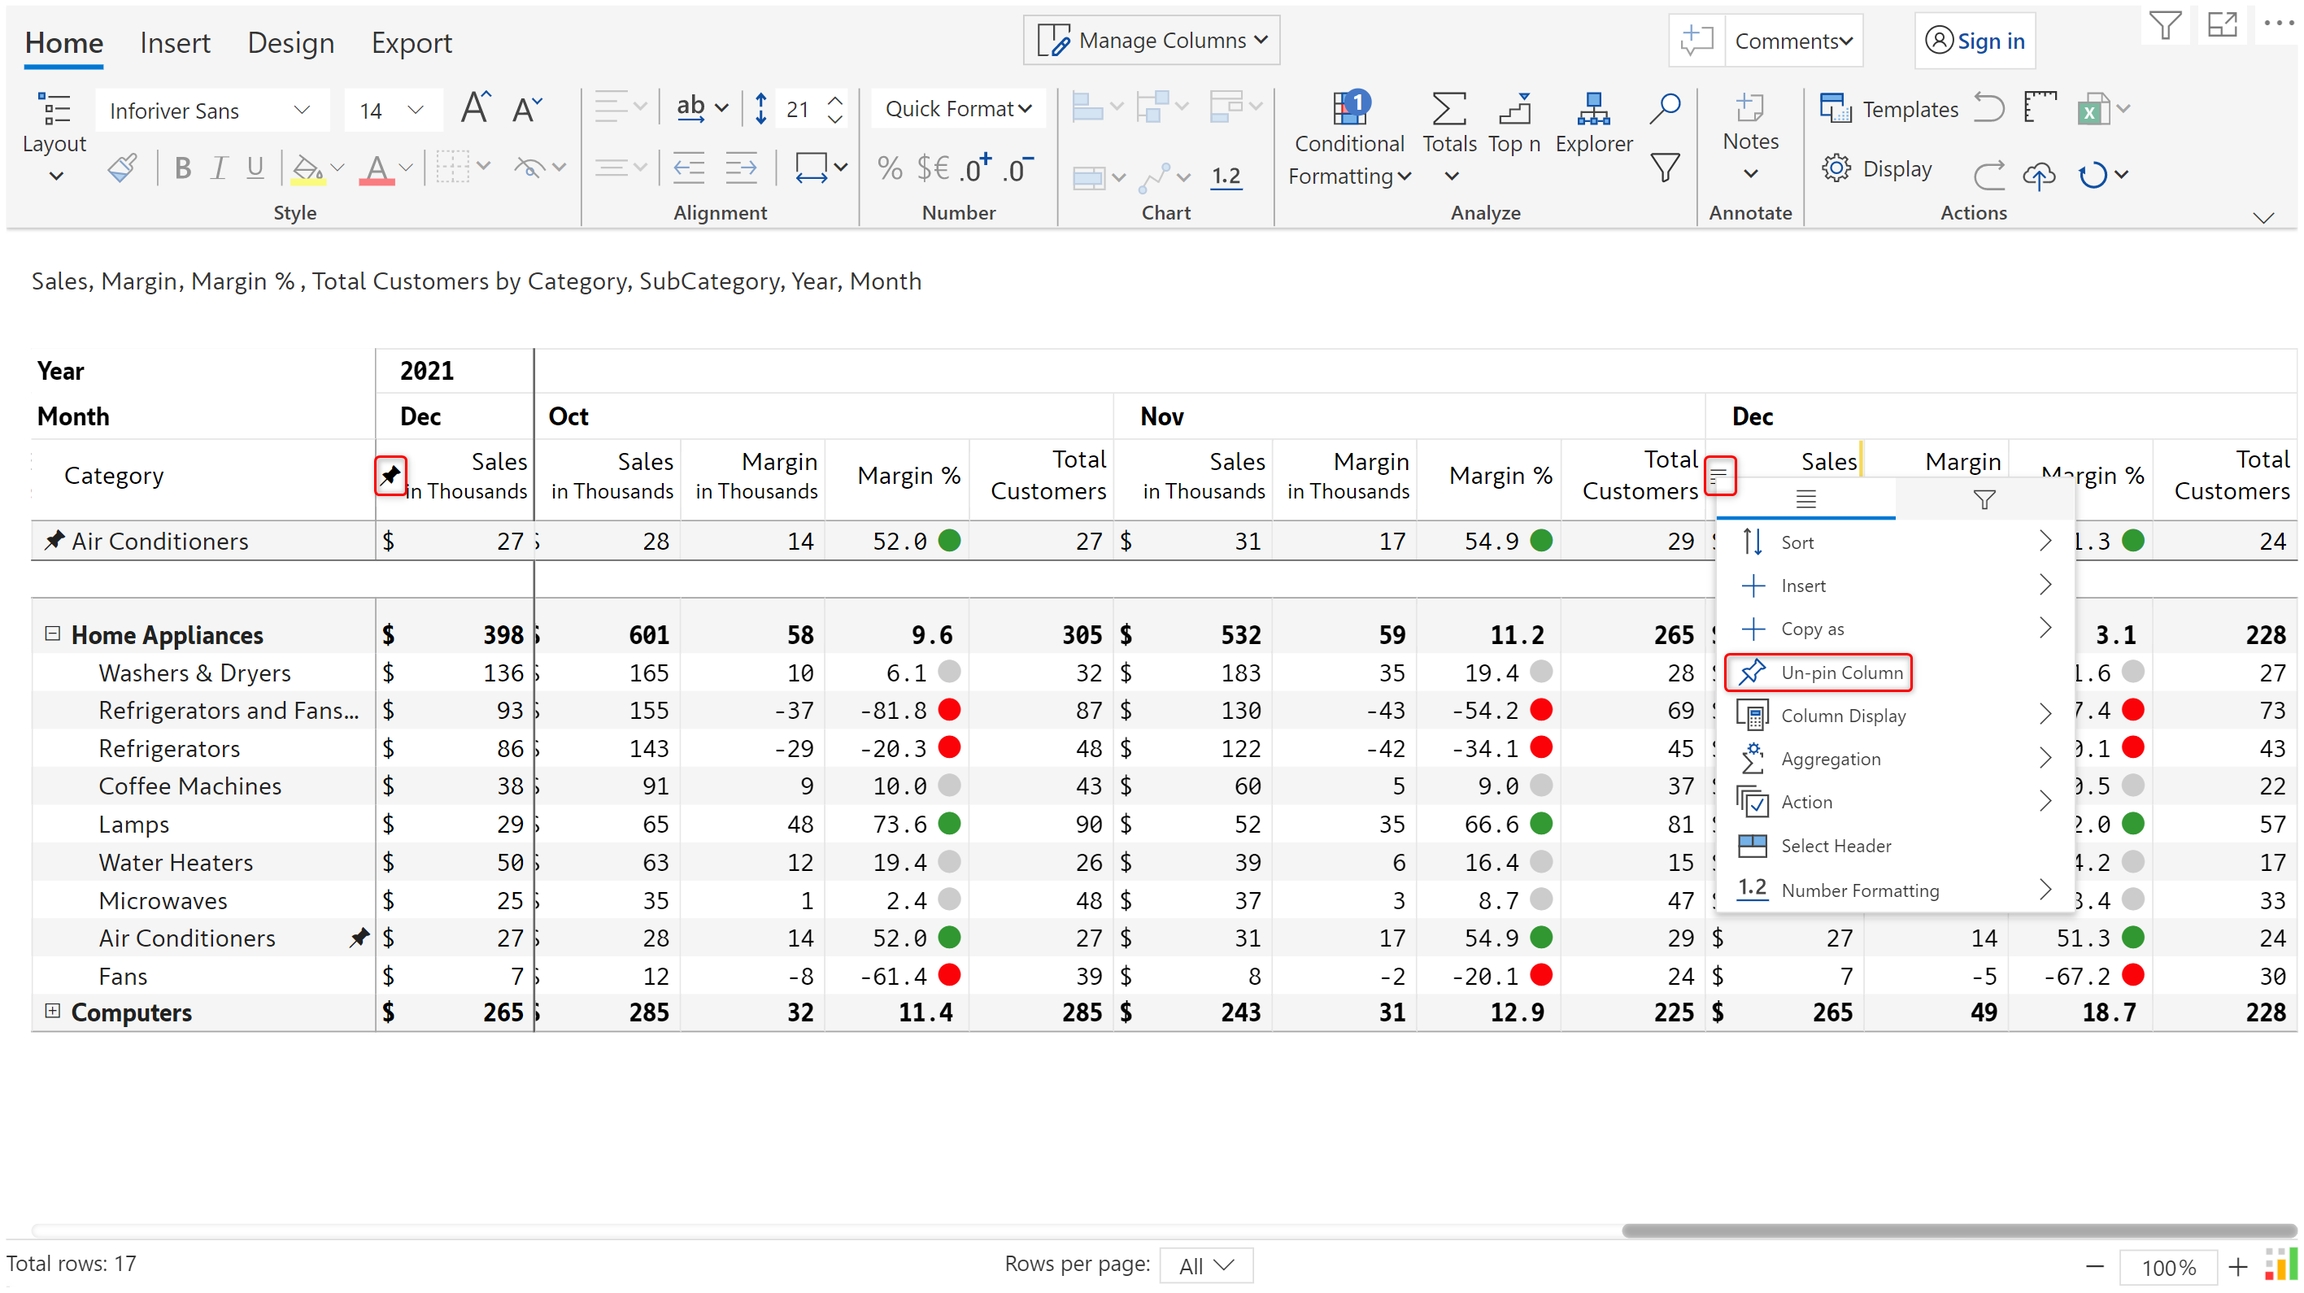
a) To unpin an individual row, click on the pinned icon in either the pinned section or the original row as shown below.

b) To unpin an individual column, you can click on the pinned icon in the pinned section. Or, click on the column gripper and the un-pin column option.

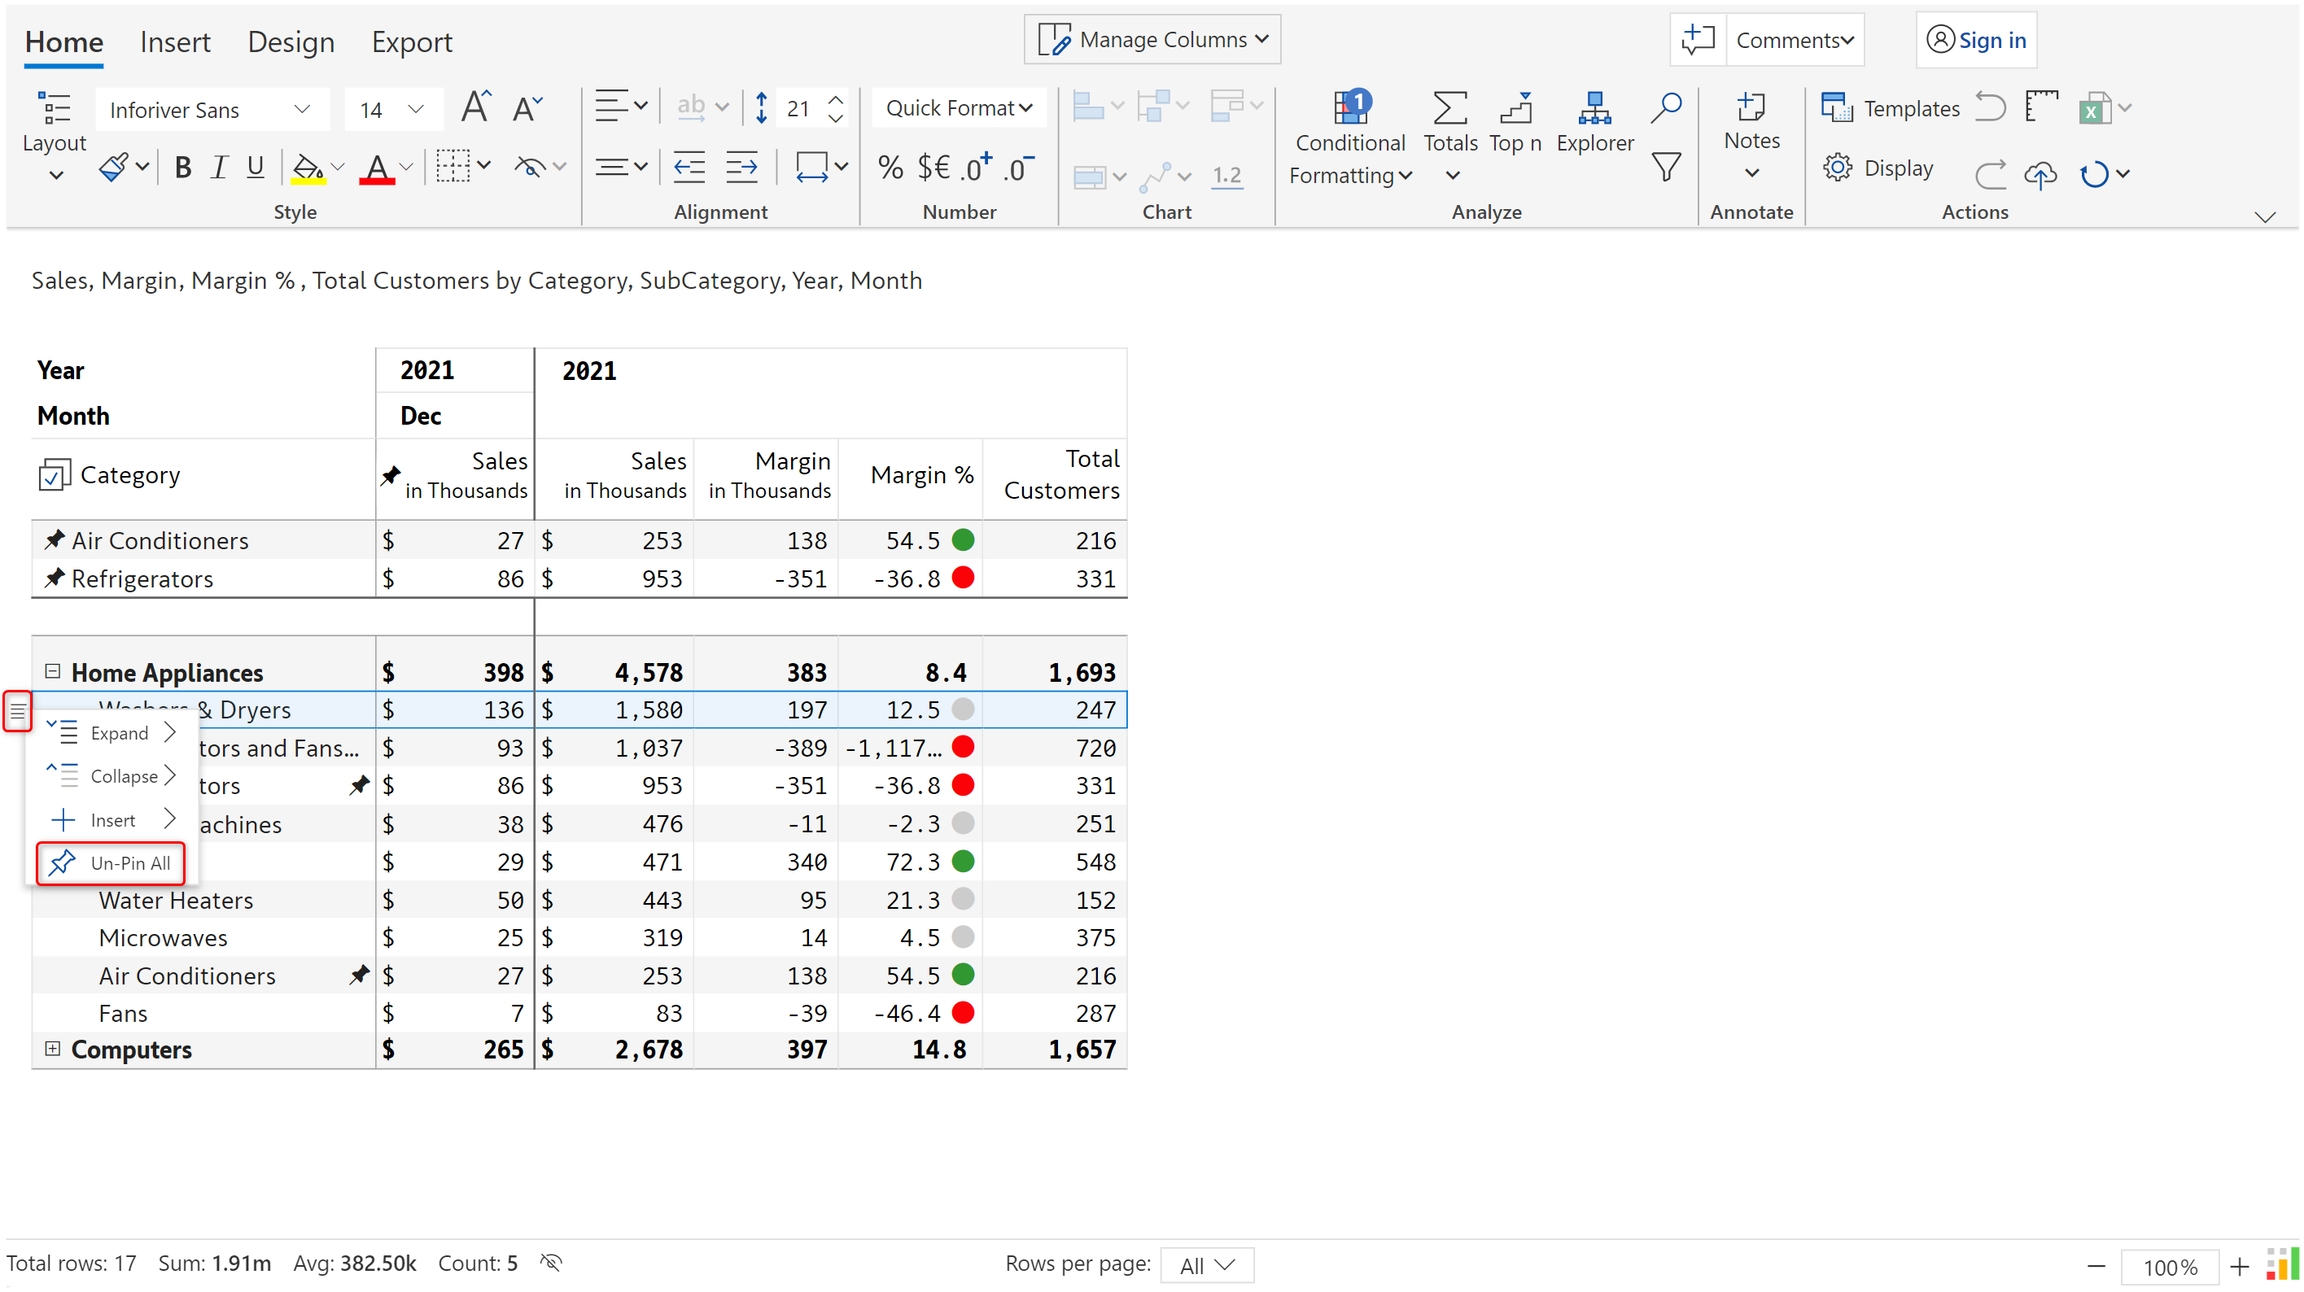
c) When there are multiple pinned rows and columns, you can quickly un-pin the rows and columns by using the corresponding ‘un-pin all’ option from the row/column gripper.

In the next section, you can find a list of the available .

keyboard shortcuts
Pinned rows and columns
Pin rows to the top
Pinned to the top
Row is pinned across pages
Click on the column gripper
Pin column option in the column gripper
Column pinned to the left
Unpin row
Unpin column
Unpin all