Inforiver
Premium Table
Premium Table
  • Introduction to Premium Table
    • Get Started
      • Installing from AppSource
      • Installing Inforiver for your organization (Org visual)
      • Inforiver Customer Portal
        • Billing Admin
          • Update Profile
          • Update Subscriptions
        • License Admin
      • Licensing
        • License renewal
      • Registering Inforiver on Azure AD (Entra ID)
  • Working with Premium Table
    • 1. Build your first Inforiver Table report
    • 2. Displaying information
      • Report interface
      • Templates
      • Basic formatting
        • Number formatting
        • Cell, header & value formatting
        • Row totals
        • Insert blank rows
      • Basic inline charts
    • 3. Basic interactions
      • Explore & filter data
        • Search & Filter
        • Explorer
        • Top N + others
      • Sort & reorder data
      • Show/hide values
      • Manage column widths
      • Manage hierarchies
      • Create visual hierarchies
      • Pin rows & columns
      • Blend measures
      • Dynamic measure headers
      • Context menus
        • Column gripper
        • Row gripper
      • Actions
        • Rails
        • Toolbar options
        • Keyboard shortcuts
        • Reset
    • 4. Adding business logic and formulae
      • Insert calculated rows
        • Template rows
      • Insert calculated columns
      • Insert manual input rows
      • Insert manual input columns
        • Number
        • Dropdown
          • Dropdown options from semantic models
          • Lookup visuals for dropdowns
        • Text, checkbox & date
        • Writeback Matrix features
        • Importing data
      • Invert sign
      • Editing cells
      • Quick formula
      • Visual column inside visual measures
      • Manage inserted rows
      • Manage inserted measures & columns
      • Pivot data
      • Insert image URLs
    • 6. Working with charts
      • Sparkline charts
      • Stacked charts
      • Bullet charts and clustered bar charts
      • Waterfall charts
      • Bar and pin charts
      • Change/deviation charts
    • 5. Conditional formatting
      • One-click options
      • Create rule
        • Rules (If conditions)
        • Color scale & data bars
        • Classification
        • Ranking
      • Manage rules
    • 7. Planning, budgeting & forecasting
      • What-if analysis & simulations
      • Goal Seek
      • Budgeting & allocations
      • Set version
    • 8. Paginated reporting
      • Pagination
      • Header & footer
        • Text
        • Images
        • Charts
        • KPI cards
      • Report layouts (Report+)
      • Display and themes
    • 10. Exporting reports
      • Export to PDF & Excel
        • Excel export - operational boundaries
      • Ad hoc emails
    • 11. Scheduling reports
      • Create new subscription
        • Select a report
        • Set subscription frequency
        • Select destination(s)
          • Email
          • OneDrive
          • Microsoft Teams
          • SharePoint
        • Review & save subscription
      • Manage your subscriptions
      • Administration
    • 12. Data writeback
      • Settings
        • General Settings
        • Data Settings
        • Destination Settings
        • Writeback security settings
        • Writeback time-out & batch size settings
        • Advanced Settings
      • Destinations
        • Azure SQL (Managed DB)
        • Azure SQL
        • Microsoft SQL Server
        • Synapse Dedicated SQL Pool
        • Azure Data Lake Storage
        • Databricks
        • Snowflake
          • Setting up Snowflake OAuth
        • Amazon Redshift
        • BigQuery
        • SingleStore
        • SAP HANA
        • Oracle
        • PostgreSQL
        • MySQL
        • OneDrive
        • SharePoint
        • Dataverse
        • Fabric Warehouse
        • Fabric lakehouse
        • Fabric SQL
        • URL as destination
      • Logs
      • Reading mode
    • 14. Manage aggregation
      • Row aggregation
      • Column aggregation
    • 18. Variables
      • Variable types
        • Number
        • Select
        • Text
        • Date
        • Date range
        • Boolean
        • Button
      • Variable bookmarks
  • Admin Console
    • Manage Profile
    • User management
      • User Roles and Permissions
      • Create custom roles and policies
    • Settings
      • General
      • Generate builds - on prem
      • Forecast
      • Holidays
      • API token
      • Writeback
      • Managed DB
      • Assets
    • Onboarding actions
    • Writeback
  • Display settings
    • General settings
    • Hierarchy settings
    • Number settings
    • Miscellaneous settings
    • On-load scripting
  • Formula syntax
    • Conditional statements
      • IF
      • IFNA
      • SWITCH
      • FILTERIF
    • Logical functions
      • AND
      • IN
      • ISBLANK
      • ISEMPTY
      • ISNUMBER
      • NOT
      • OR
      • XOR
    • Math functions
      • ABS
      • AVERAGE
      • AVERAGEEXNEG
      • AVERAGEEXZERO
      • AVERAGEEXZERONEG
      • AVERAGEIF
      • CEILING
      • COUNT
      • COUNTIF
      • DIVIDE
      • EVEN
      • EXP
      • FLOOR
      • INDEXOF
      • LOG
      • ODD
      • MAX
      • MIN
      • NORMDIST
      • NORMSDIST
      • NORMINV
      • NORMSINV
      • PCT
      • POWER
      • RAND
      • RANDBETWEEN
      • ROUND
      • ROUNDDOWN
      • ROUNDUP
      • MROUND
      • SORT
      • SQRT
      • SUM
      • PMT
    • Text formatting functions
      • CONCATENATE
      • HYPERLINK
      • LEFT
      • LOWER
      • MID
      • PROPER
      • REPLACE
      • REPT
      • RIGHT
      • TEXT
      • TRIM
      • UPPER
      • VALUE
    • Date functions
      • DATEADD
      • DATEDIFF
      • DAY
      • DATE
      • DATE.SET
      • DATE.FORMAT
      • SOWEEK
      • SOMONTH
      • SOQTR
      • SOYEAR
      • EOWEEK
      • EOMONTH
      • EOQTR
      • EOYEAR
      • NETWORKDAYS
      • ADDDAYS
      • ADDWEEKS
      • ADDMONTHS
      • ADDQTRS
      • ADDYEARS
      • FROMEXCELDATE
      • MONTH
      • NOW
      • PERIOD_RANGE
      • TODAY
      • TOEXCELDATE
      • YEAR
    • Time intelligence functions
      • AGGREGATE
      • FILTER
      • COLUMN_PERIOD
      • LASTNDAY
      • LASTNMONTH
      • LASTNQTR
      • LASTNYEAR
      • MONTHPERIOD
      • MOVINGAVERAGE
      • MOVINGSUM
      • MTD
      • NEXTNDAY
      • NEXTNMONTH
      • NEXTNQTR
      • NEXTNYEAR
      • QTD
      • QTRPERIOD
      • SHIFT
      • TOTALYTD
      • TOTALQTD
      • TOTALMTD
      • VALUEAT
      • YEARPERIOD
      • YTD
    • Other operators
    • Identifiers
      • CLOSEDPERIOD
      • COLUMN.DATE
      • COLUMN.PARENT
      • COLUMNS
      • CURRENT_PERIOD
      • DESCENDANTS
      • FORECAST.CLOSED_END
      • FORECAST.CLOSED_START
      • FORECAST.OPEN_END
      • FORECAST.OPEN_START
      • GROUP INDEX
      • HAS
      • HAS_ALL
      • HAS_SOME
      • LEAVES
      • LEVEL
      • LOGGEDIN_EMAIL
      • LOGGEDIN_NAME
      • MATCH
      • MAXDATE
      • MEMBERS
      • MINDATE
      • RELATIVE
      • RELATIVE_COLUMN
      • ROW.PARENT
      • ROW.LABEL
    • Scripting functions
      • DISPLAYTOAST
      • EXPORT
      • LAYOUT
      • SETCFRULE
      • SETFILTER
      • SETFILTERBYINDEX
      • SETVISIBILITY
      • SHOWBETWEENPERIOD
      • SHOWCLOSEDFORECAST
      • TOPN
      • DISPLAY SETTINGS
        • SETBLANKLABEL
        • SETSUPPRESSZEROS
        • SETRAGGEDHIERARCHY
        • SEPARATOR
        • SETCOMBINECOLUMNHEADER
        • SEMANTICFORMAT
        • SHOWNULLAS
        • SHOWZEROAS
        • SINGLECHILD
    • Statistical Functions
      • RANK
      • RANKEQ
      • RANKAVG
    • Miscellaneous functions
      • FETCH
      • LOOKUP
    • Measure/Column selection functions
      • GETCOLBETWEENPERIODS
      • GETMEASURE
  • Advanced topics
    • Audit log
    • Backup & restore report config
    • Enterprise themes
    • PowerPoint integration
    • Drill down and roll up in performance mode
  • Accessibility shortcut keys
Powered by GitBook
On this page
  1. Working with Premium Table
  2. 9. Commenting and collaboration

Comments

Unlike , comments allow multiple users to converse over a common thread through replies and mentions. User details and timestamps are accessible, and instant notifications are sent on mentions and replies.

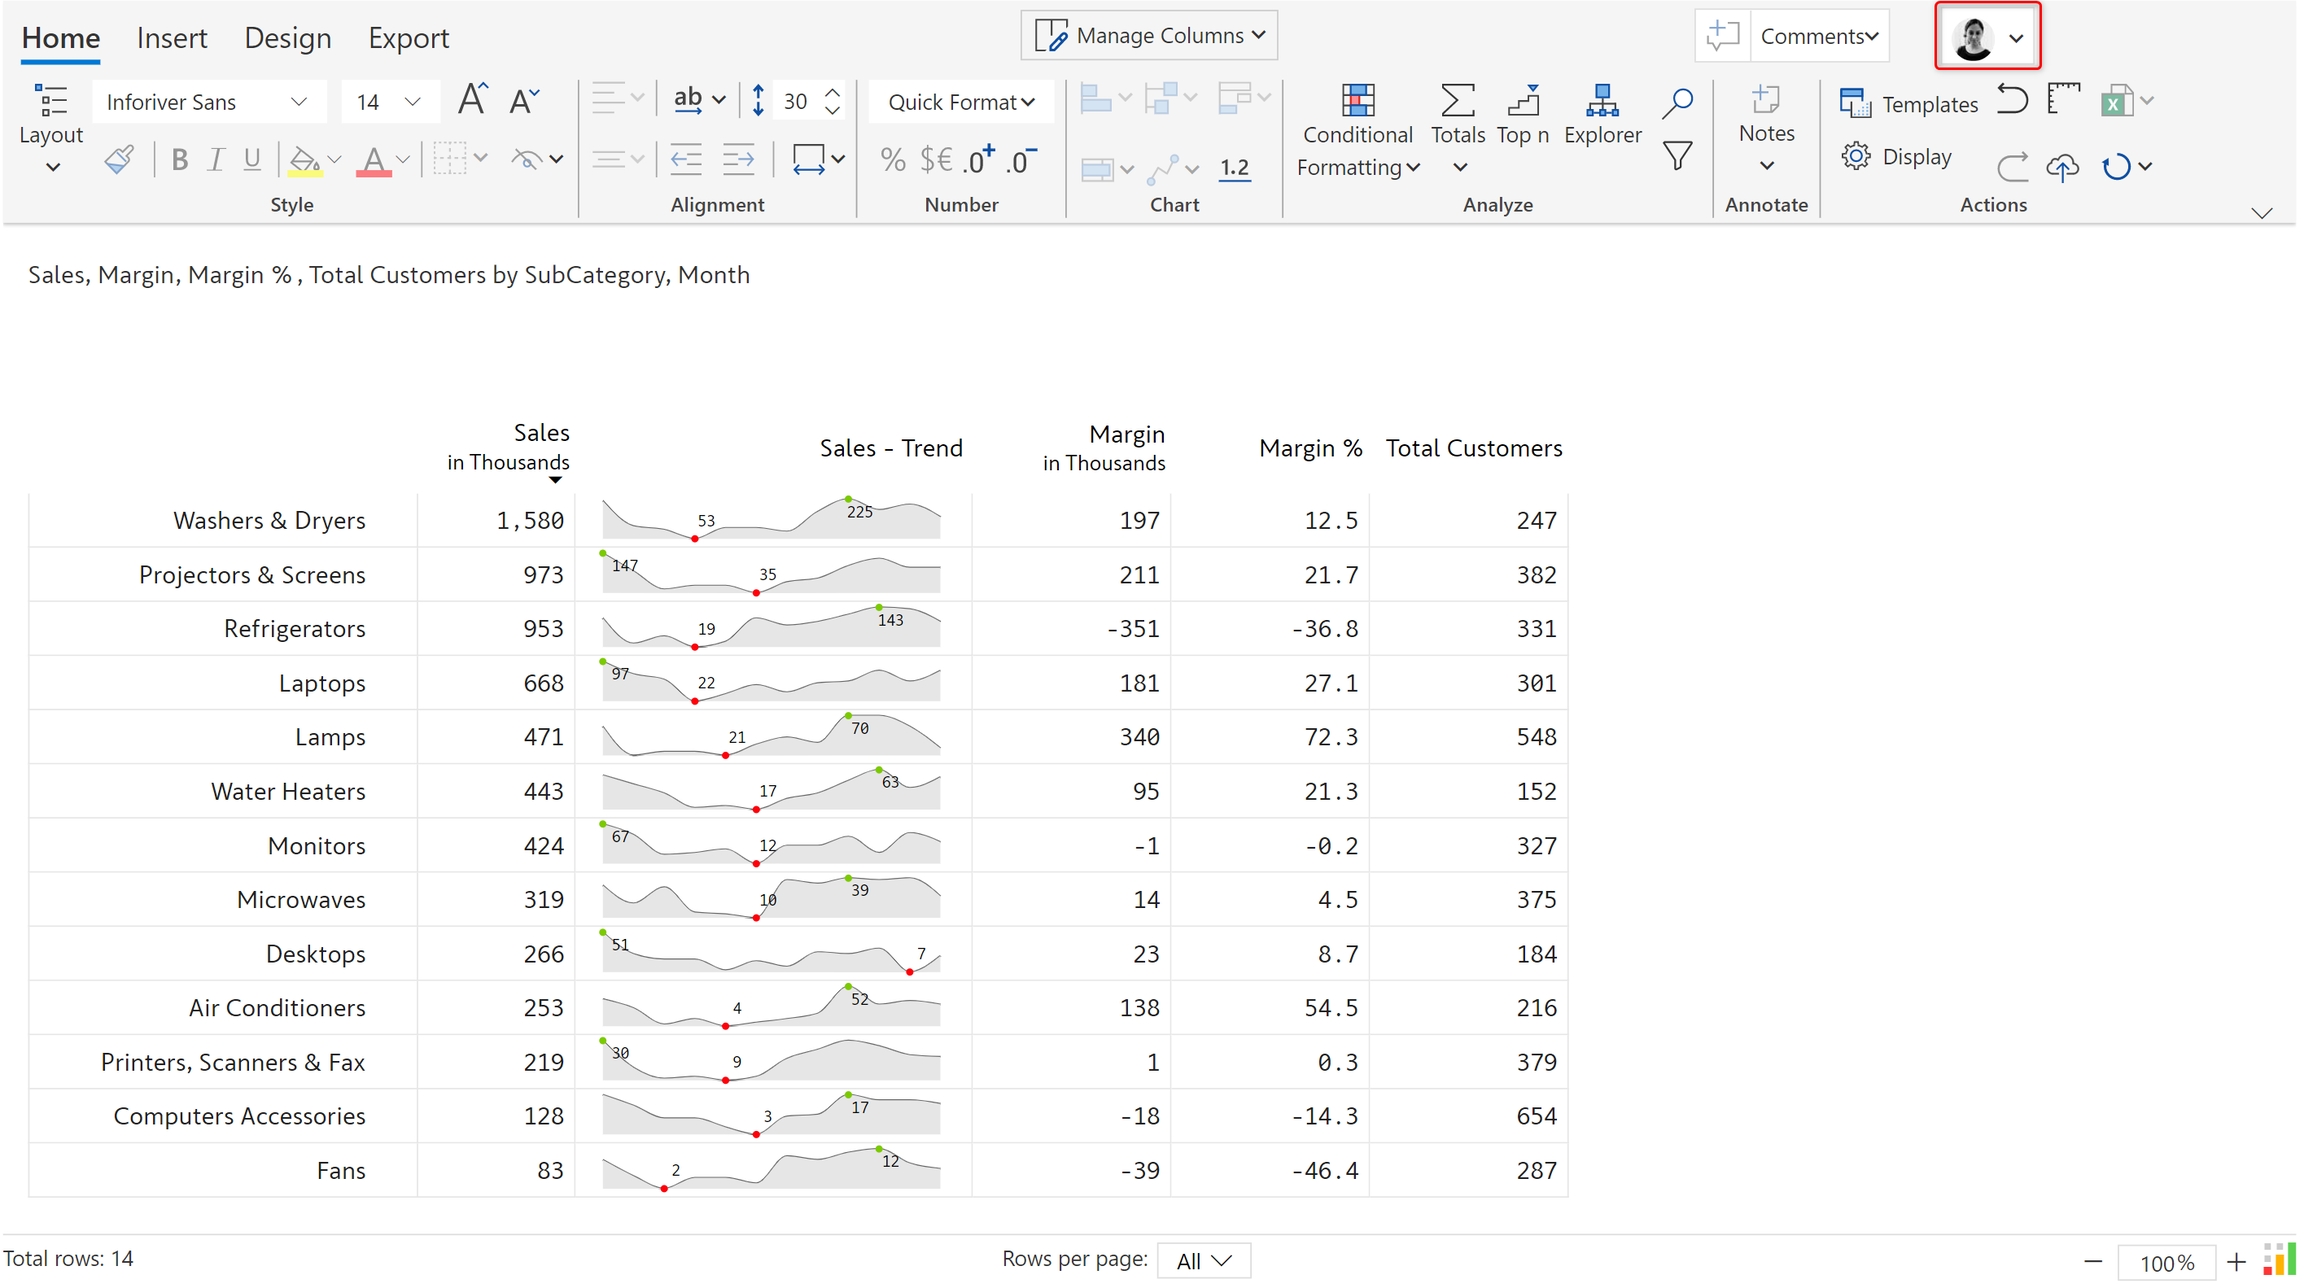
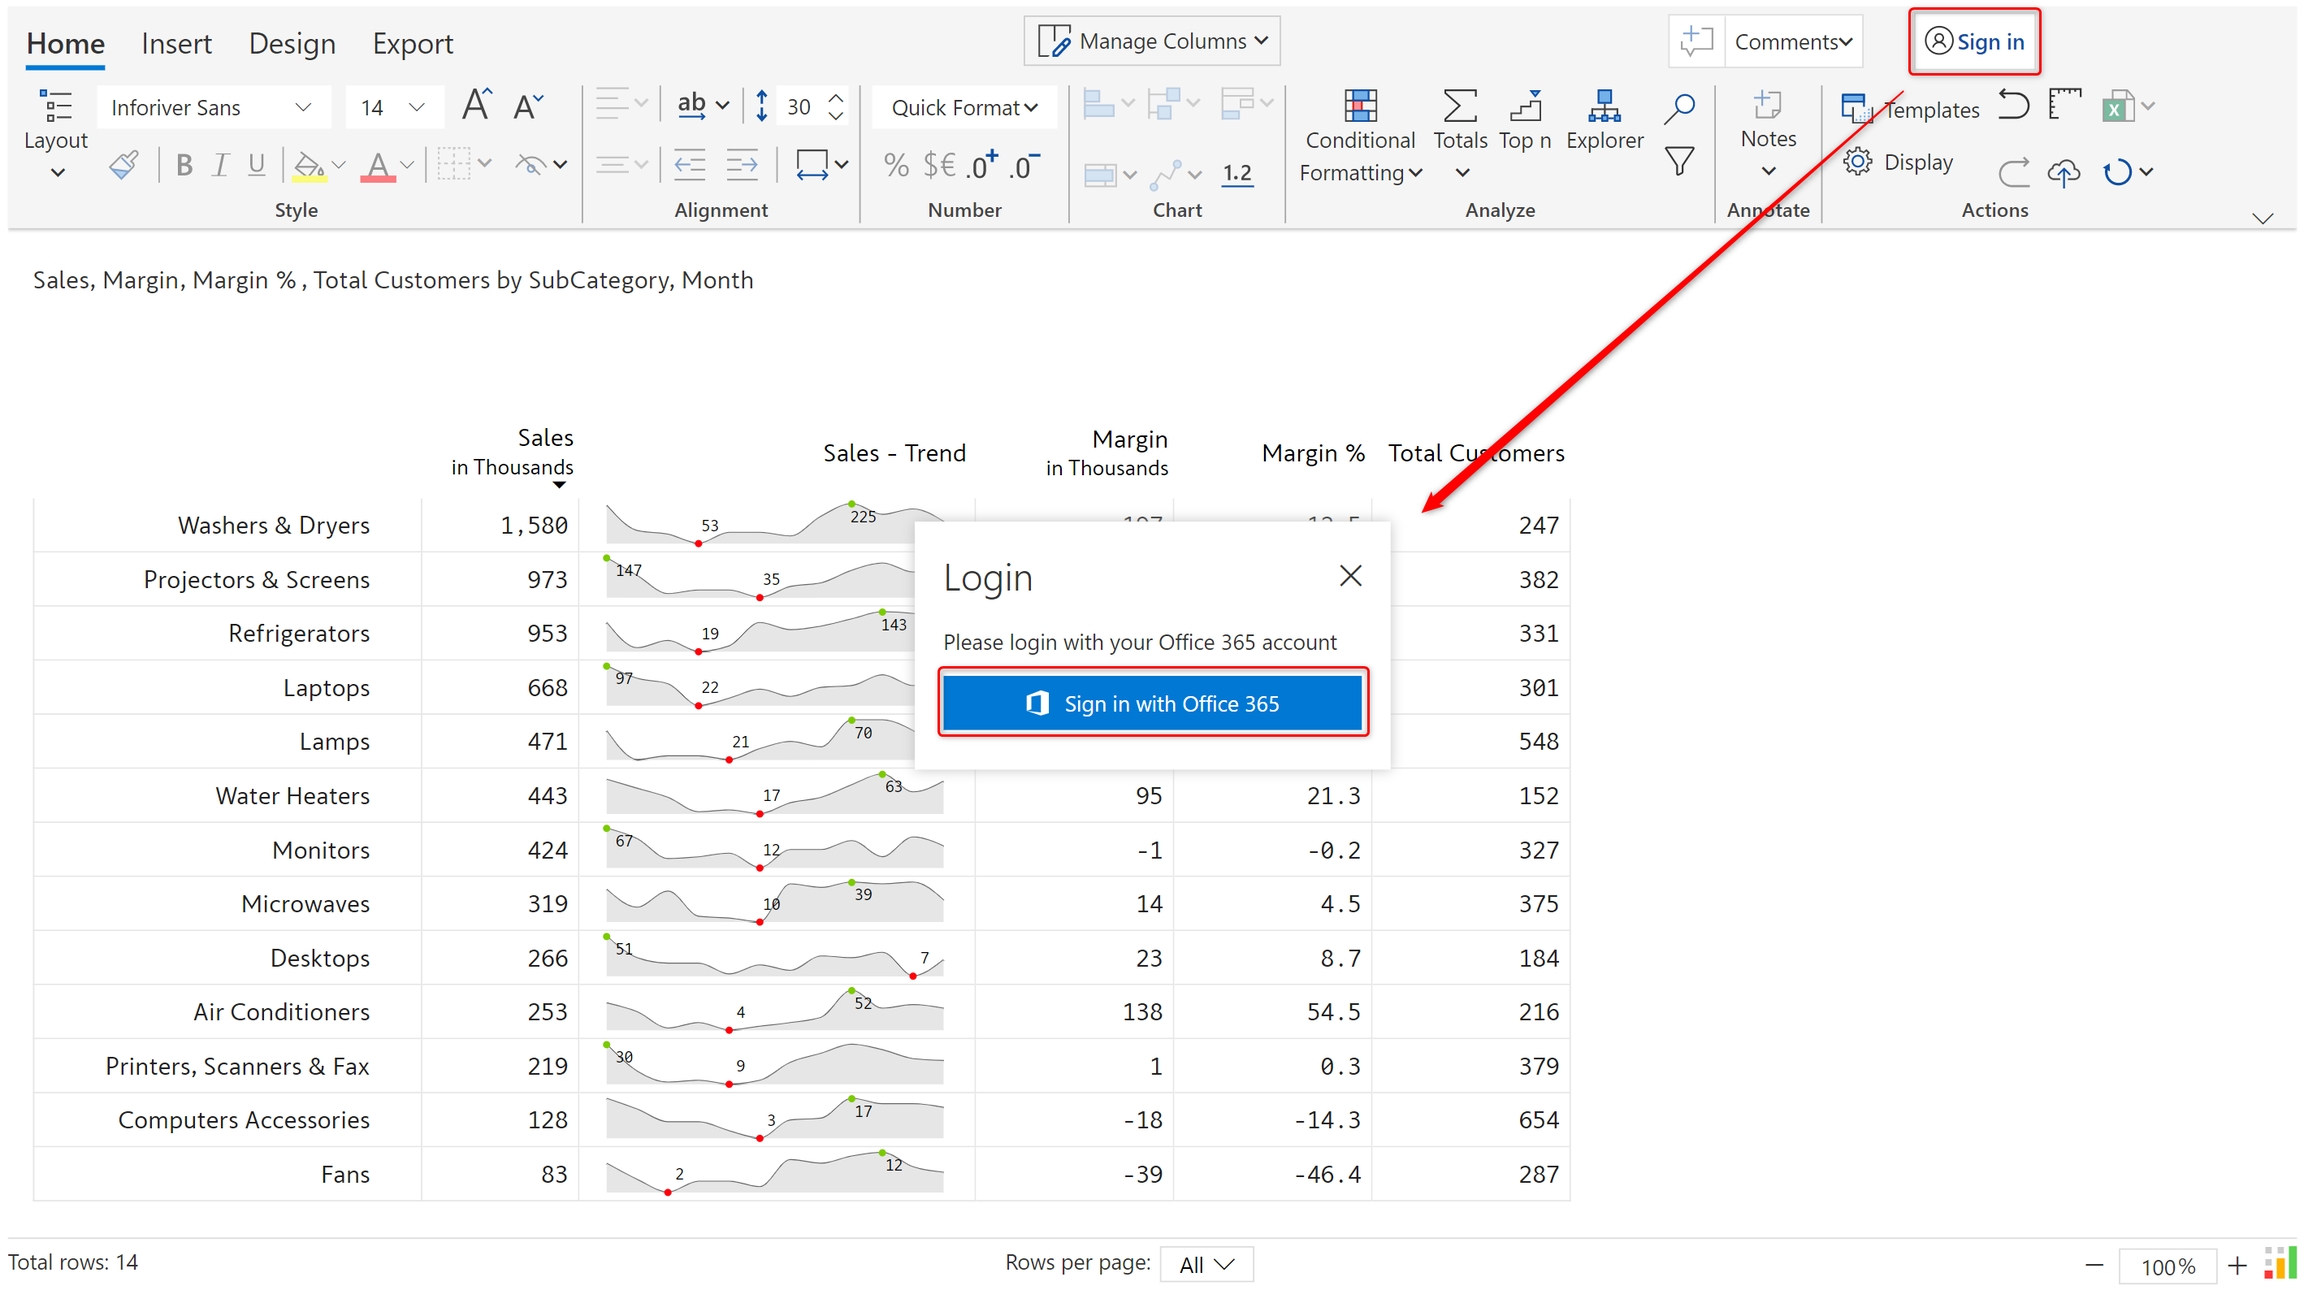
The below image shows a sales report - monthly sales trend for product subcategories, margins, and total customers. Let's see how to add data-level comments and facilitate conversations with your peers directly from within your Power BI report.

Login using O365

As mentioned earlier, collaborative commenting is supported only in Inforiver Writeback Matrix. The first step in using comments is to log in using your O365 account.

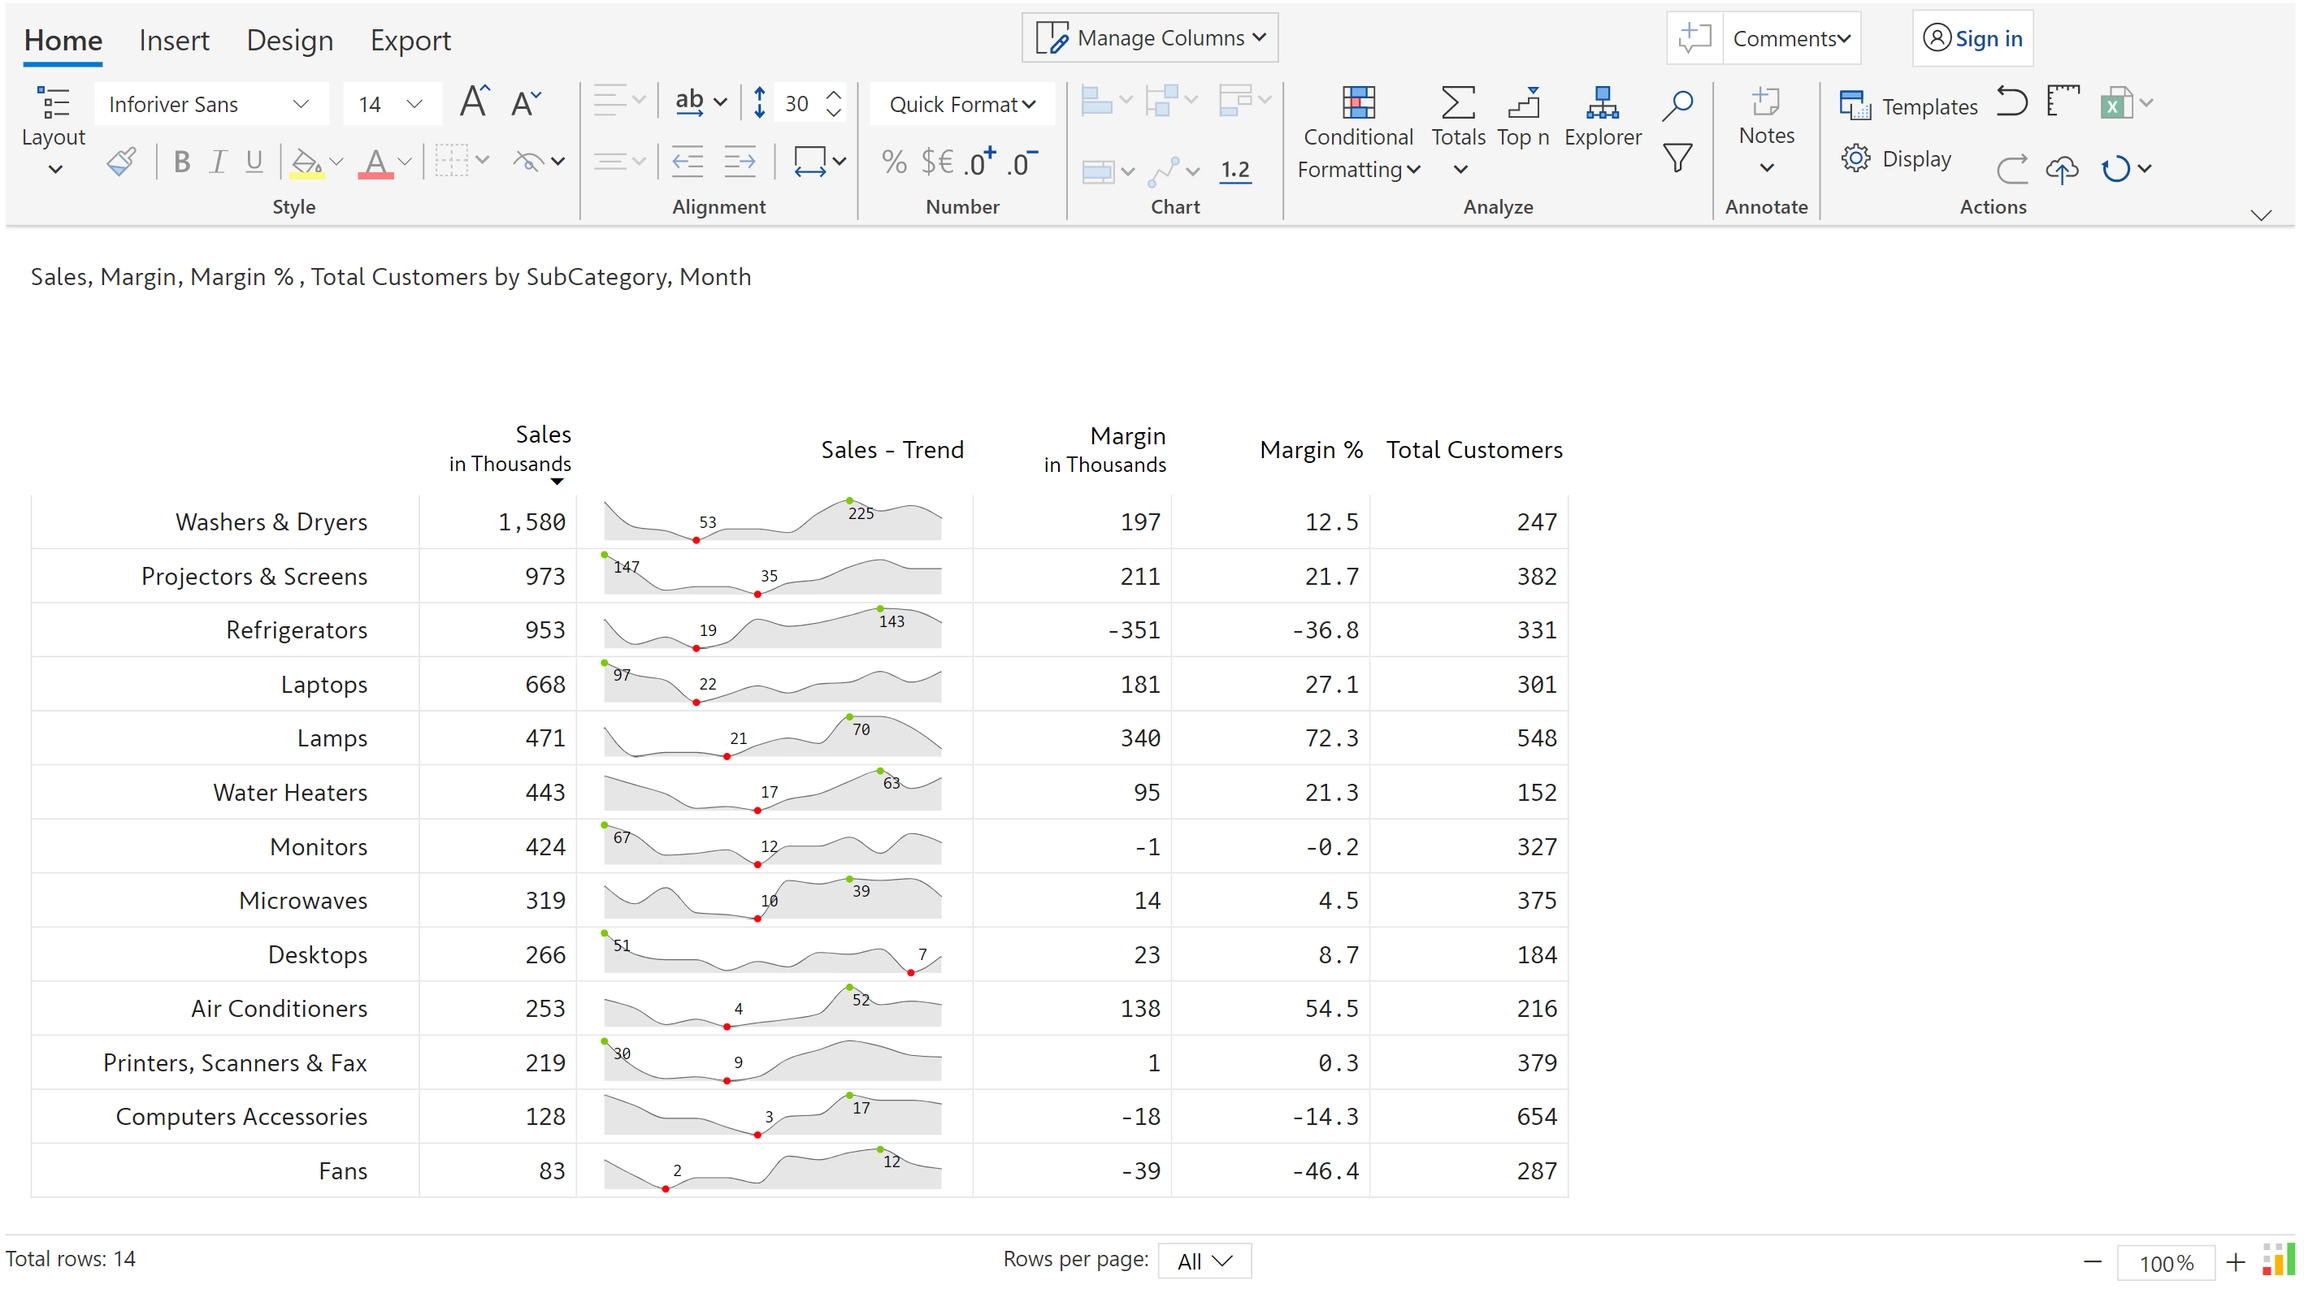
a) Click on 'Sign in' in the top right of the toolbar. You can see a prompt asking you to log in with your Office 365 account. Click 'Sign in with Office 365'.

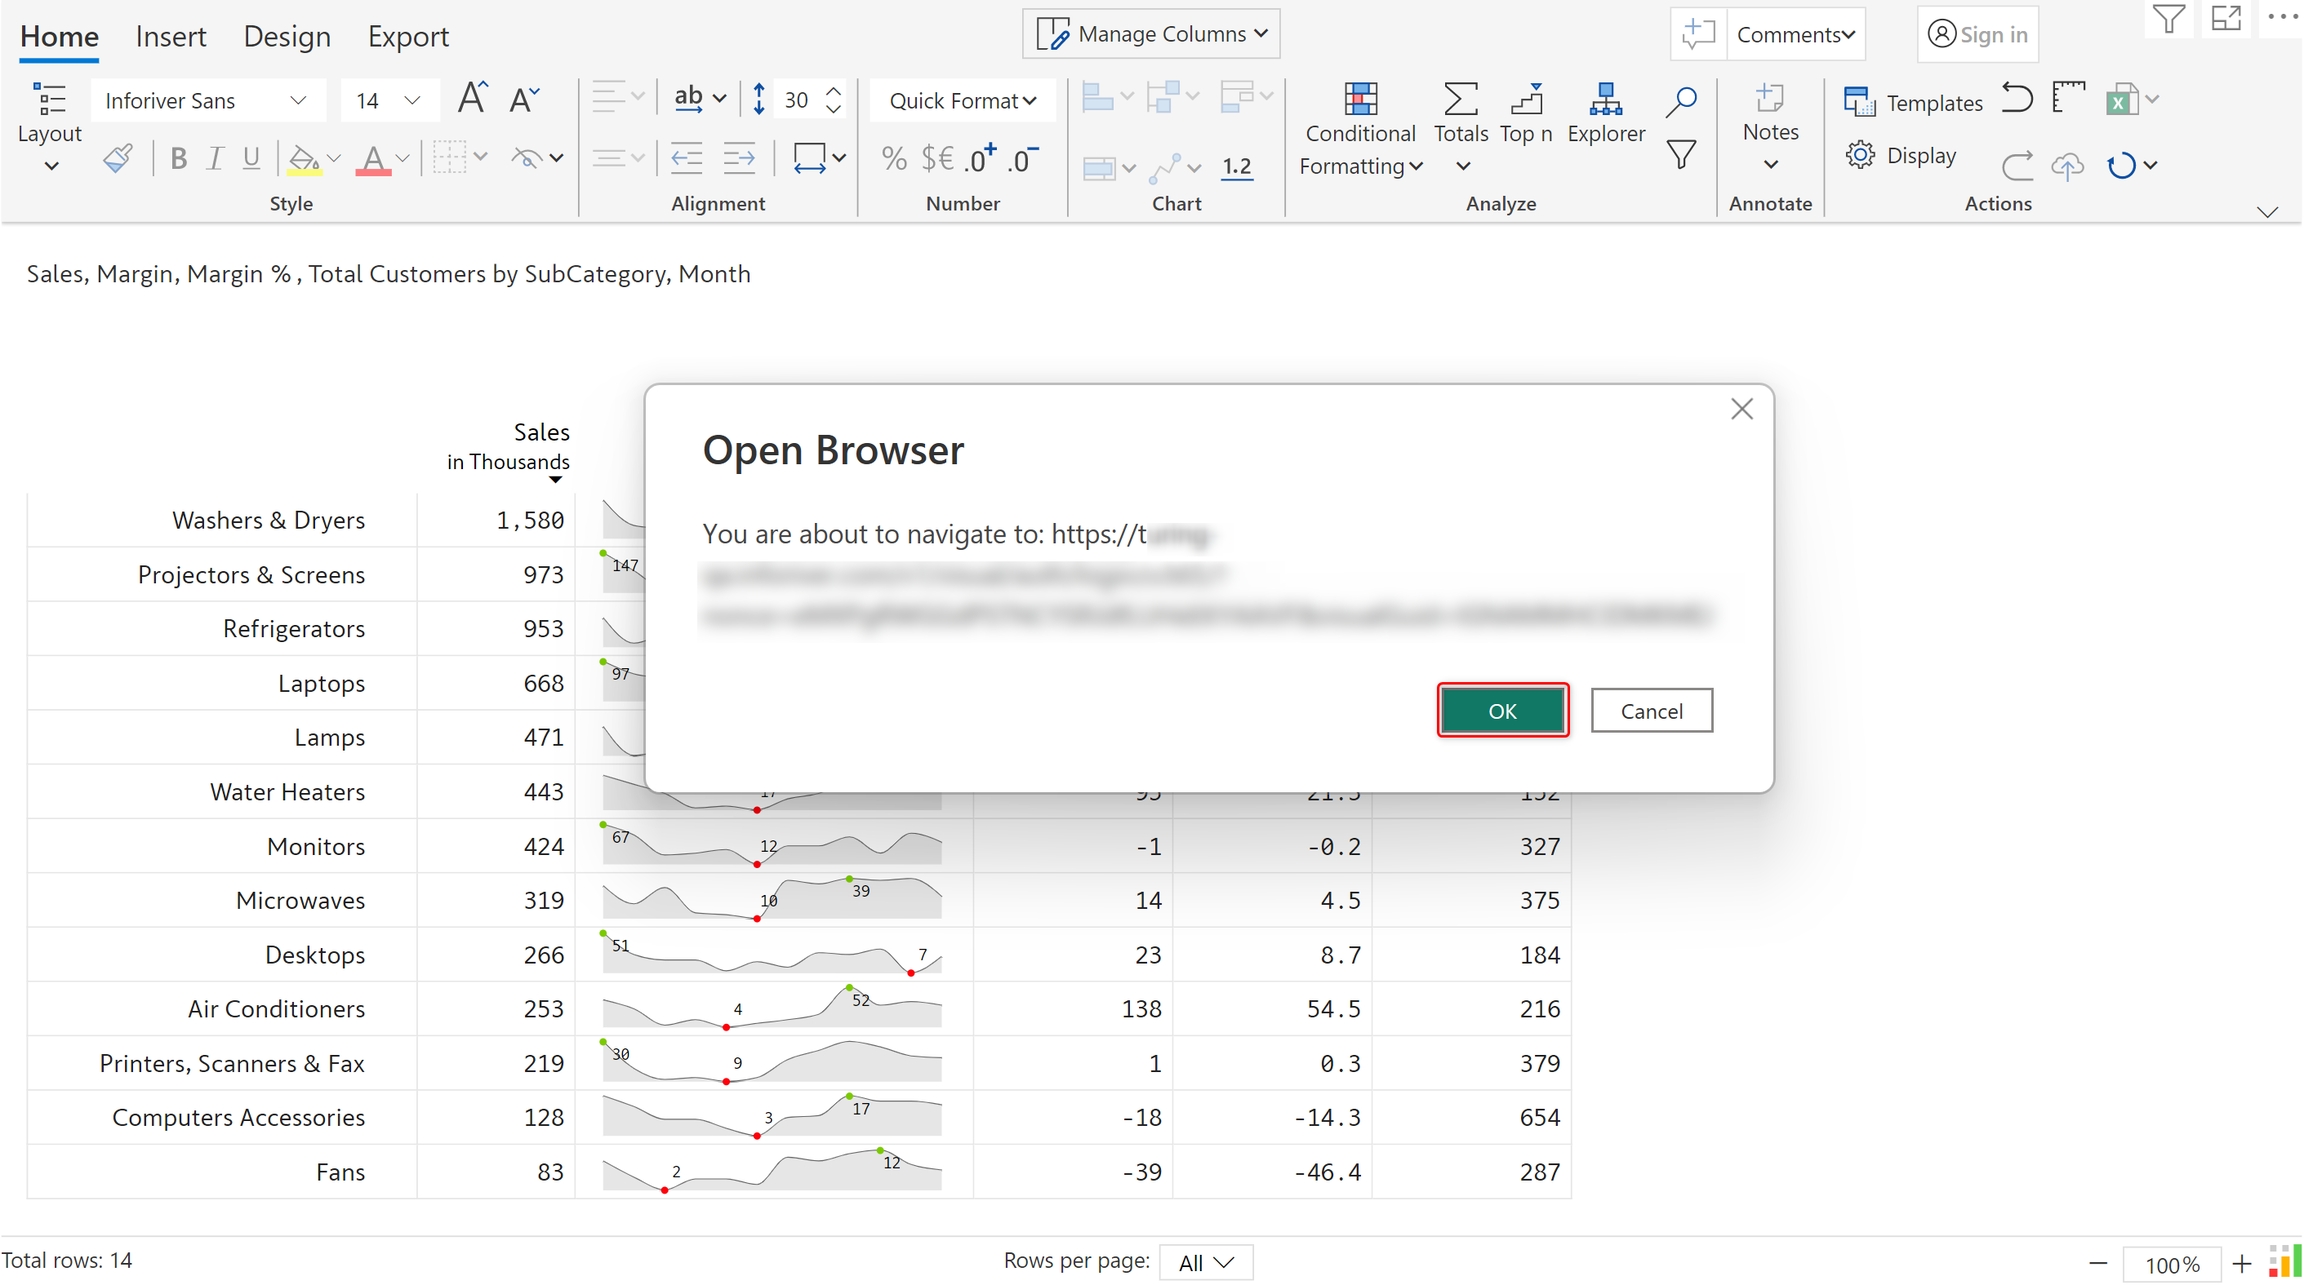
b) Inforiver needs to authenticate your O365 account, click 'Ok'.

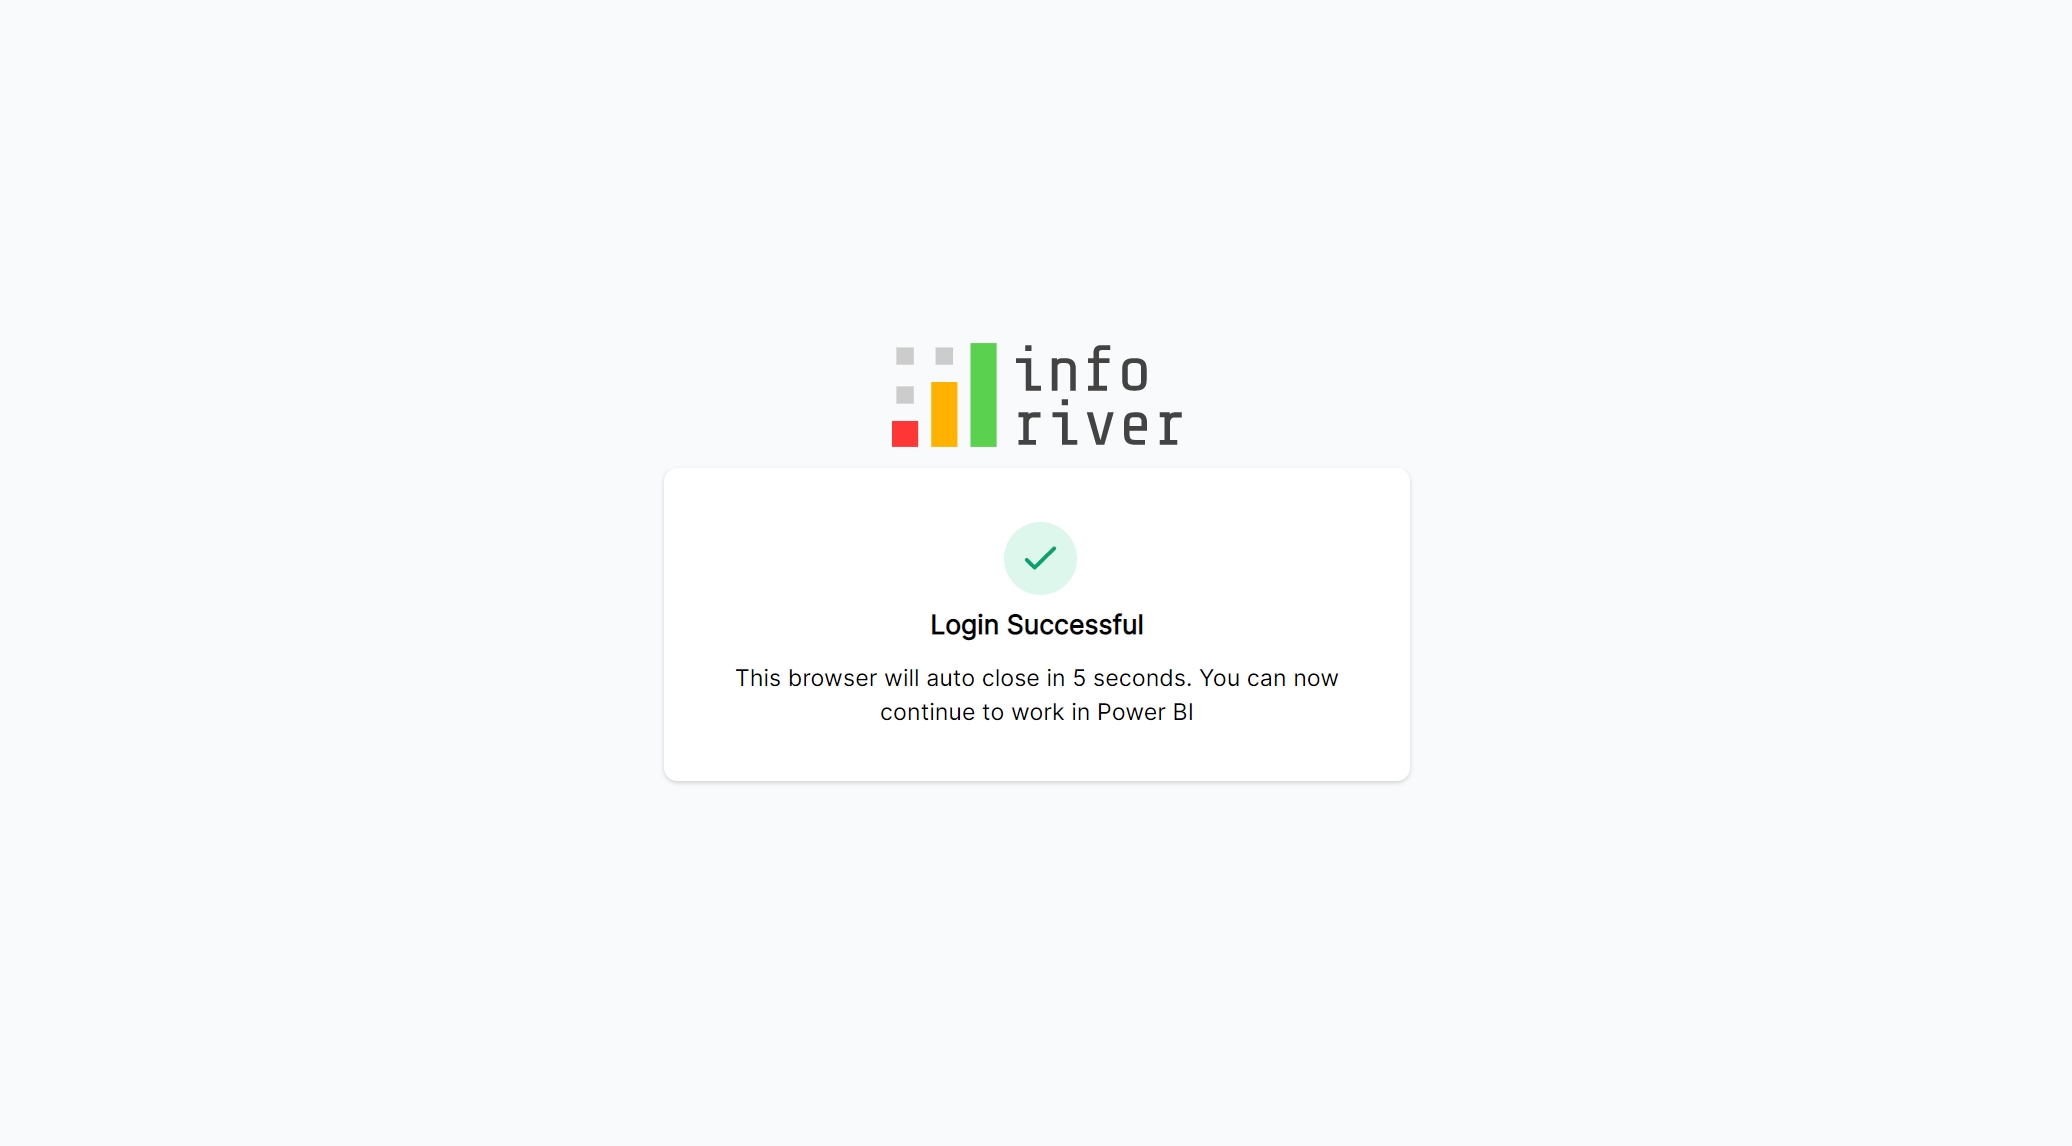
c) On successful login, the following message is shown.

d) In the Inforiver visual, you can now see your profile picture instead of the 'Sign in' button.

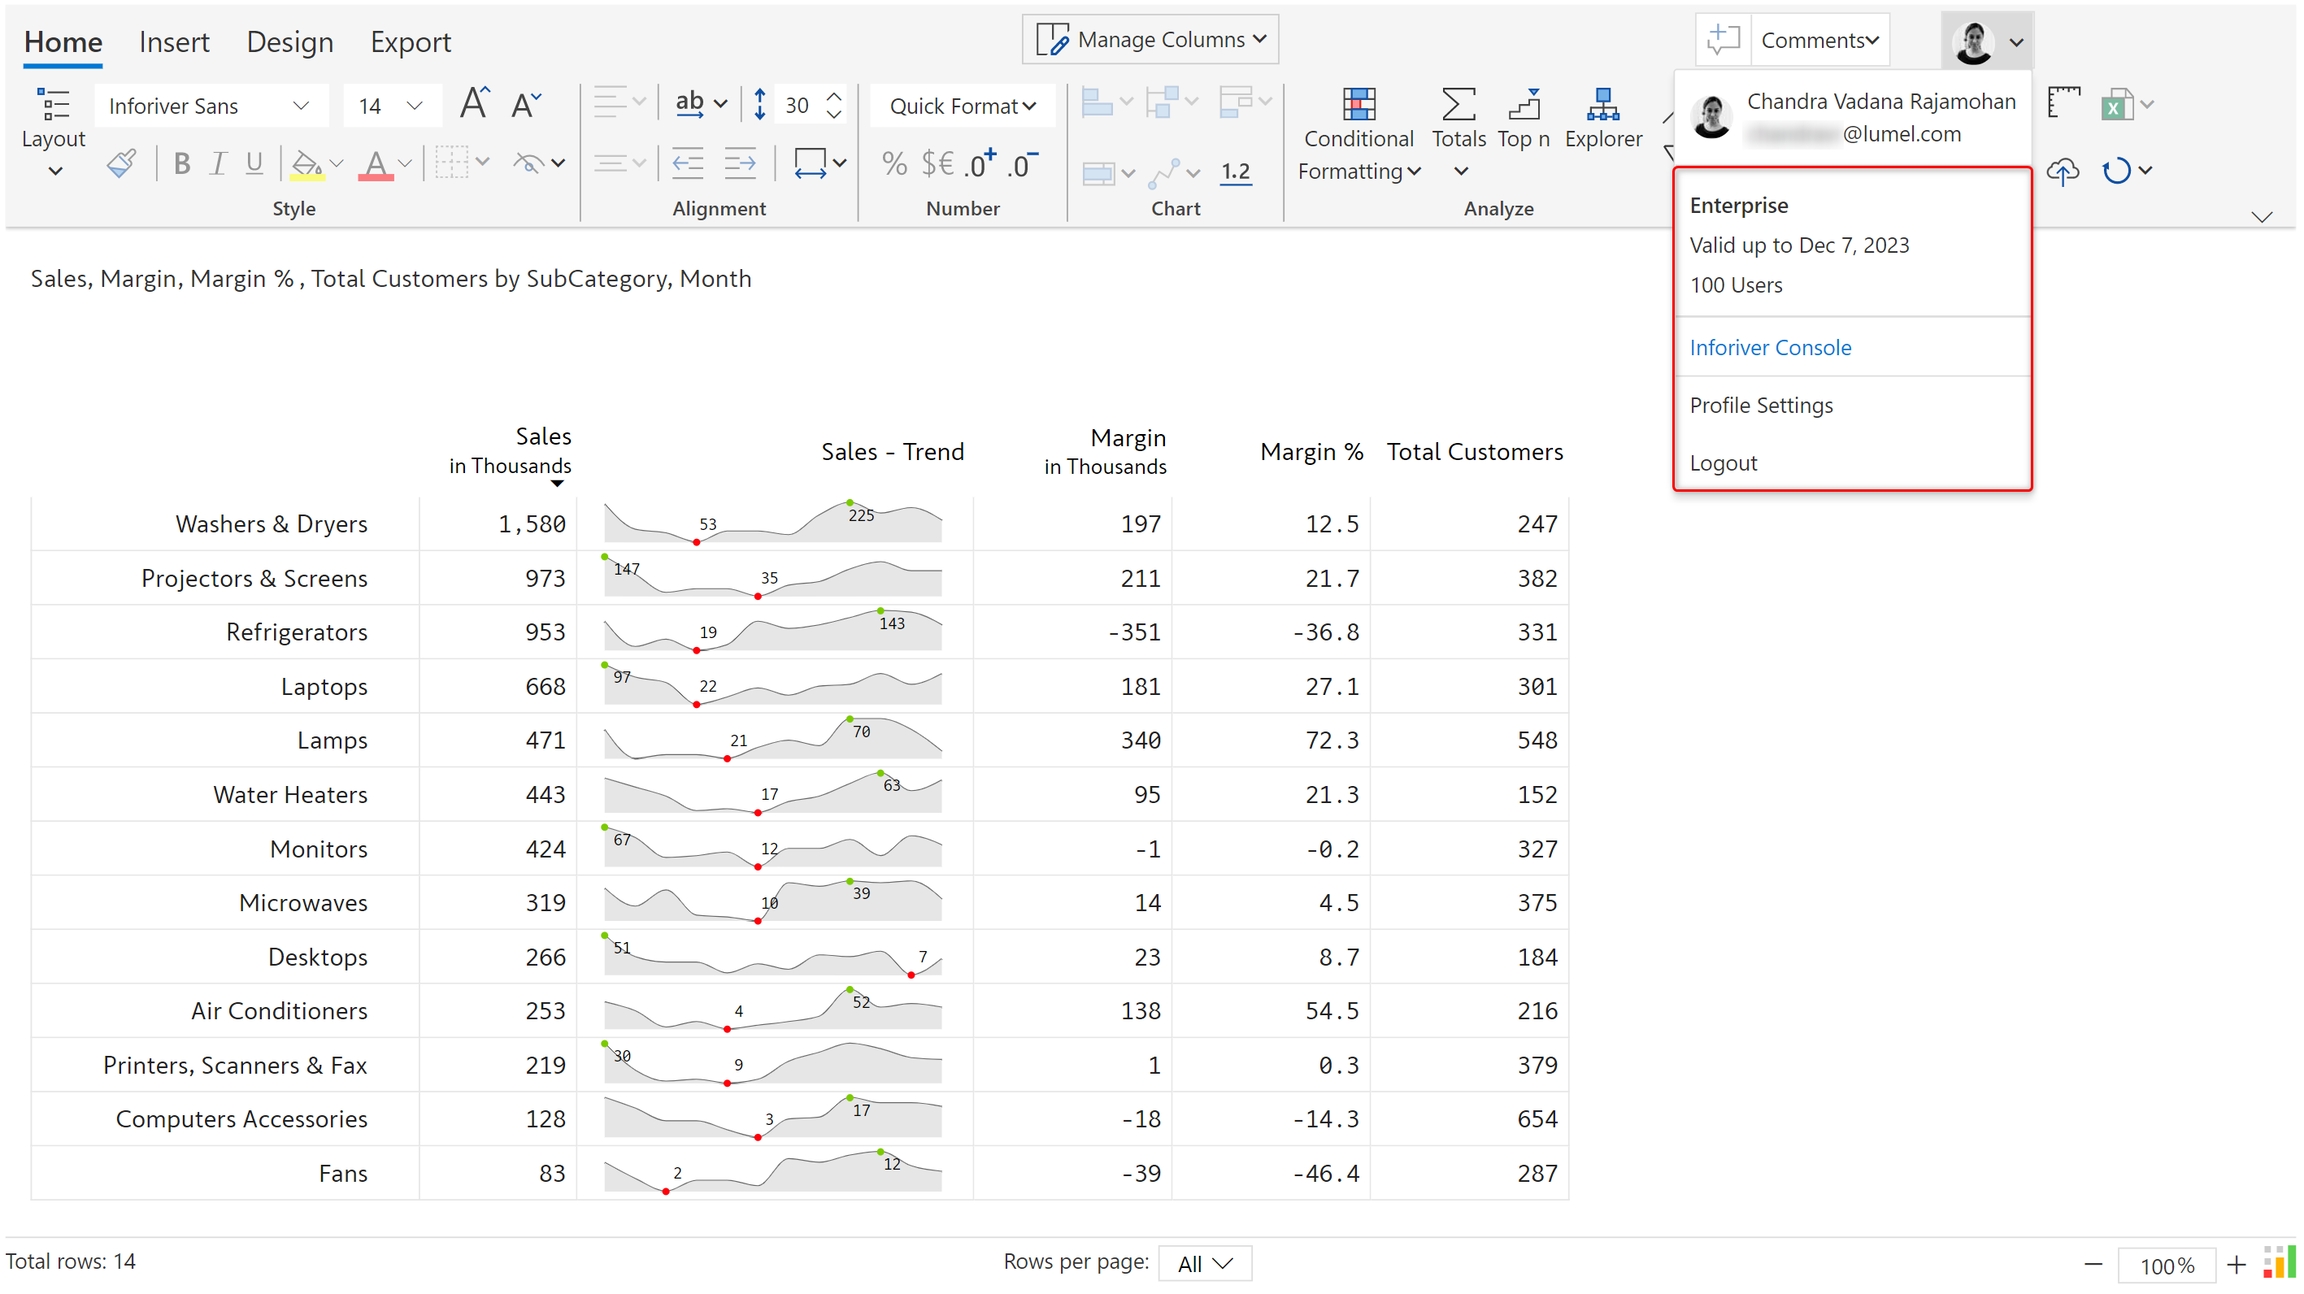
e) On clicking the dropdown, you can find more information and options. The workspace that you are part of will be shown. You can navigate to the Inforiver Console.

Let's now look at Inforiver's commenting capability.

Data-level comments
Report-level comments
Assign & track tasks
Track changes
Comment settings
notes
Sales report
Sign in with O365 account
Authentication
Successful login
Inforiver visual on successful login
Options available after login