Inforiver
Premium Table
Premium Table
  • Introduction to Premium Table
    • Get Started
      • Installing from AppSource
      • Installing Inforiver for your organization (Org visual)
      • Inforiver Customer Portal
        • Billing Admin
          • Update Profile
          • Update Subscriptions
        • License Admin
      • Licensing
        • License renewal
      • Registering Inforiver on Azure AD (Entra ID)
  • Working with Premium Table
    • 1. Build your first Inforiver Table report
    • 2. Displaying information
      • Report interface
      • Templates
      • Basic formatting
        • Number formatting
        • Cell, header & value formatting
        • Row totals
        • Insert blank rows
      • Basic inline charts
    • 3. Basic interactions
      • Explore & filter data
        • Search & Filter
        • Explorer
        • Top N + others
      • Sort & reorder data
      • Show/hide values
      • Manage column widths
      • Manage hierarchies
      • Create visual hierarchies
      • Pin rows & columns
      • Blend measures
      • Dynamic measure headers
      • Context menus
        • Column gripper
        • Row gripper
      • Actions
        • Rails
        • Toolbar options
        • Keyboard shortcuts
        • Reset
    • 4. Adding business logic and formulae
      • Insert calculated rows
        • Template rows
      • Insert calculated columns
      • Insert manual input rows
      • Insert manual input columns
        • Number
        • Dropdown
          • Dropdown options from semantic models
          • Lookup visuals for dropdowns
        • Text, checkbox & date
        • Writeback Matrix features
        • Importing data
      • Invert sign
      • Editing cells
      • Quick formula
      • Visual column inside visual measures
      • Manage inserted rows
      • Manage inserted measures & columns
      • Pivot data
      • Insert image URLs
    • 6. Working with charts
      • Sparkline charts
      • Stacked charts
      • Bullet charts and clustered bar charts
      • Waterfall charts
      • Bar and pin charts
      • Change/deviation charts
    • 5. Conditional formatting
      • One-click options
      • Create rule
        • Rules (If conditions)
        • Color scale & data bars
        • Classification
        • Ranking
      • Manage rules
    • 7. Planning, budgeting & forecasting
      • What-if analysis & simulations
      • Goal Seek
      • Budgeting & allocations
      • Set version
    • 8. Paginated reporting
      • Pagination
      • Header & footer
        • Text
        • Images
        • Charts
        • KPI cards
      • Report layouts (Report+)
      • Display and themes
    • 10. Exporting reports
      • Export to PDF & Excel
        • Excel export - operational boundaries
      • Ad hoc emails
    • 11. Scheduling reports
      • Create new subscription
        • Select a report
        • Set subscription frequency
        • Select destination(s)
          • Email
          • OneDrive
          • Microsoft Teams
          • SharePoint
        • Review & save subscription
      • Manage your subscriptions
      • Administration
    • 12. Data writeback
      • Settings
        • General Settings
        • Data Settings
        • Destination Settings
        • Writeback security settings
        • Writeback time-out & batch size settings
        • Advanced Settings
      • Destinations
        • Azure SQL (Managed DB)
        • Azure SQL
        • Microsoft SQL Server
        • Synapse Dedicated SQL Pool
        • Azure Data Lake Storage
        • Databricks
        • Snowflake
          • Setting up Snowflake OAuth
        • Amazon Redshift
        • BigQuery
        • SingleStore
        • SAP HANA
        • Oracle
        • PostgreSQL
        • MySQL
        • OneDrive
        • SharePoint
        • Dataverse
        • Fabric Warehouse
        • Fabric lakehouse
        • Fabric SQL
        • URL as destination
      • Logs
      • Reading mode
    • 14. Manage aggregation
      • Row aggregation
      • Column aggregation
    • 18. Variables
      • Variable types
        • Number
        • Select
        • Text
        • Date
        • Date range
        • Boolean
        • Button
      • Variable bookmarks
  • Admin Console
    • Manage Profile
    • User management
      • User Roles and Permissions
      • Create custom roles and policies
    • Settings
      • General
      • Generate builds - on prem
      • Forecast
      • Holidays
      • API token
      • Writeback
      • Managed DB
      • Assets
    • Onboarding actions
    • Writeback
  • Display settings
    • General settings
    • Hierarchy settings
    • Number settings
    • Miscellaneous settings
    • On-load scripting
  • Formula syntax
    • Conditional statements
      • IF
      • IFNA
      • SWITCH
      • FILTERIF
    • Logical functions
      • AND
      • IN
      • ISBLANK
      • ISEMPTY
      • ISNUMBER
      • NOT
      • OR
      • XOR
    • Math functions
      • ABS
      • AVERAGE
      • AVERAGEEXNEG
      • AVERAGEEXZERO
      • AVERAGEEXZERONEG
      • AVERAGEIF
      • CEILING
      • COUNT
      • COUNTIF
      • DIVIDE
      • EVEN
      • EXP
      • FLOOR
      • INDEXOF
      • LOG
      • ODD
      • MAX
      • MIN
      • NORMDIST
      • NORMSDIST
      • NORMINV
      • NORMSINV
      • PCT
      • POWER
      • RAND
      • RANDBETWEEN
      • ROUND
      • ROUNDDOWN
      • ROUNDUP
      • MROUND
      • SORT
      • SQRT
      • SUM
      • PMT
    • Text formatting functions
      • CONCATENATE
      • HYPERLINK
      • LEFT
      • LOWER
      • MID
      • PROPER
      • REPLACE
      • REPT
      • RIGHT
      • TEXT
      • TRIM
      • UPPER
      • VALUE
    • Date functions
      • DATEADD
      • DATEDIFF
      • DAY
      • DATE
      • DATE.SET
      • DATE.FORMAT
      • SOWEEK
      • SOMONTH
      • SOQTR
      • SOYEAR
      • EOWEEK
      • EOMONTH
      • EOQTR
      • EOYEAR
      • NETWORKDAYS
      • ADDDAYS
      • ADDWEEKS
      • ADDMONTHS
      • ADDQTRS
      • ADDYEARS
      • FROMEXCELDATE
      • MONTH
      • NOW
      • PERIOD_RANGE
      • TODAY
      • TOEXCELDATE
      • YEAR
    • Time intelligence functions
      • AGGREGATE
      • FILTER
      • COLUMN_PERIOD
      • LASTNDAY
      • LASTNMONTH
      • LASTNQTR
      • LASTNYEAR
      • MONTHPERIOD
      • MOVINGAVERAGE
      • MOVINGSUM
      • MTD
      • NEXTNDAY
      • NEXTNMONTH
      • NEXTNQTR
      • NEXTNYEAR
      • QTD
      • QTRPERIOD
      • SHIFT
      • TOTALYTD
      • TOTALQTD
      • TOTALMTD
      • VALUEAT
      • YEARPERIOD
      • YTD
    • Other operators
    • Identifiers
      • CLOSEDPERIOD
      • COLUMN.DATE
      • COLUMN.PARENT
      • COLUMNS
      • CURRENT_PERIOD
      • DESCENDANTS
      • FORECAST.CLOSED_END
      • FORECAST.CLOSED_START
      • FORECAST.OPEN_END
      • FORECAST.OPEN_START
      • GROUP INDEX
      • HAS
      • HAS_ALL
      • HAS_SOME
      • LEAVES
      • LEVEL
      • LOGGEDIN_EMAIL
      • LOGGEDIN_NAME
      • MATCH
      • MAXDATE
      • MEMBERS
      • MINDATE
      • RELATIVE
      • RELATIVE_COLUMN
      • ROW.PARENT
      • ROW.LABEL
    • Scripting functions
      • DISPLAYTOAST
      • EXPORT
      • LAYOUT
      • SETCFRULE
      • SETFILTER
      • SETFILTERBYINDEX
      • SETVISIBILITY
      • SHOWBETWEENPERIOD
      • SHOWCLOSEDFORECAST
      • TOPN
      • DISPLAY SETTINGS
        • SETBLANKLABEL
        • SETSUPPRESSZEROS
        • SETRAGGEDHIERARCHY
        • SEPARATOR
        • SETCOMBINECOLUMNHEADER
        • SEMANTICFORMAT
        • SHOWNULLAS
        • SHOWZEROAS
        • SINGLECHILD
    • Statistical Functions
      • RANK
      • RANKEQ
      • RANKAVG
    • Miscellaneous functions
      • FETCH
      • LOOKUP
    • Measure/Column selection functions
      • GETCOLBETWEENPERIODS
      • GETMEASURE
  • Advanced topics
    • Audit log
    • Backup & restore report config
    • Enterprise themes
    • PowerPoint integration
    • Drill down and roll up in performance mode
  • Accessibility shortcut keys
Powered by GitBook
On this page
  1. Working with Premium Table
  2. 9. Commenting and collaboration
  3. Comments

Track changes

Tracking changes in the report using an interactive, filterable, and comment-enabled audit log that captures date, time, user details, task status and more is essential for ​data governance. This gives information such as who commented on a specific data point, and when.

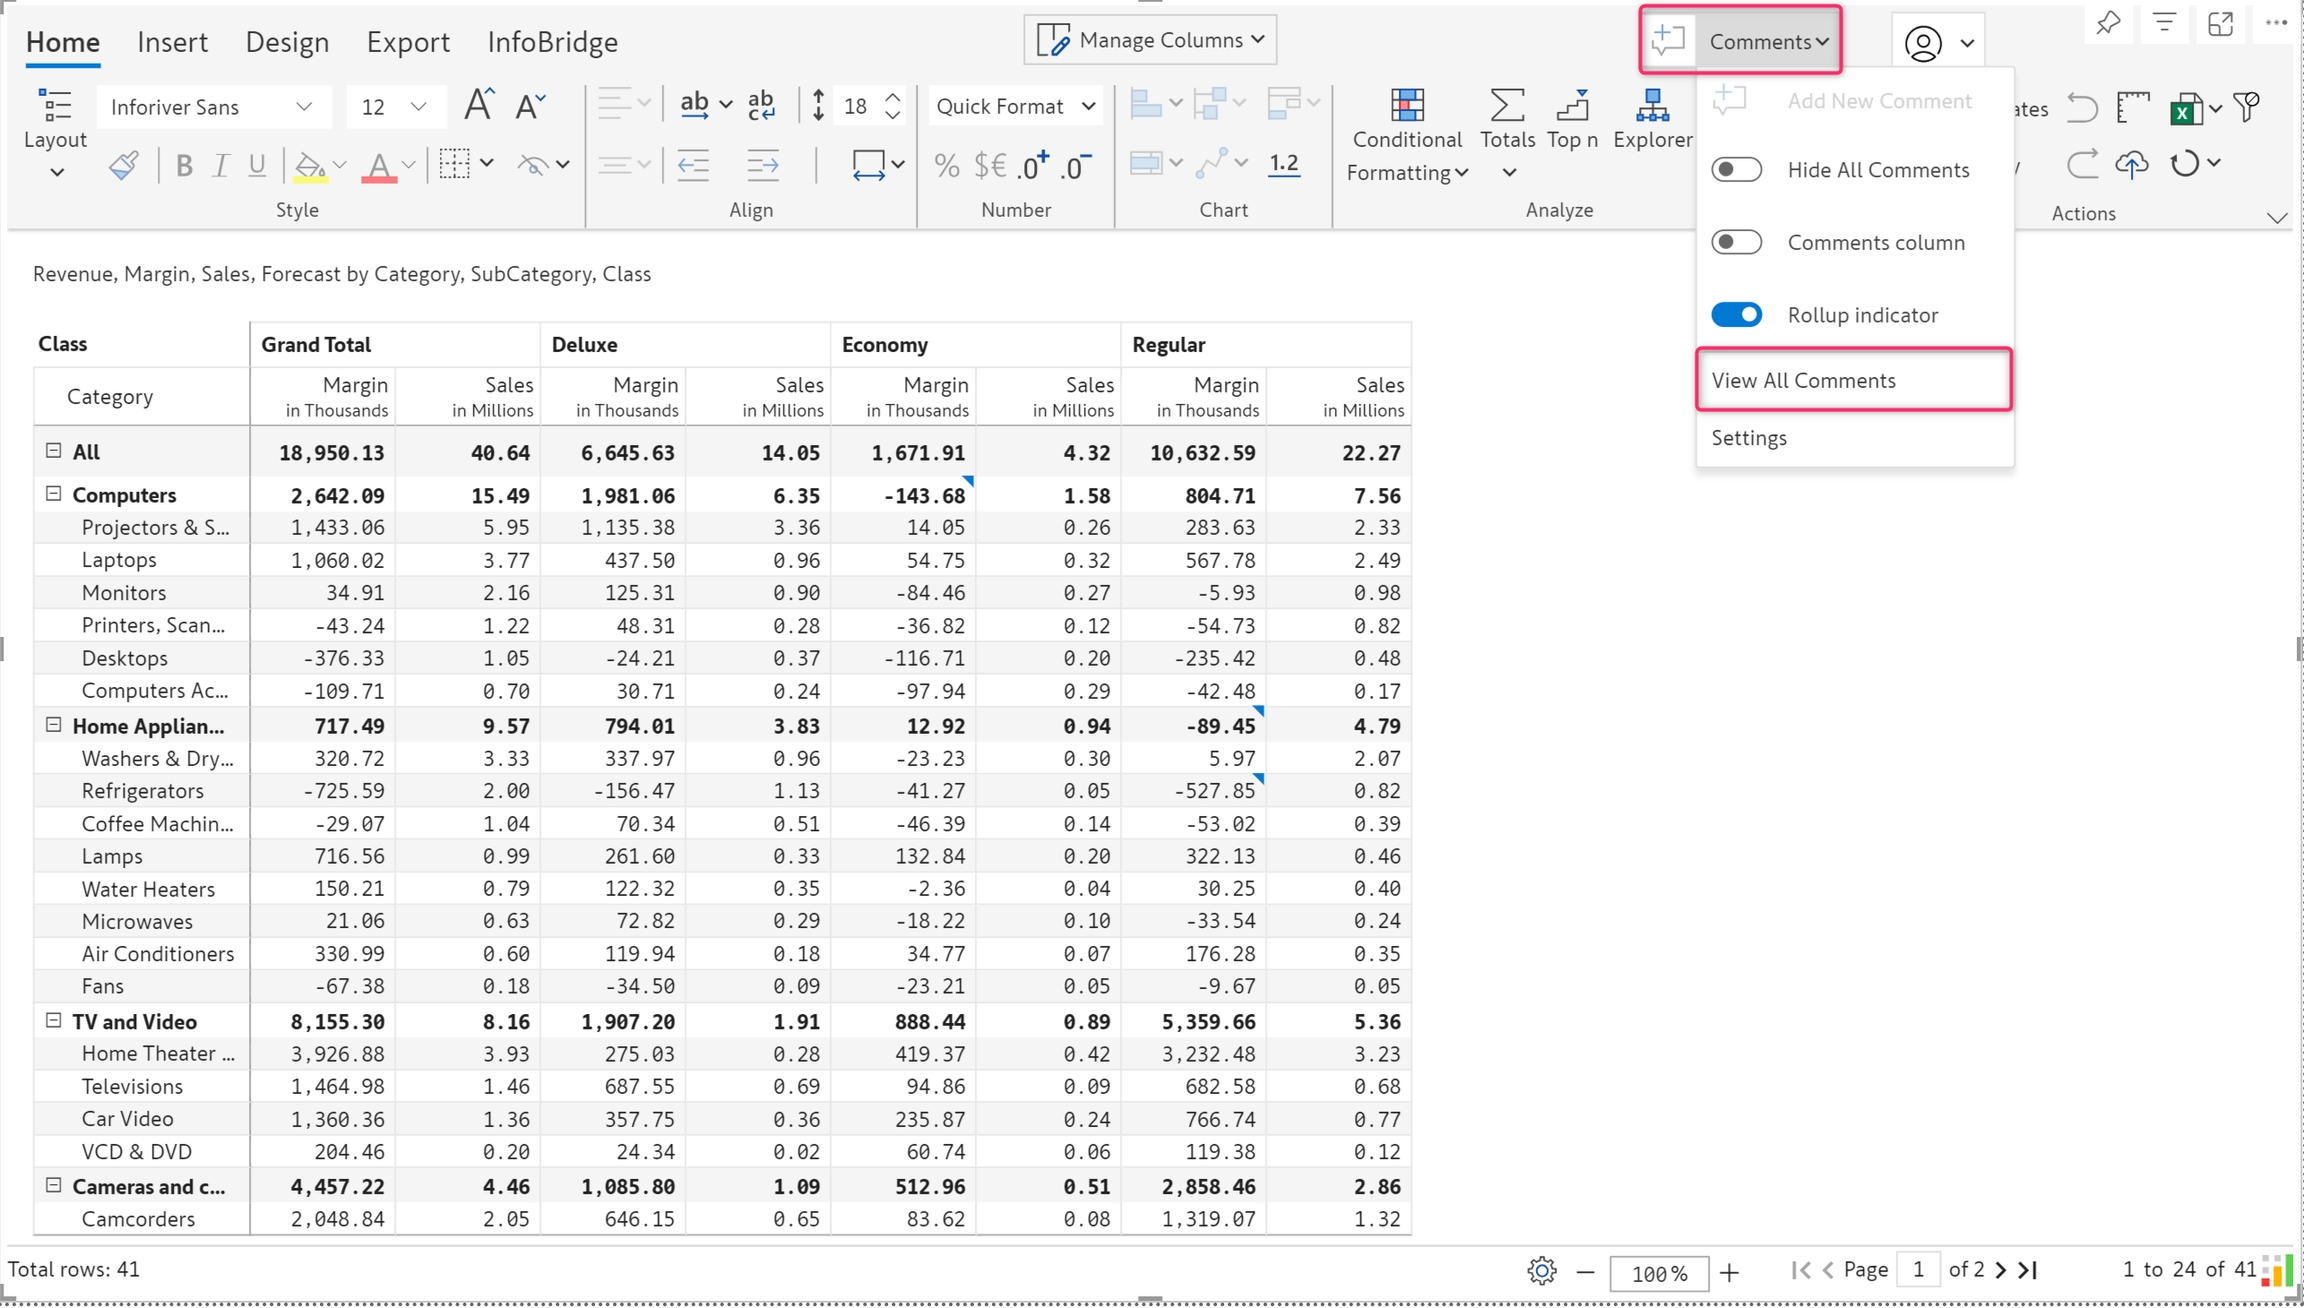
a) Click 'View All Comments' from the 'Comments' drop-down.

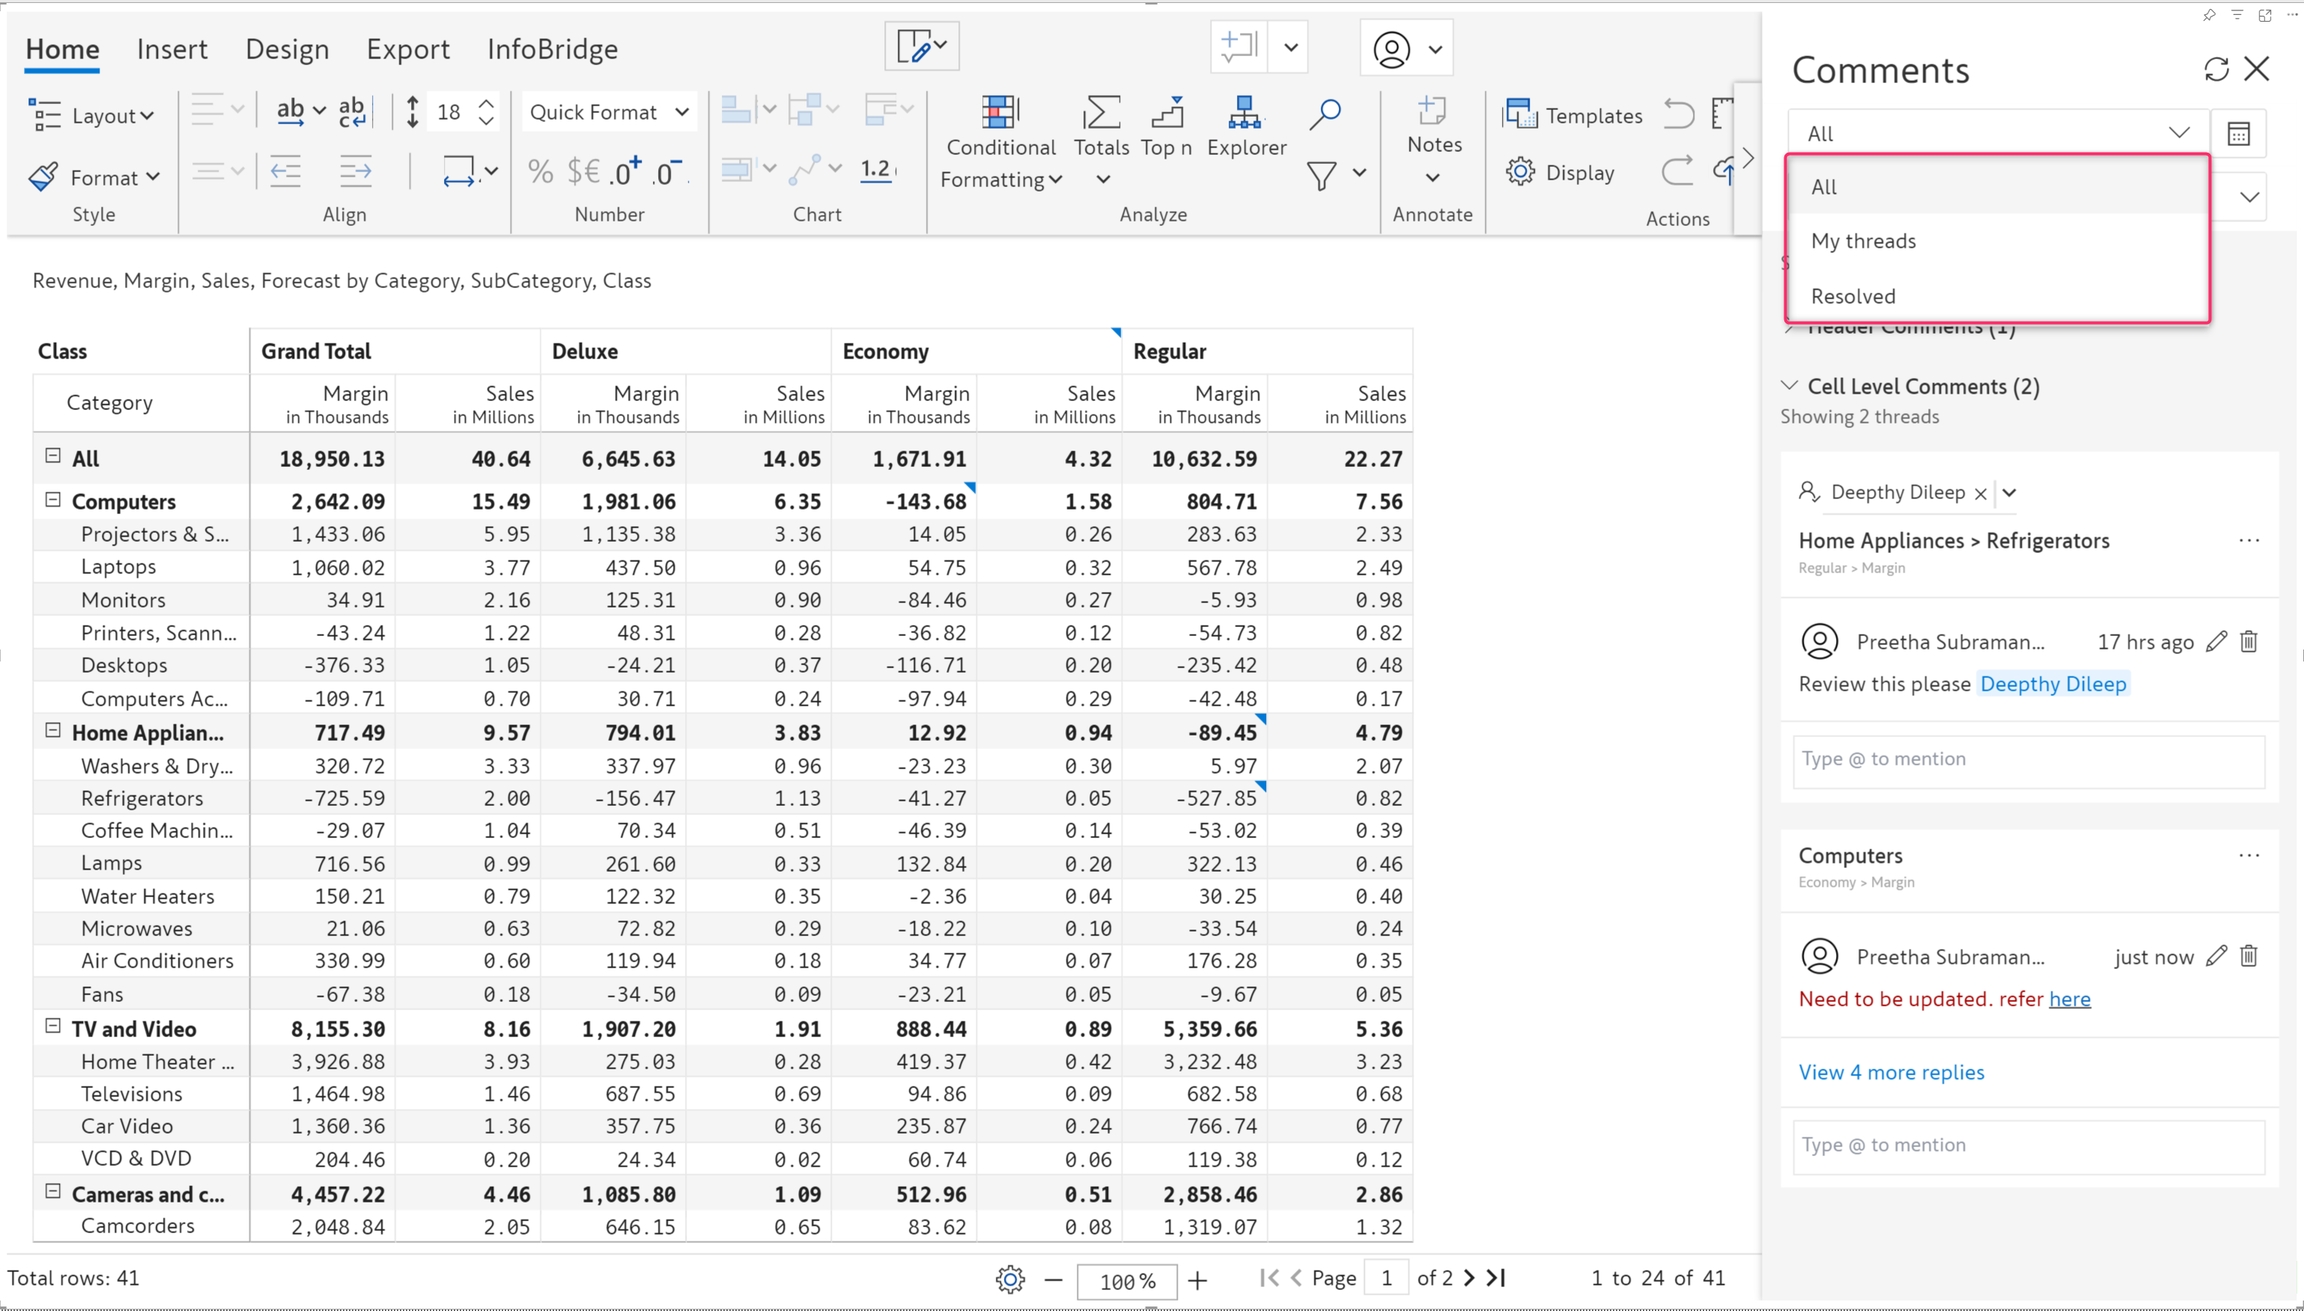
b) A side panel opens, showing all the comments along with some filters.

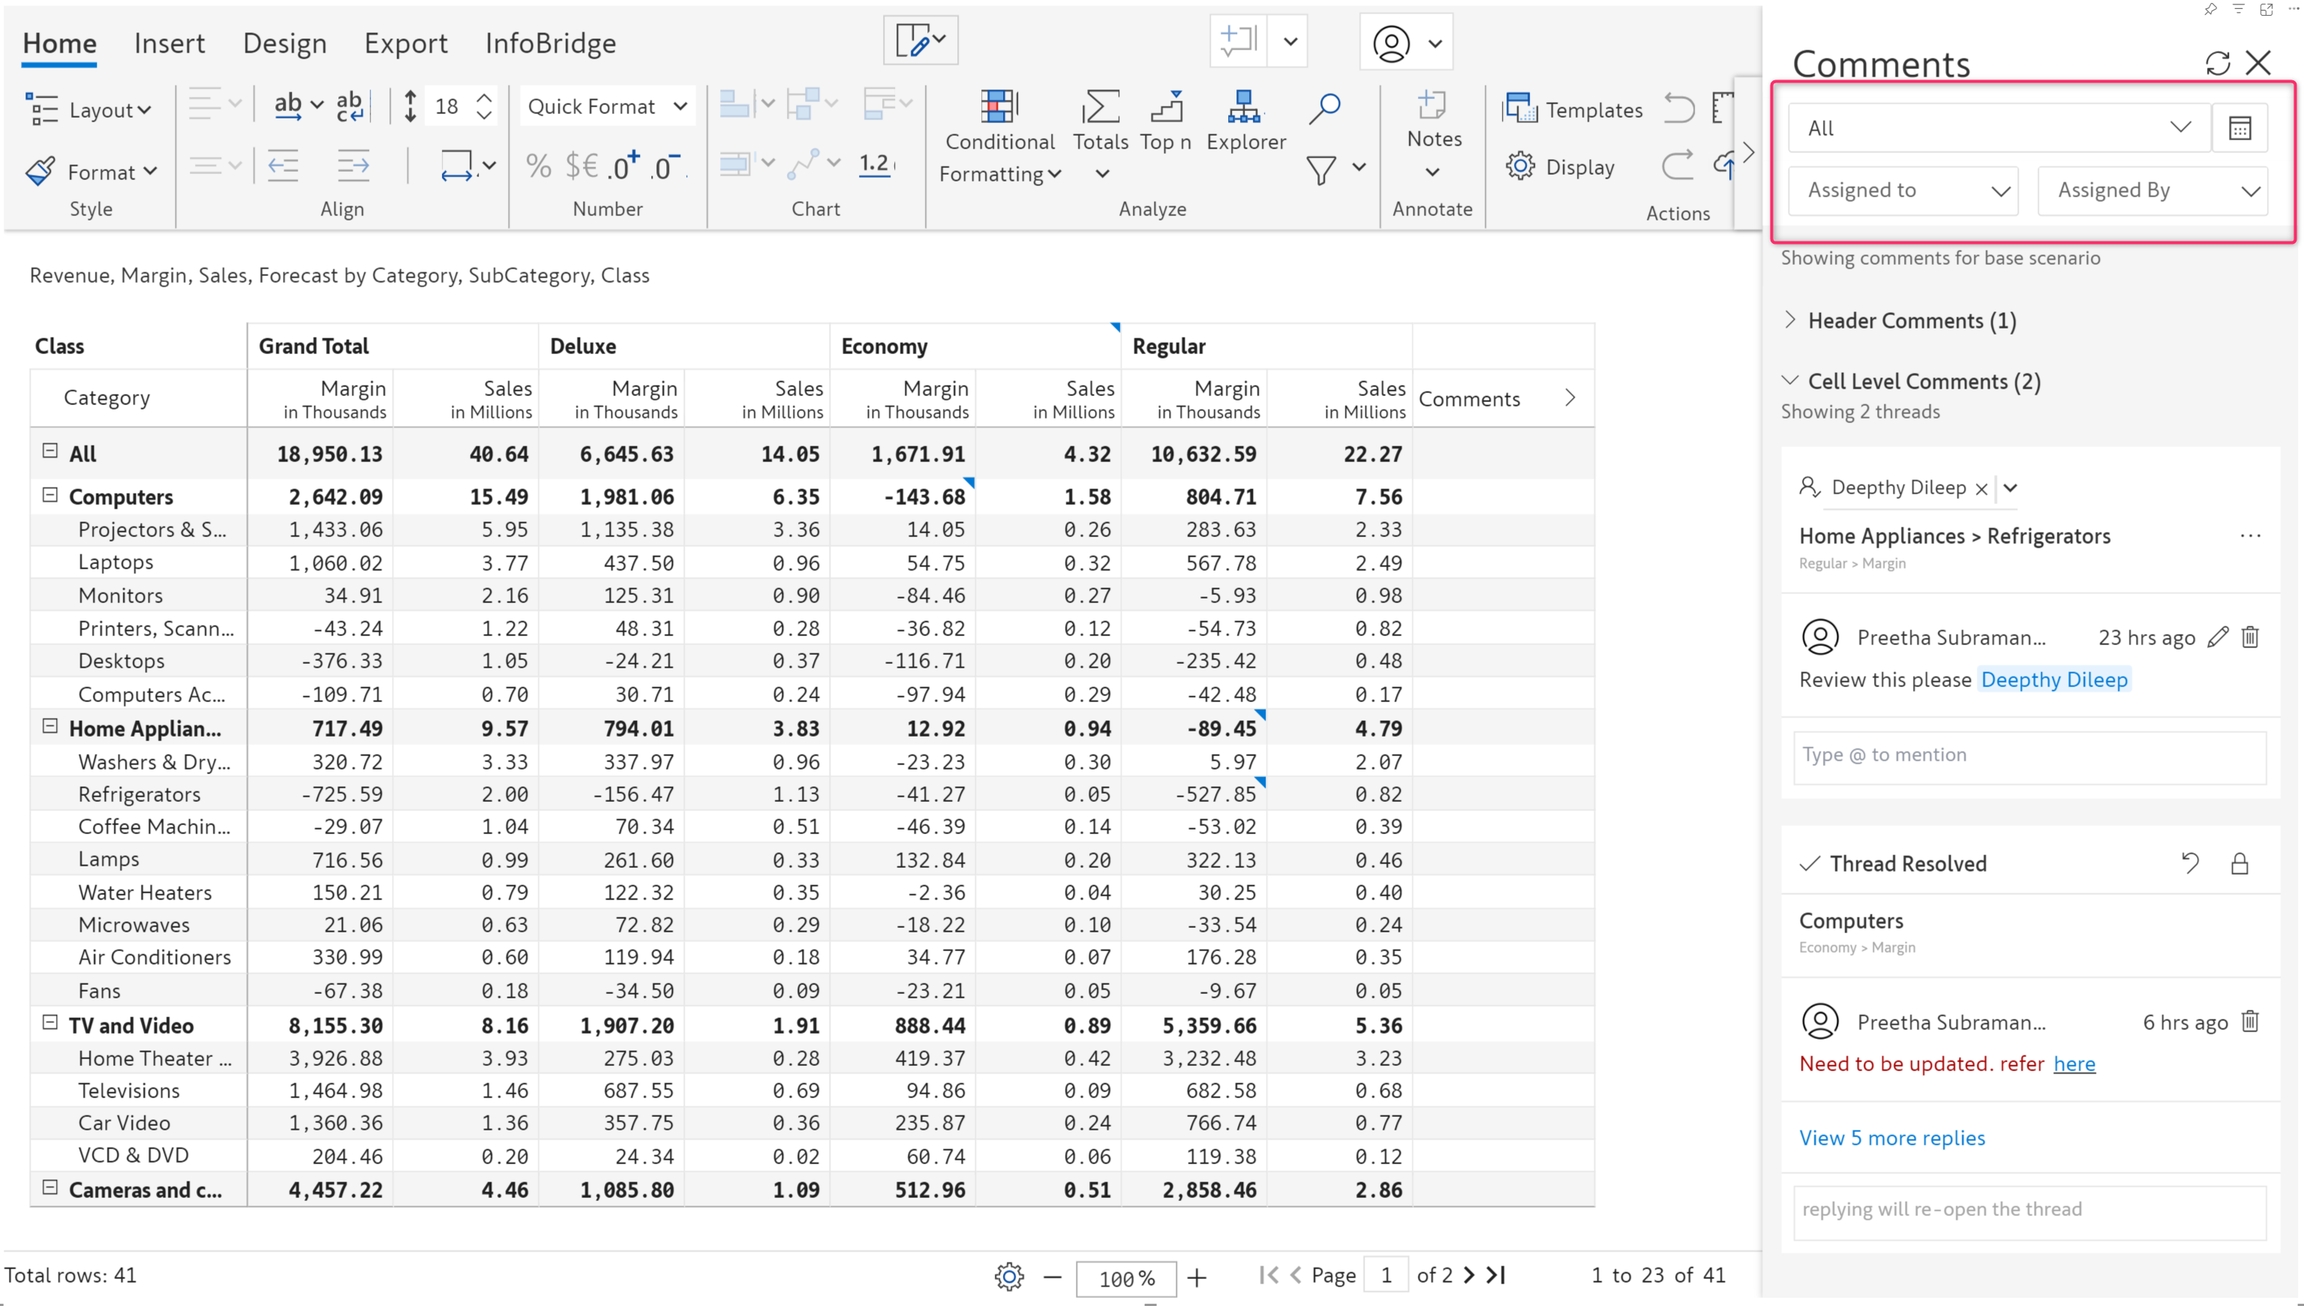
c) Comments and tasks can be filtered by assignee, assignor, status, and time period. They can also be filtered to show only your threads or all threads.

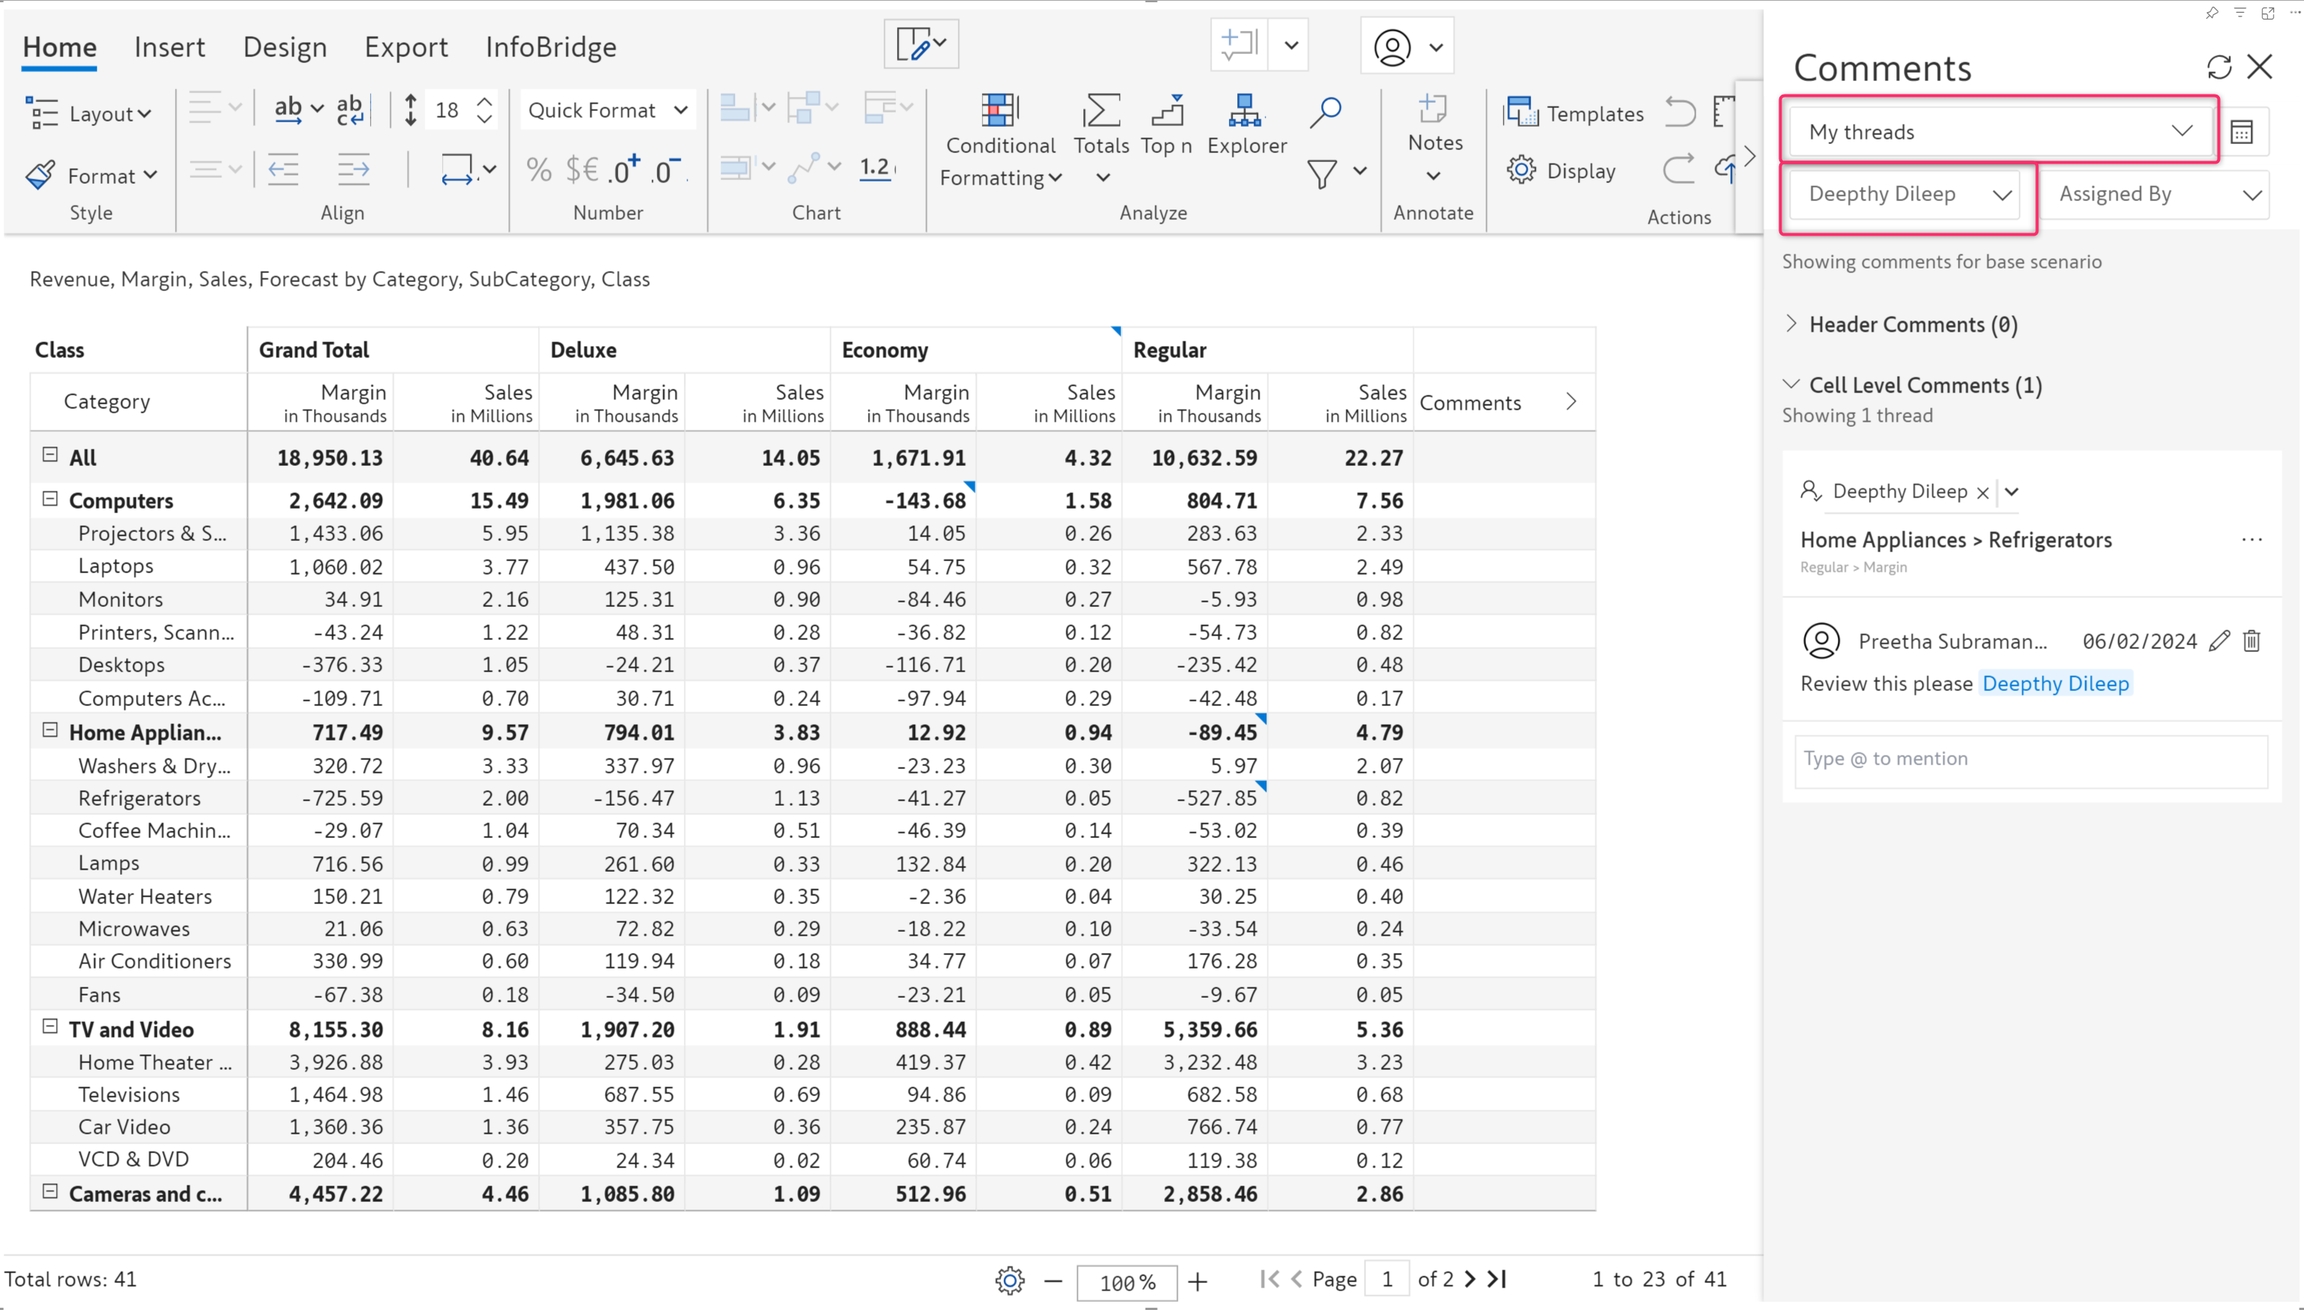
d) In the below image, I have filtered my threads and tasks assigned to a specific user.

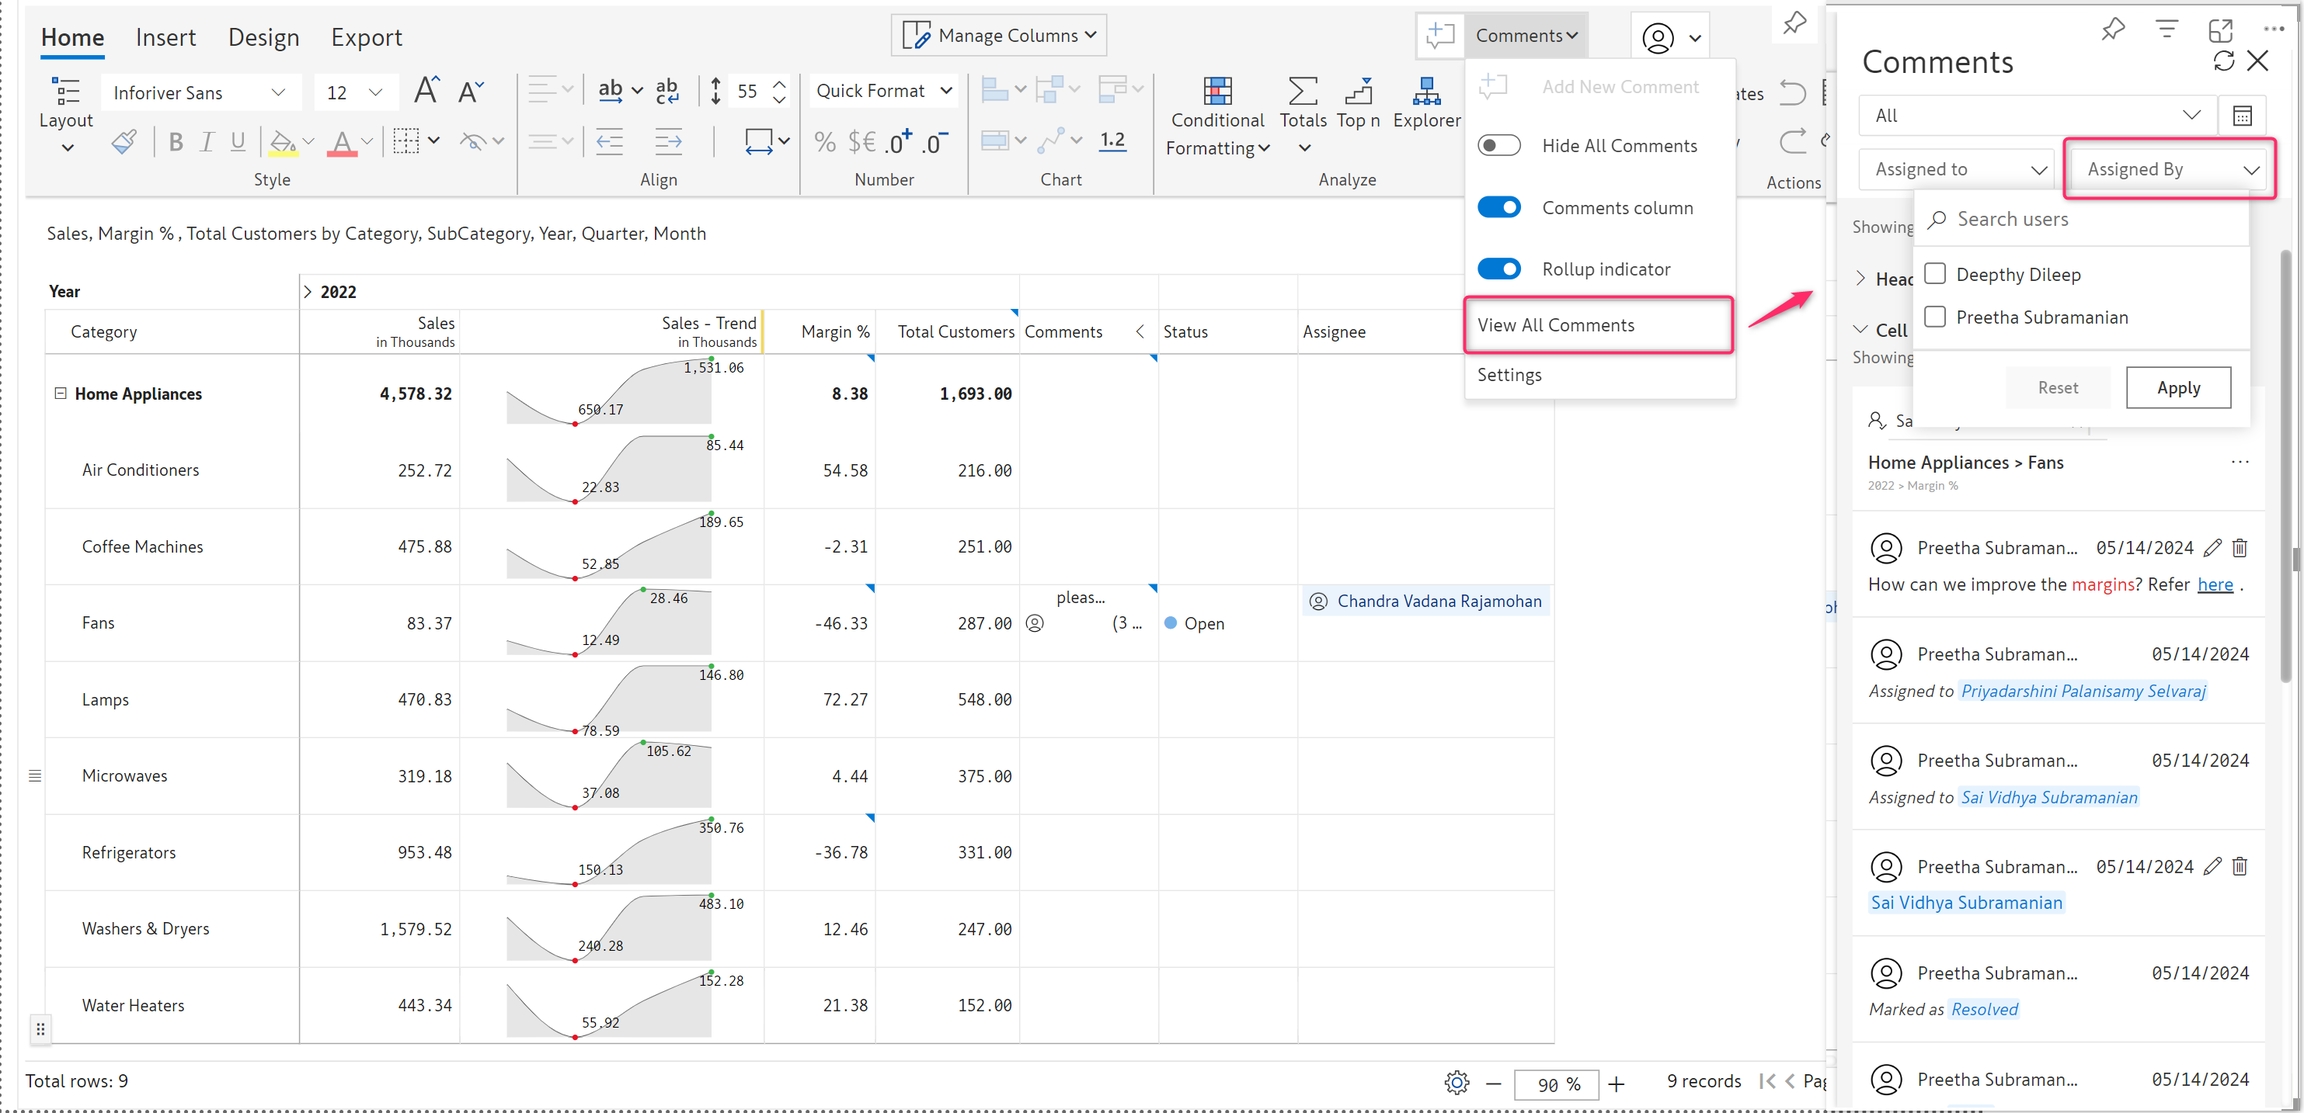
e) You can also filter tasks based on who assigned them.

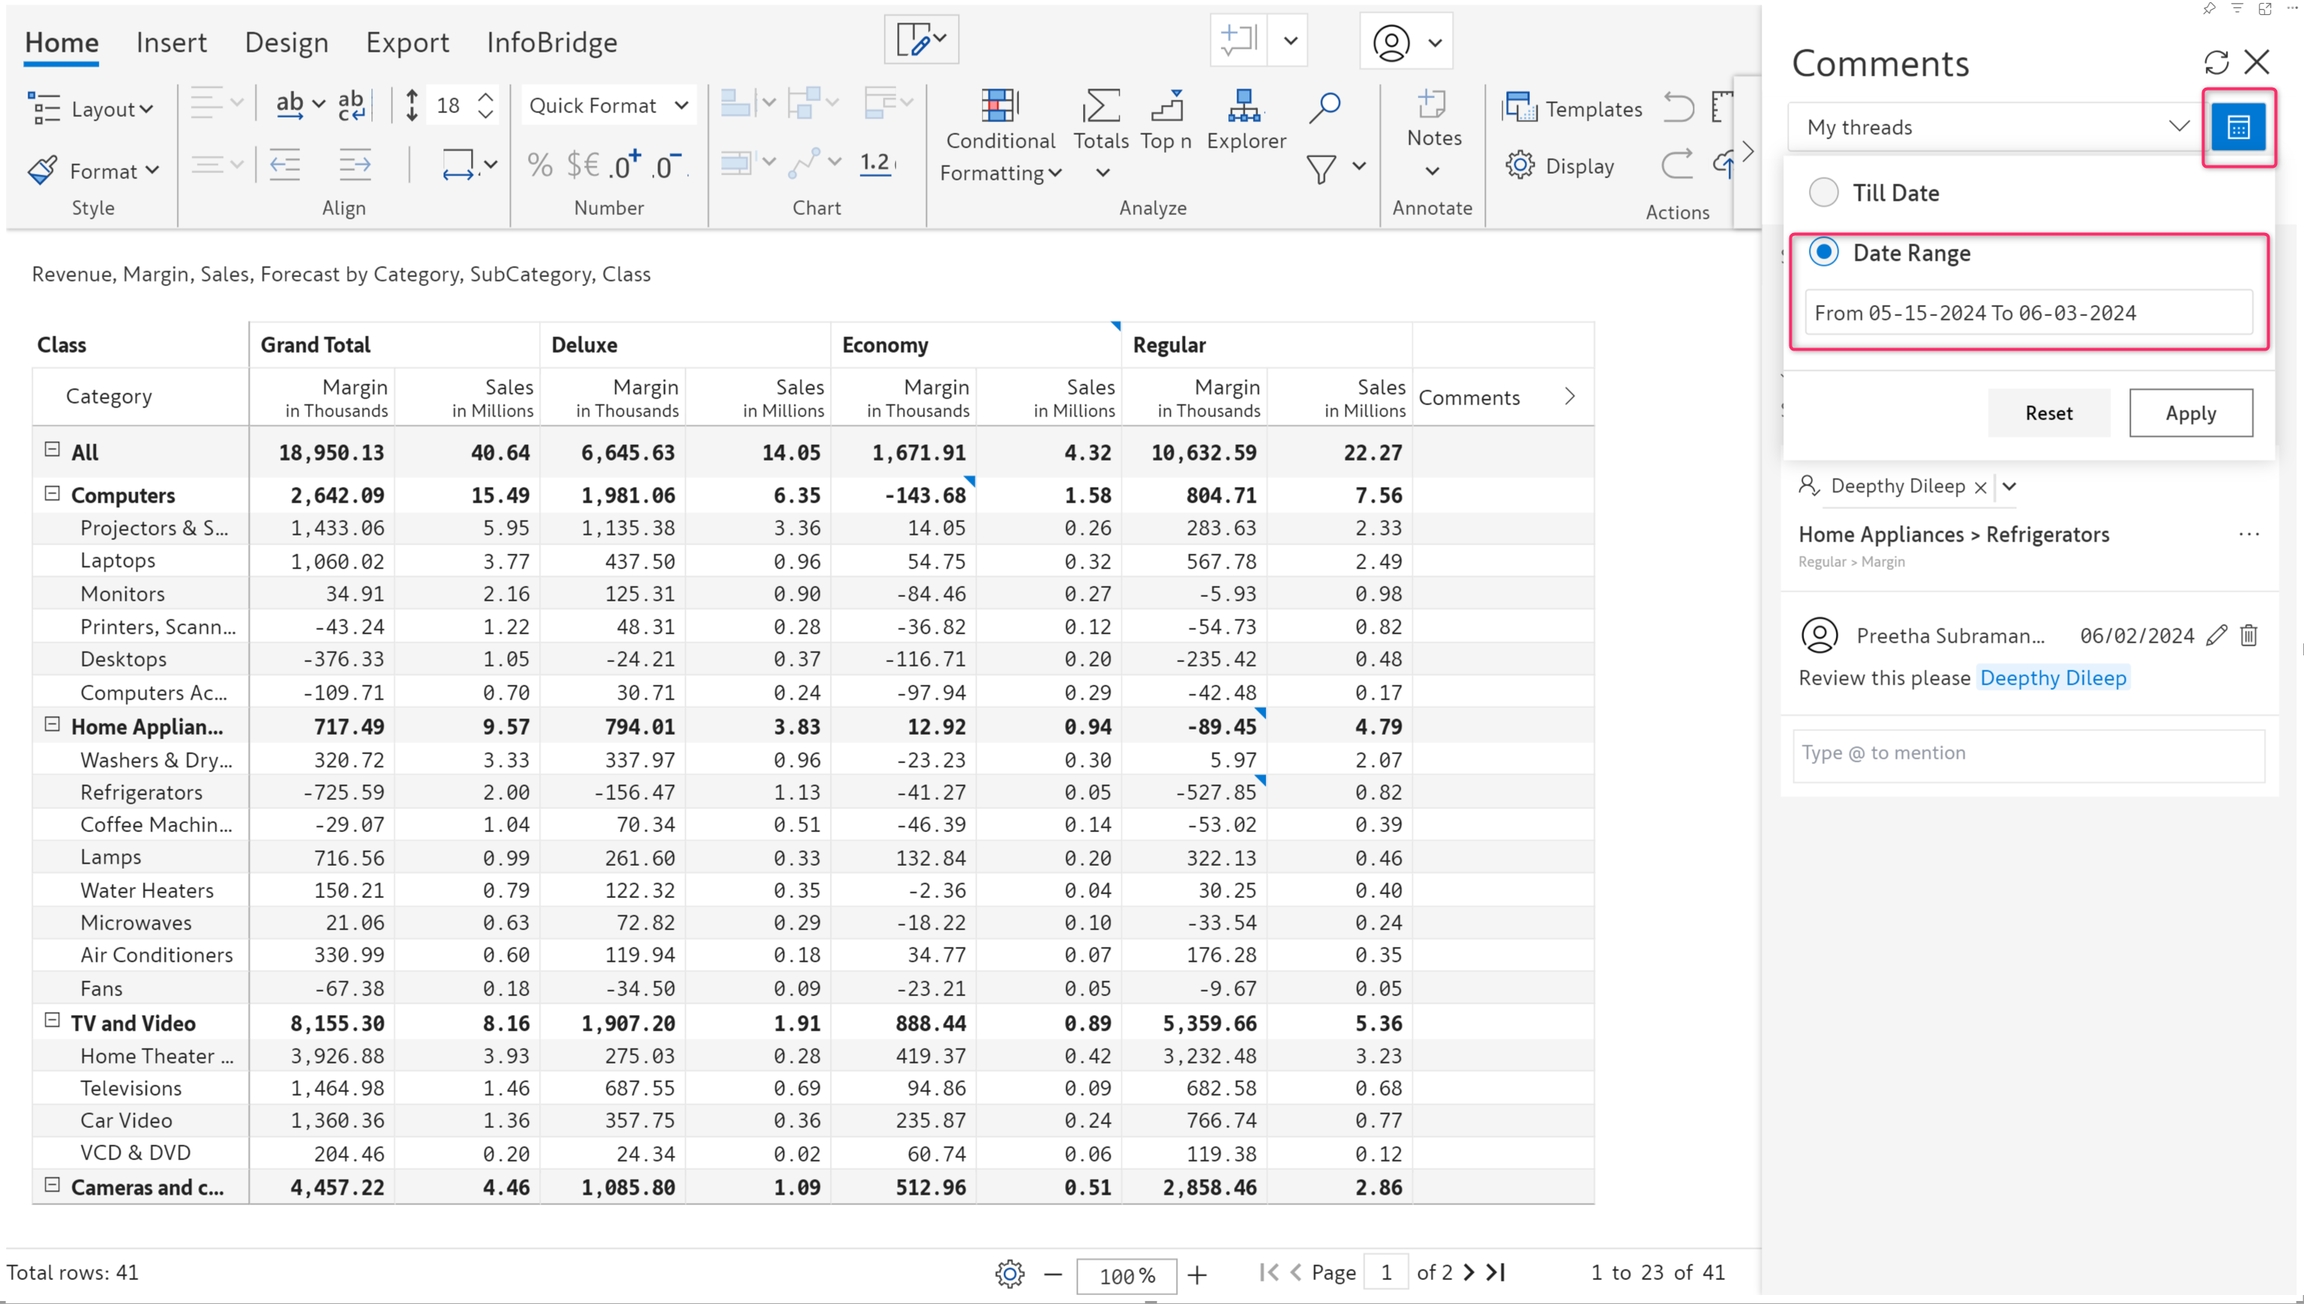
f) Comments and tasks can be filtered using a date range by clicking on the 'Calendar' icon highlighted.

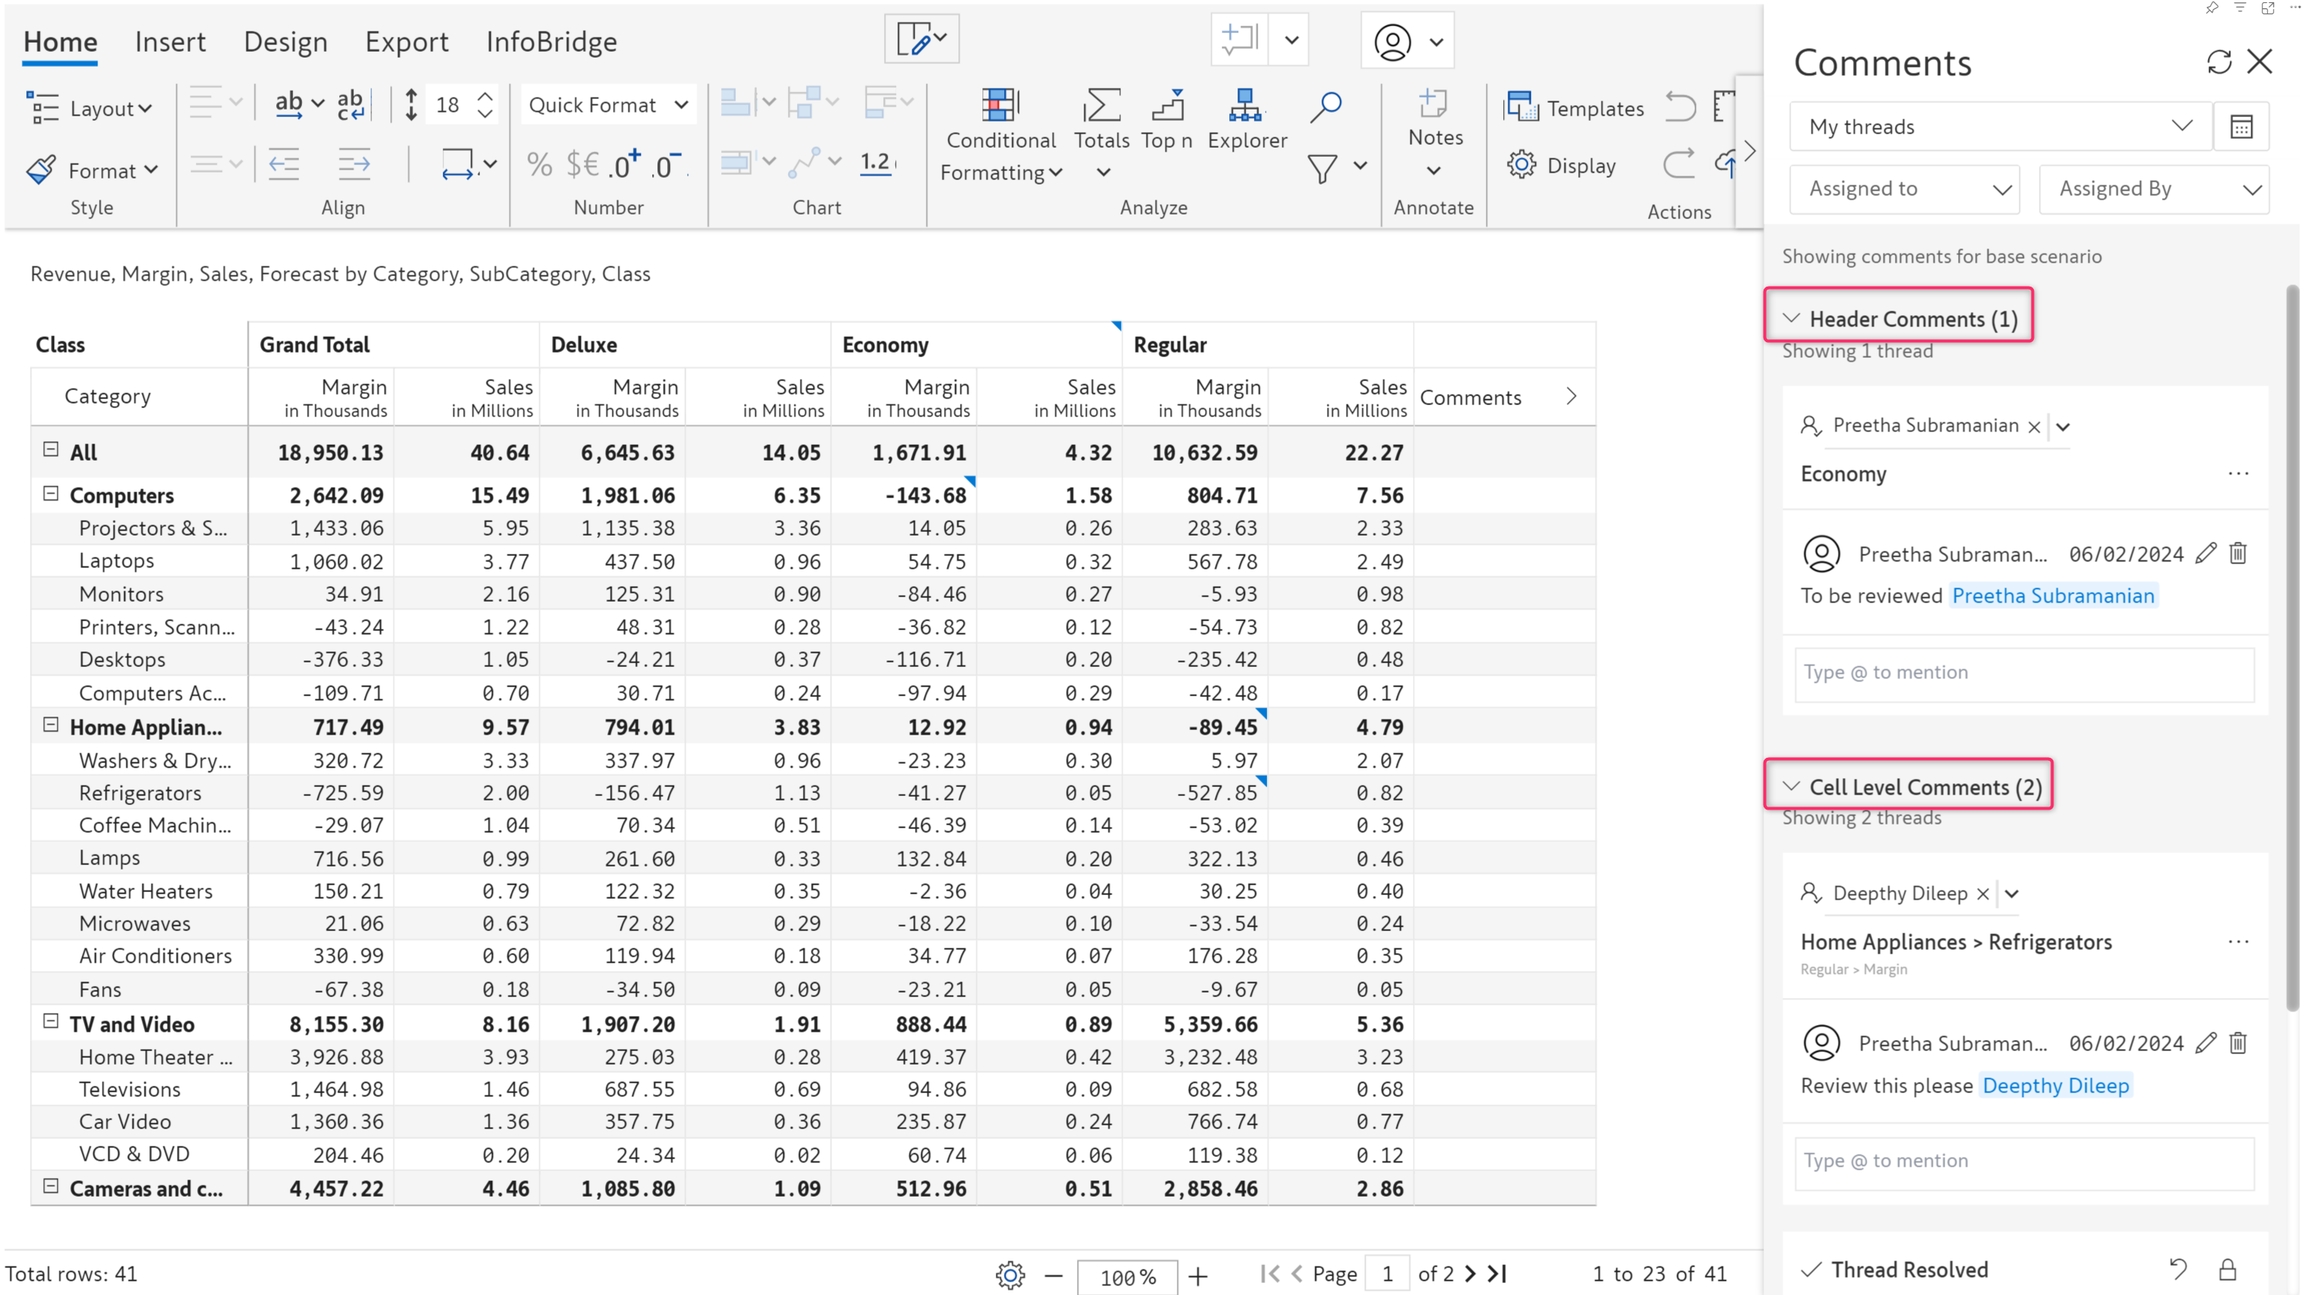
g) Header and cell-level comments are also categorized in the side panel as shown below.

In the next section, we'll cover the .

general settings and comment digest
View all comments
Comments side panel with filters
Filter tasks based on status
Filter by task assignee
Filter by task assignor
Filter by date
Header and cell level comments