
What-if analysis & simulations
Every day business decision-making involves stakeholders asking a lot of ‘what-if’ questions. However, typical business intelligence and reporting tools fail to provide this very capability that decision-makers and analysts need most. As a result, users end up exporting report data to Excel to create their own models for offline analyses.
Premium Table provides two ways to model & simulate outcomes for your ‘what-if’ questions. Let us look at them one by one.
1. Edit a cell directly
This method involves overwriting existing data in your report directly.
To simulate outcomes in Inforiver by editing data, you select a specific cell and start typing in a new value. Just as with Excel, a cell editor shows up just over the value.
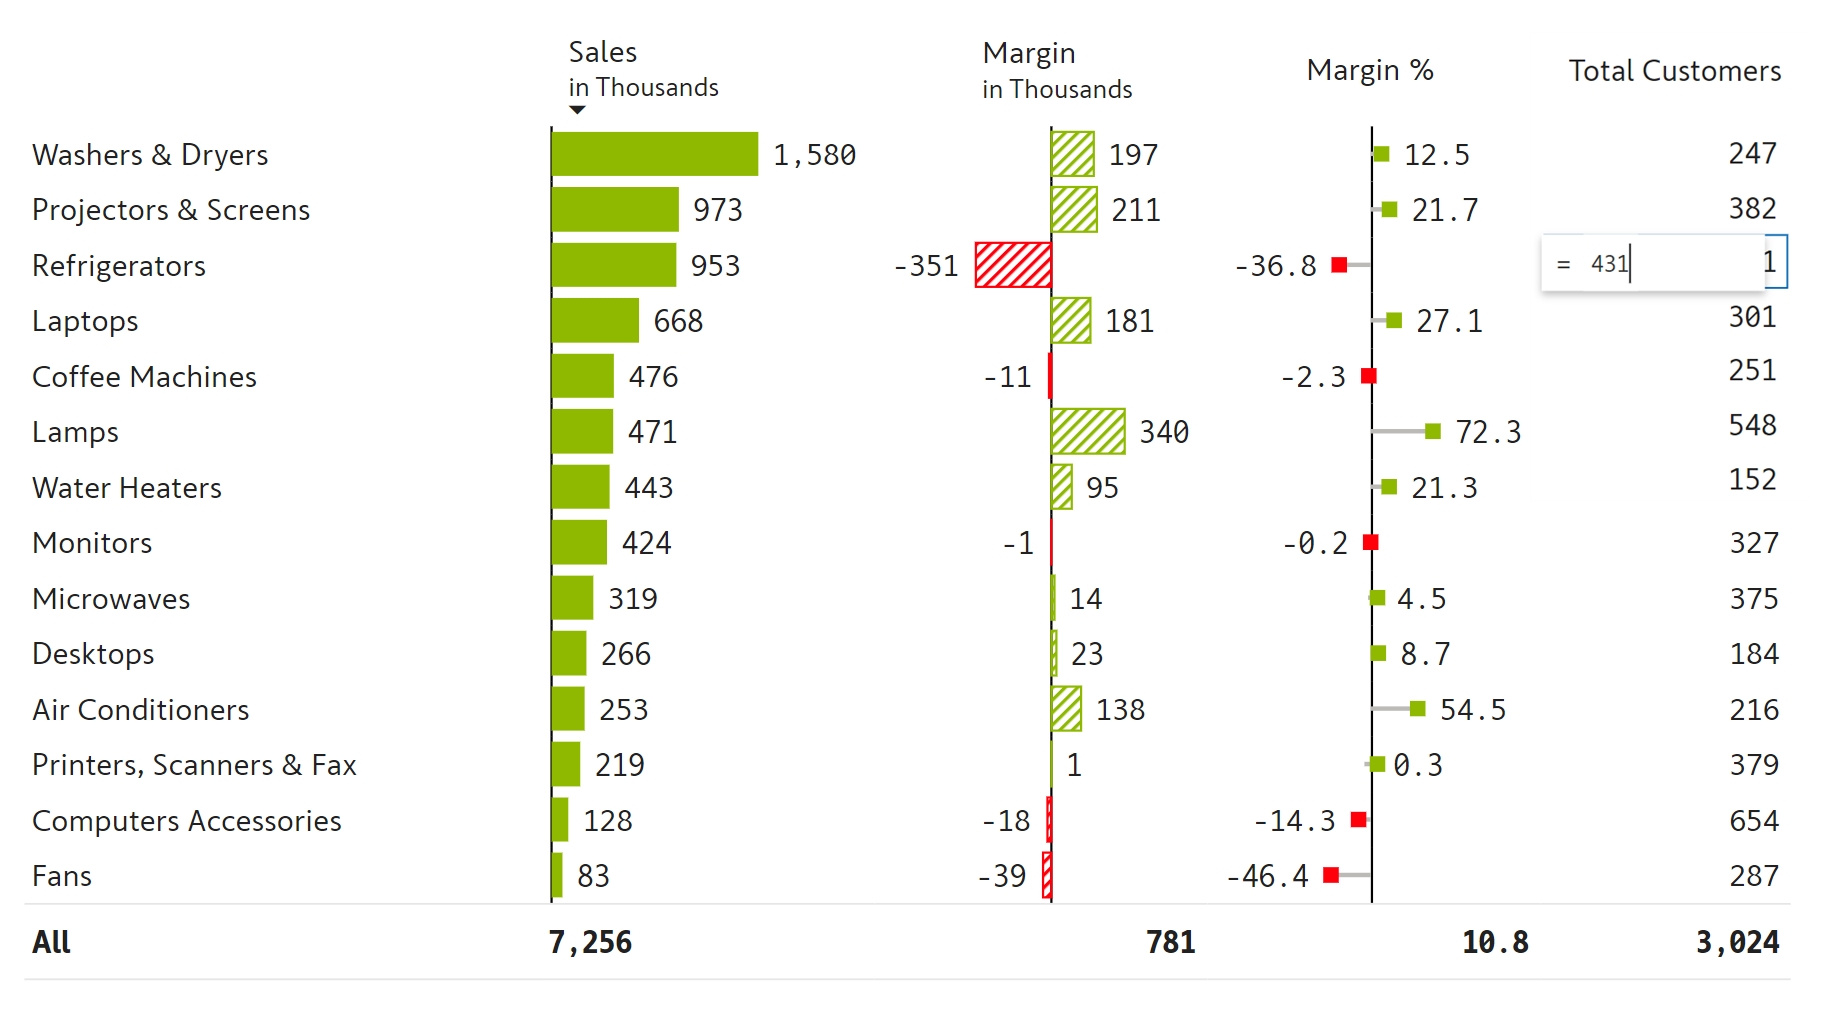
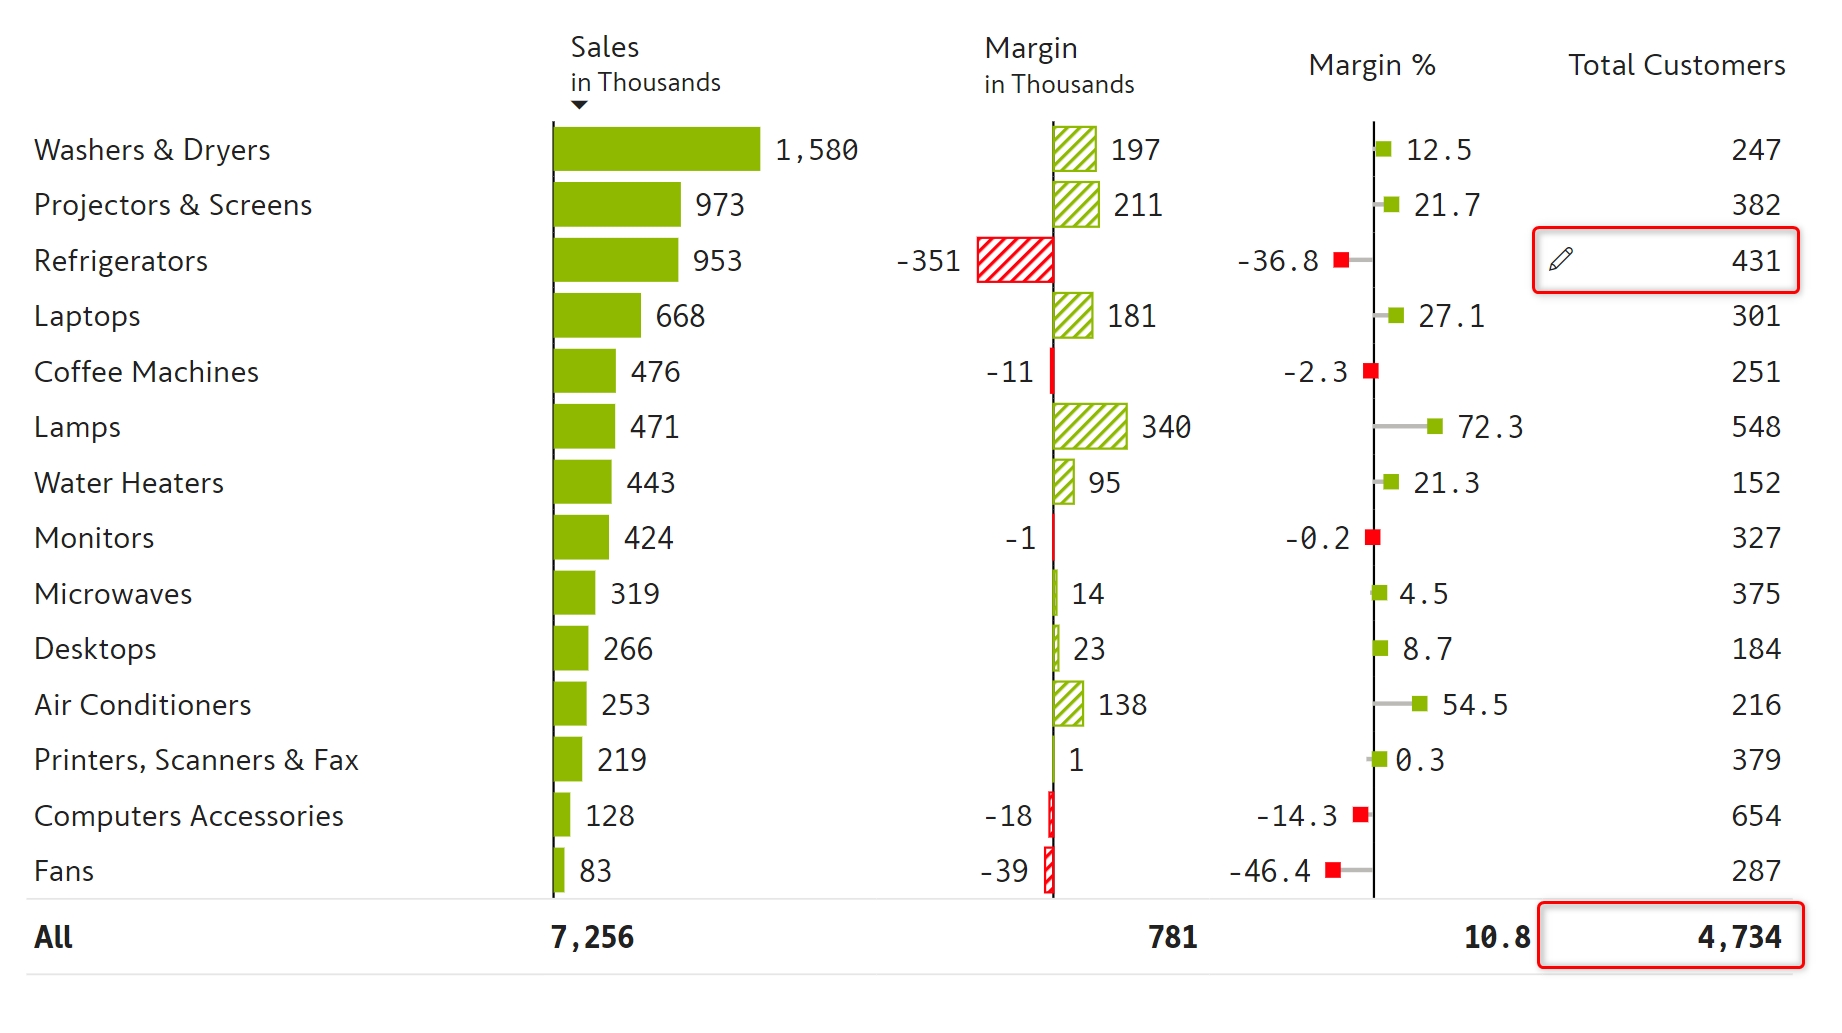
Type in the new value and press Enter to update the value and table totals automatically. There is also an edit icon that appears next to the value, indicating that the cell has been edited.
An alternate method to achieve the same outcome is to double-click a specific cell. This opens a formula bar at the top where you can make similar adjustments.

Premium Table also allows you to use expressions with scaled values (e.g., 11250 + 0.5k) and percentages (e.g., 11250 + 10%). You can use this in both the in-cell editor and the formula bar.
You can update even cells/columns that display charts/graphs using the above method. After the update, the charts or graphs render again based on the updated value.
2. Use a simulation slider
Another method to create projections in Power BI is to use the intuitive simulation capability offered by Premium Table. Compared to the previous method, this approach has the benefit of automatically tracking variances for each record.
STEP 1: Inserting a simulation column
Click the Simulate button in the Insert ribbon.

The side panel provides the following options:
Simulation based on - A measure based on which the simulation series is created. A simulation output field is created based on the selected input field.
Variance formatting style - To define whether an increase is good or bad
Show slider - To enable/disable the slider. If the slider is disabled, simulation can still be performed by cell editing
Value range - By default, each cell can be simulated from -100% to +100% of its value
Simulation value - The simulation percentage can be displayed to the left/right of the actual value.
STEP 2: Using the simulation slider
Once the field has been created, you can click on any cell in this new simulation-enabled field. This will display a small slider icon next to it. Hovering over this icon reveals a slider. Clicking and dragging the slider changes the value in the cell. It also displays a percentage change as you move the slider to the right or left. The value & totals get updated once you release the slider.

In the example above, we have increased the value for the category 'Projectors & Screens' by 9%. The Grand Total row reflects how individual simulations impact the overall target sales.
When the grand total row is simulated, the change is distributed to all the rows.

Multiple cells can be simulated at once. Use Shift/Ctrl + click to select cells and use the slider on any one cell to simulate.

On the simulation slider, you can see three options: lock, edit, and delete. Let's look at them one by one.
a) Edit - A simulation percentage can be defined by clicking on the pencil icon. In the dialog box that opens, type the desired percentage and click Apply.

b) Lock - Specific cells can be locked from simulations. Click the Lock icon.

The cell is greyed out to indicate that it is locked from simulations. Click the lock icon to unlock the cell and open it for simulations.

c) Delete - Simulations can be cleared by clicking the trash icon.

When the simulation slider is disabled, double-click on the cell and edit directly as shown below.

Last updated