# 2. Data Management
Analytics+ comes bundled with advanced data management options, enabling even end users to configure their measures and dimensions on the fly. End users can add measure comparisons or display dimensions as rows/columns or legends.
Inforiver is powered by analytics algorithms that can dynamically render charts/cards and tables. When it comes to charts, the most optimal chart is rendered based on the comparability and scale of your measures, among other factors. For tables, the absolute and relative variance is displayed automatically for comparisons.
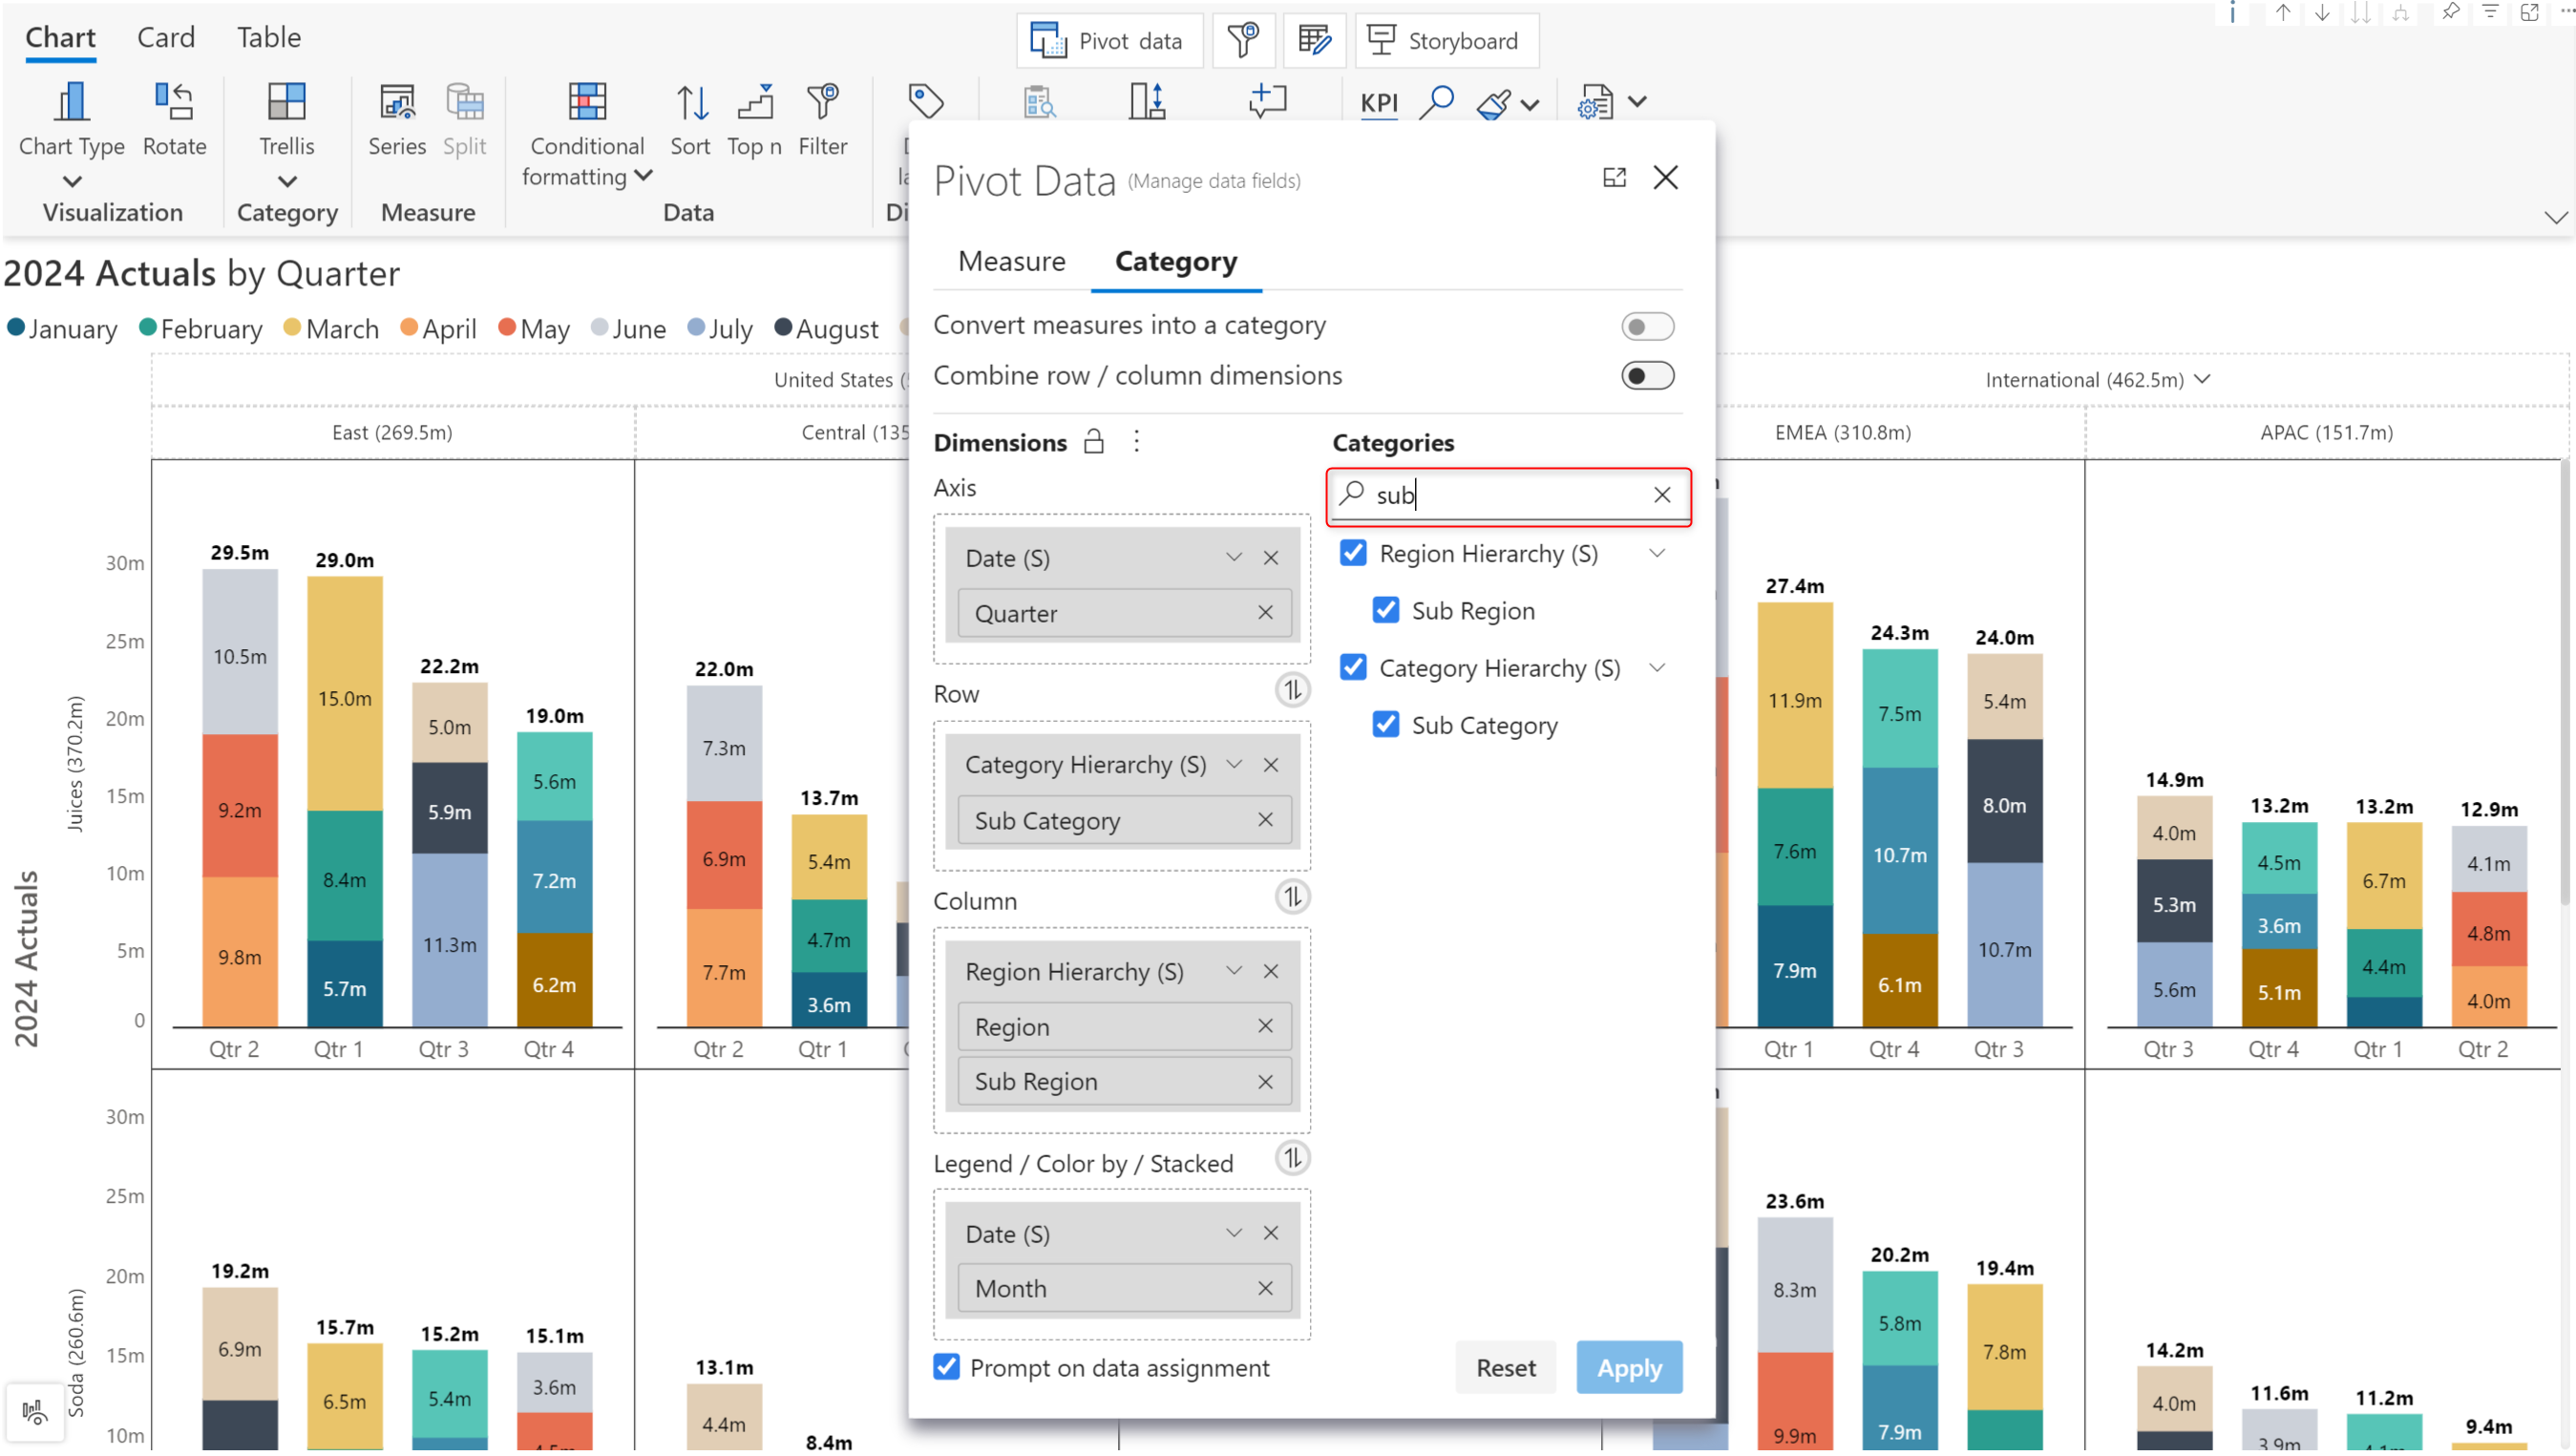
To configure measures and dimensions, open the Pivot Data window.
Data management interface
* To configure measures, click the **Measure** tab.
