Logs

Comprehensive and Searchable Writeback Logs

Inforiver offers milestone-based tracking as soon as the writeback button is clicked. There are multiple ways to view a comprehensive log of an ongoing writeback instance or previous writeback instances:

  • Click on Logs under the Export tab of the Inforiver toolbar.

  • Click View Log in the modal that opens upon completion of writeback.

  • Go to the Writeback Logs tab under the Monitoring section of the Inforiver console.

1. Writeback log filters

The writeback logs page allows us to search through writeback logs using several filter criteria. Let's explore each of these filters.

In the search bar, users could search and filter writeback logs based on their ID, report, or environment.

1.2. Report

You can use the dropdown to select a particular report name.

1.3. Started by

You can use this filter to view logs based on the person who triggered the writeback. Select the person(s) from the list of users.

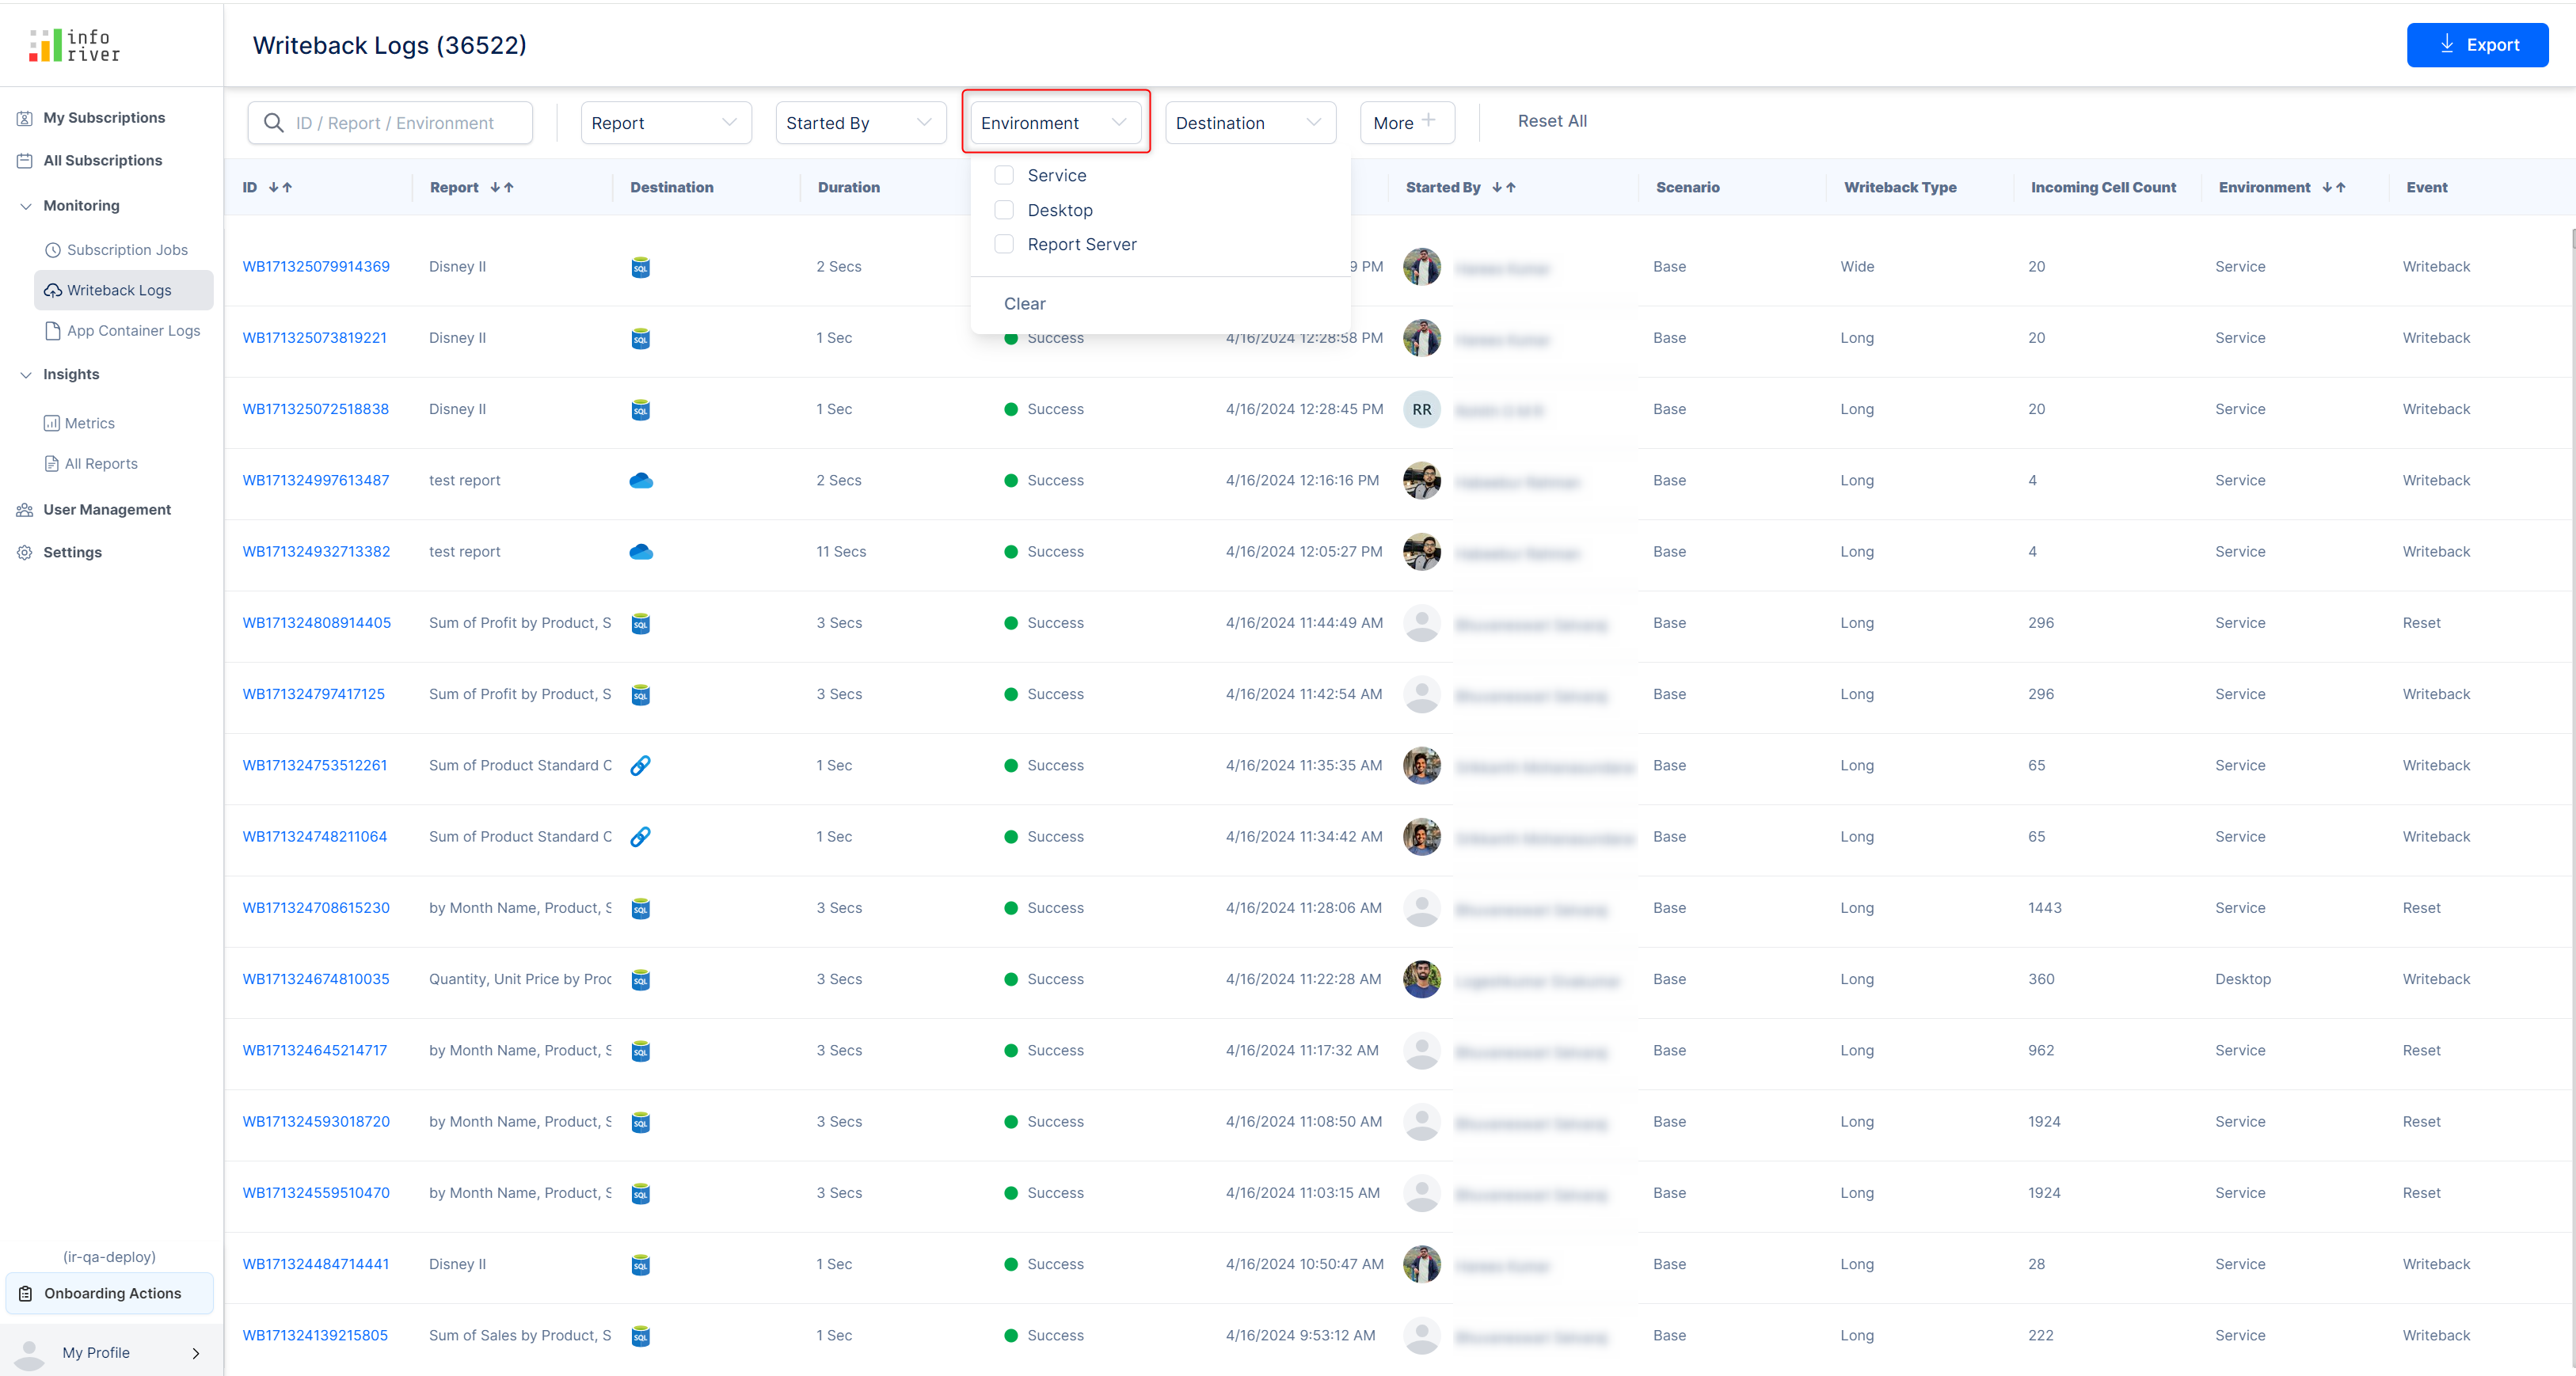
1.4. Environment

Use the drop-down to filter the writeback logs based on the environment from which writeback was triggered.

1.5. Destination

Use the drop-down to filter the writeback logs based on the writeback destination.

1.6. More - Status

Click on More and select Status to enable the dropdown. Use the below drop-down to filter the log based on the writeback status.

1.7. More - Event source

Select the Event source option under the More section - this will enable another dropdown that can be used to filter logs based on the writeback mode i.e. Writeback, Auto Writeback, or Reset.

1.8. More - Create time

Select the Start Time option under the More section - this will enable another dropdown that can be used to filter logs based on the writeback start time.

  • Within the last - If you select this option, you can specify the number of hours, minutes, or seconds. The logs will be fetched if the writeback start time falls within this period.

  • Last 7 days - Selecting this option will filter the logs within the last 7 days

  • Last 30 days - This option will filter the logs that were created in the last 30 days.

  • Between - If you select this option, then you can specify the starting and ending date within which you can filter your writeback logs.

1.9. Reset all

Clicking on this link will reset all the applied filters.

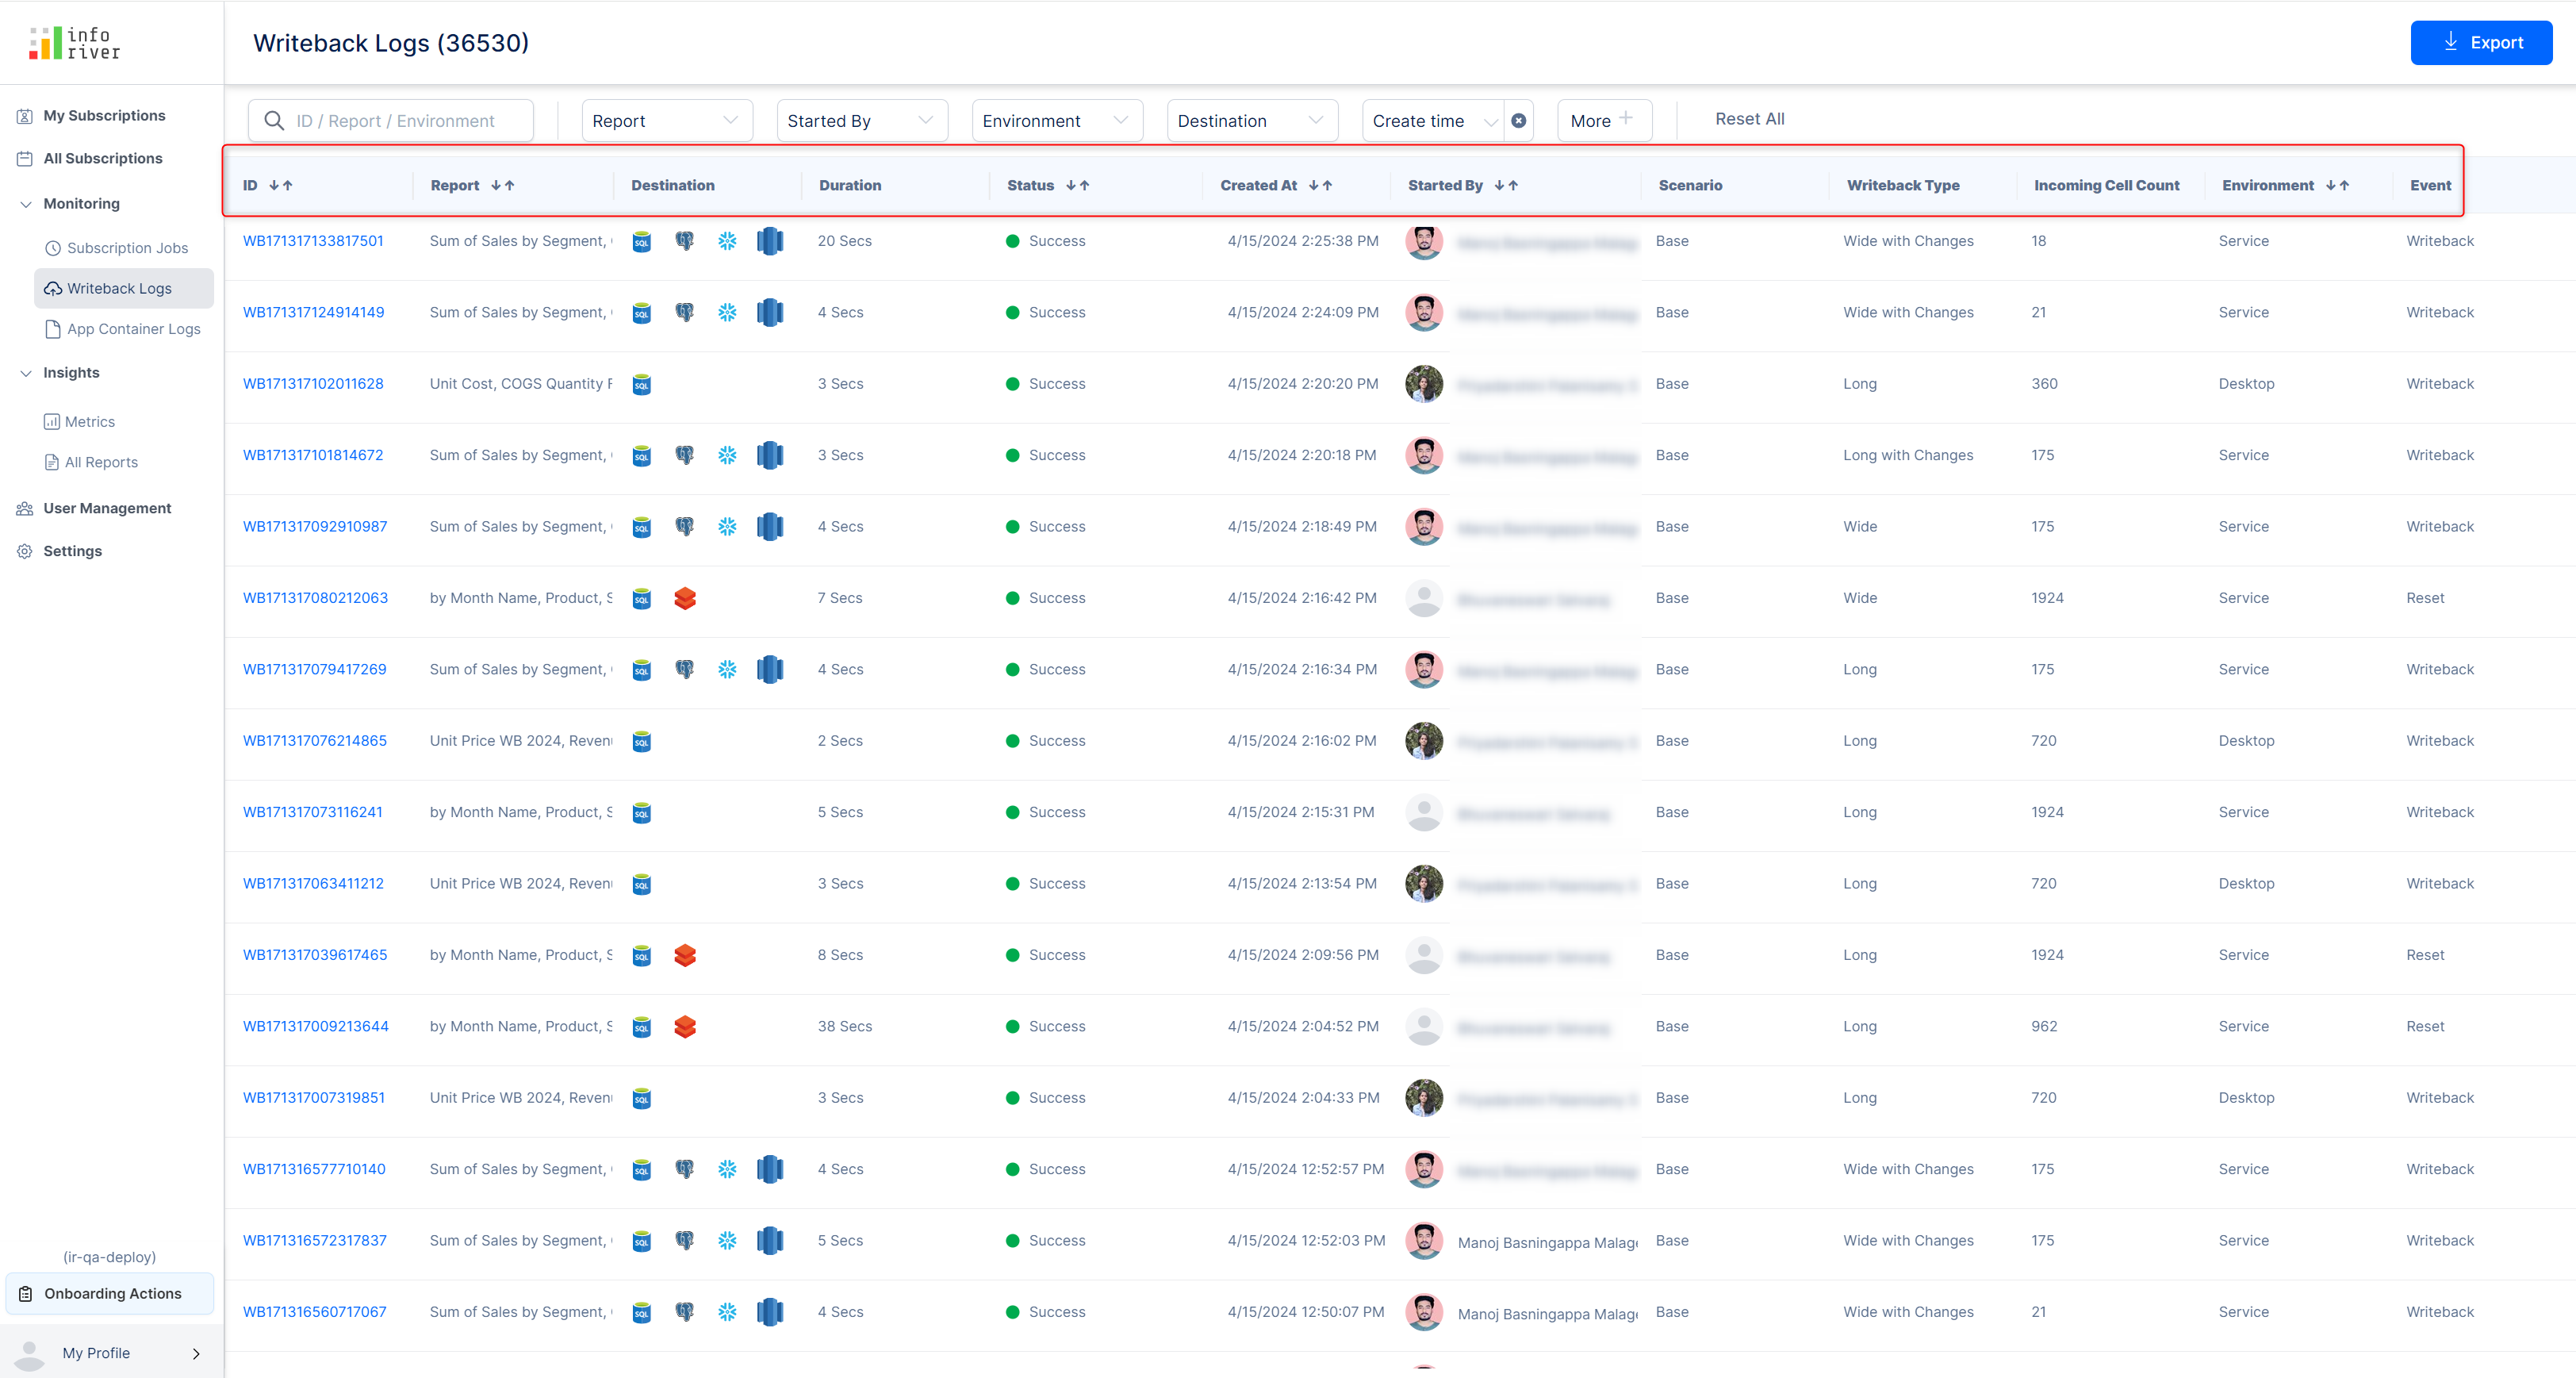
2. Writeback log columns

In this section, let's explore the columns in the writeback logs portal.

2.1. ID

This column displays a unique log ID that is used to identify the writeback log. You can sort the ID in ascending or descending order using the up/down arrows respectively.

Clicking on the writeback ID will open up a page with a detailed summary of the writeback.

Clicking the 'General' tab will display a summary of the writeback along with the milestones and their status.

The writeback log summarizes the following milestones:

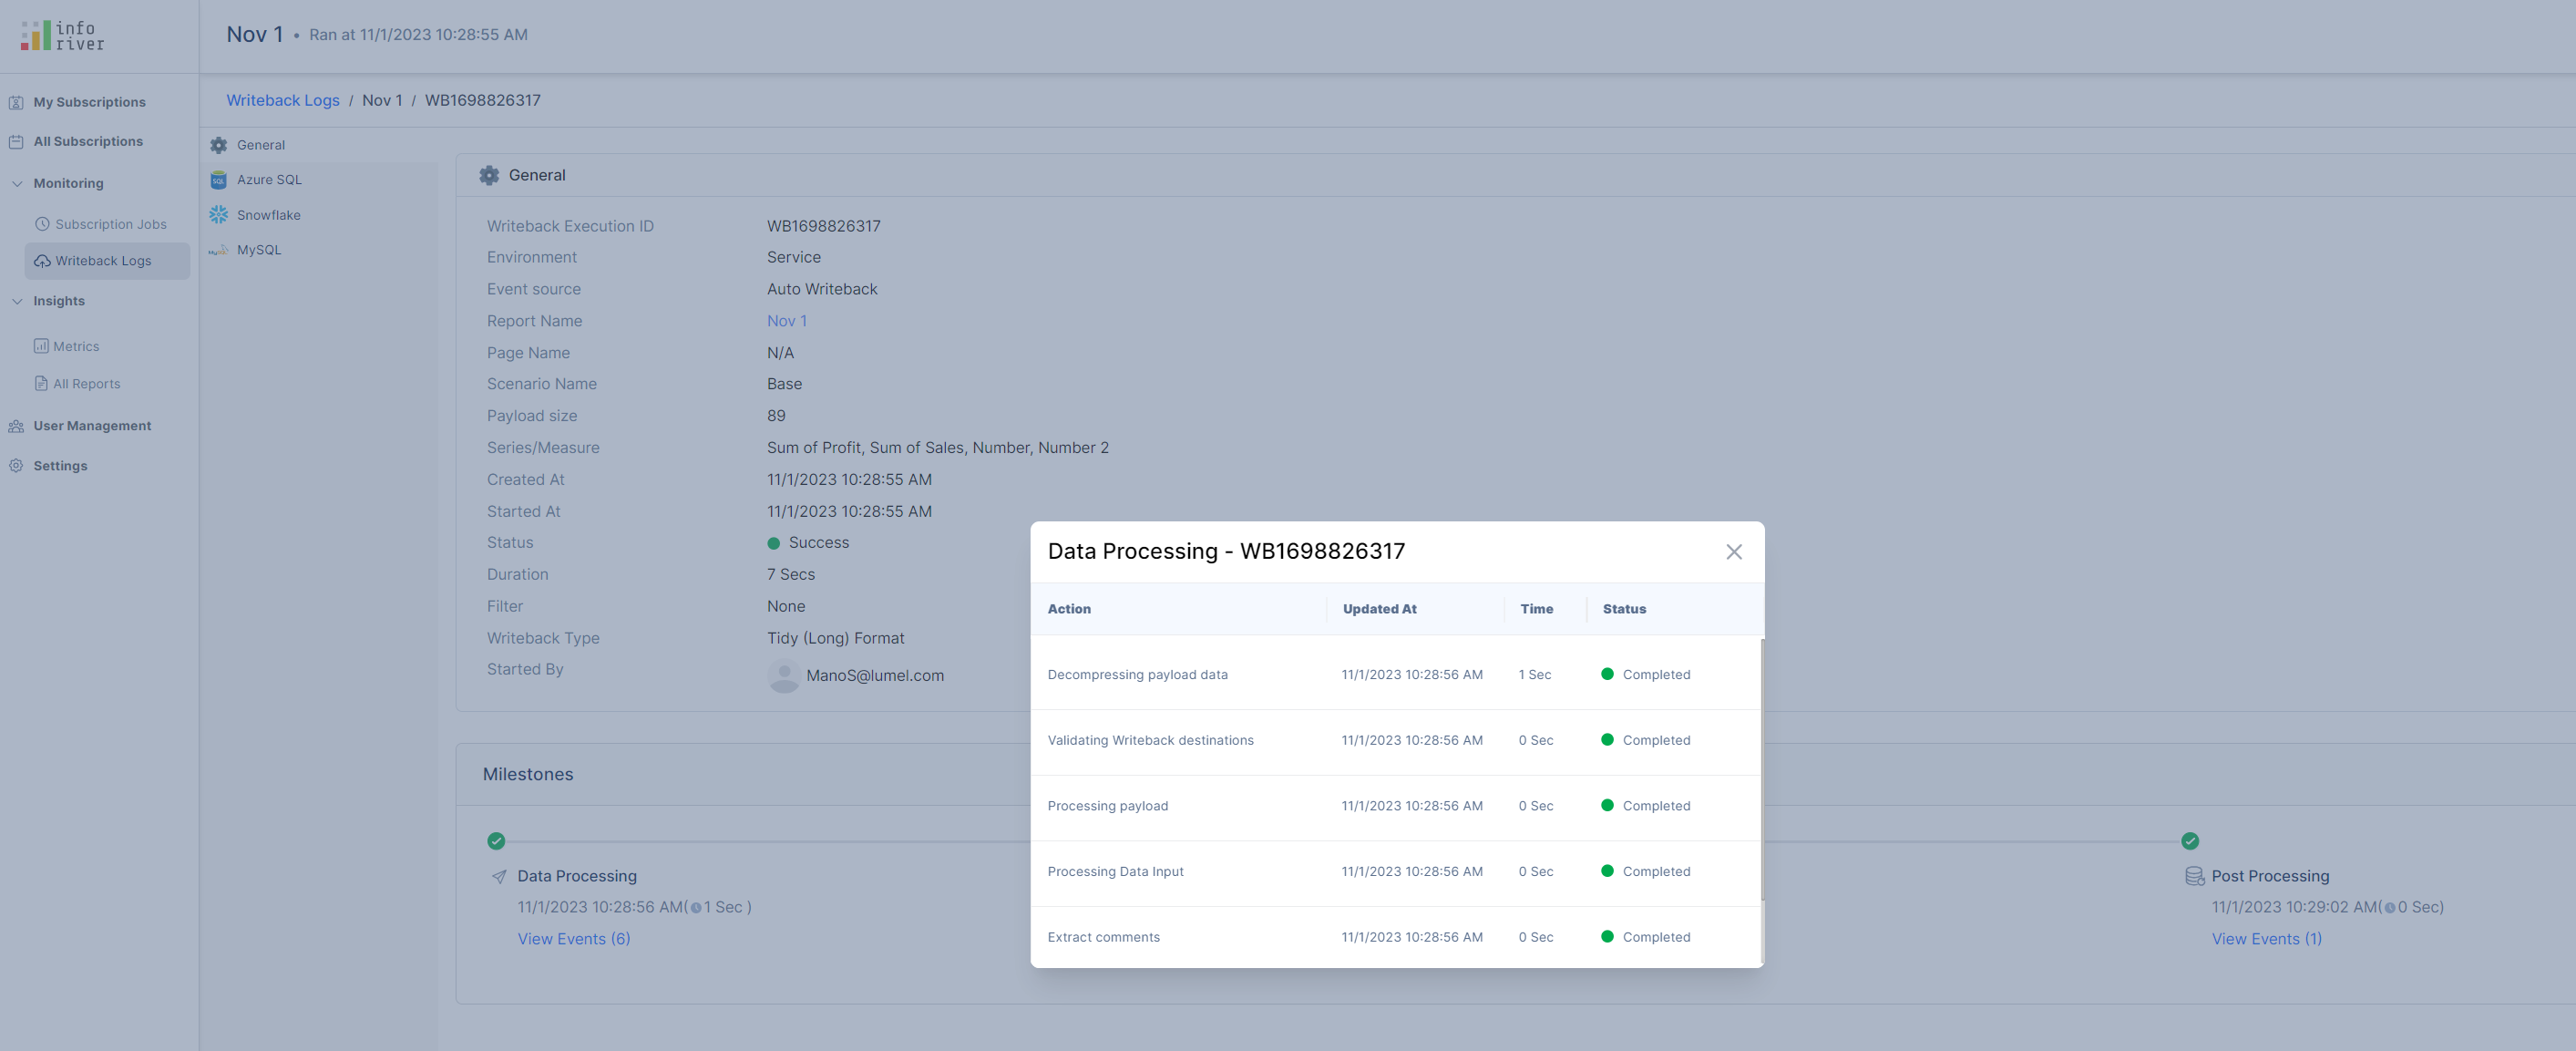
i) Data processing

This indicates the events and steps that occurred during data processing. Click on the 'View events' link to view the data processing events in detail.

The data processing event, logs the performed action, the date and time the event was last updated, and the status of the event.

ii) Deliver to destination

This milestone displays the events logged while the writeback data was delivered to the destination. You can click on the 'View destination events' link to view the summary of the writeback destination, the date and the time at which the destination was updated, and the status of the writeback.

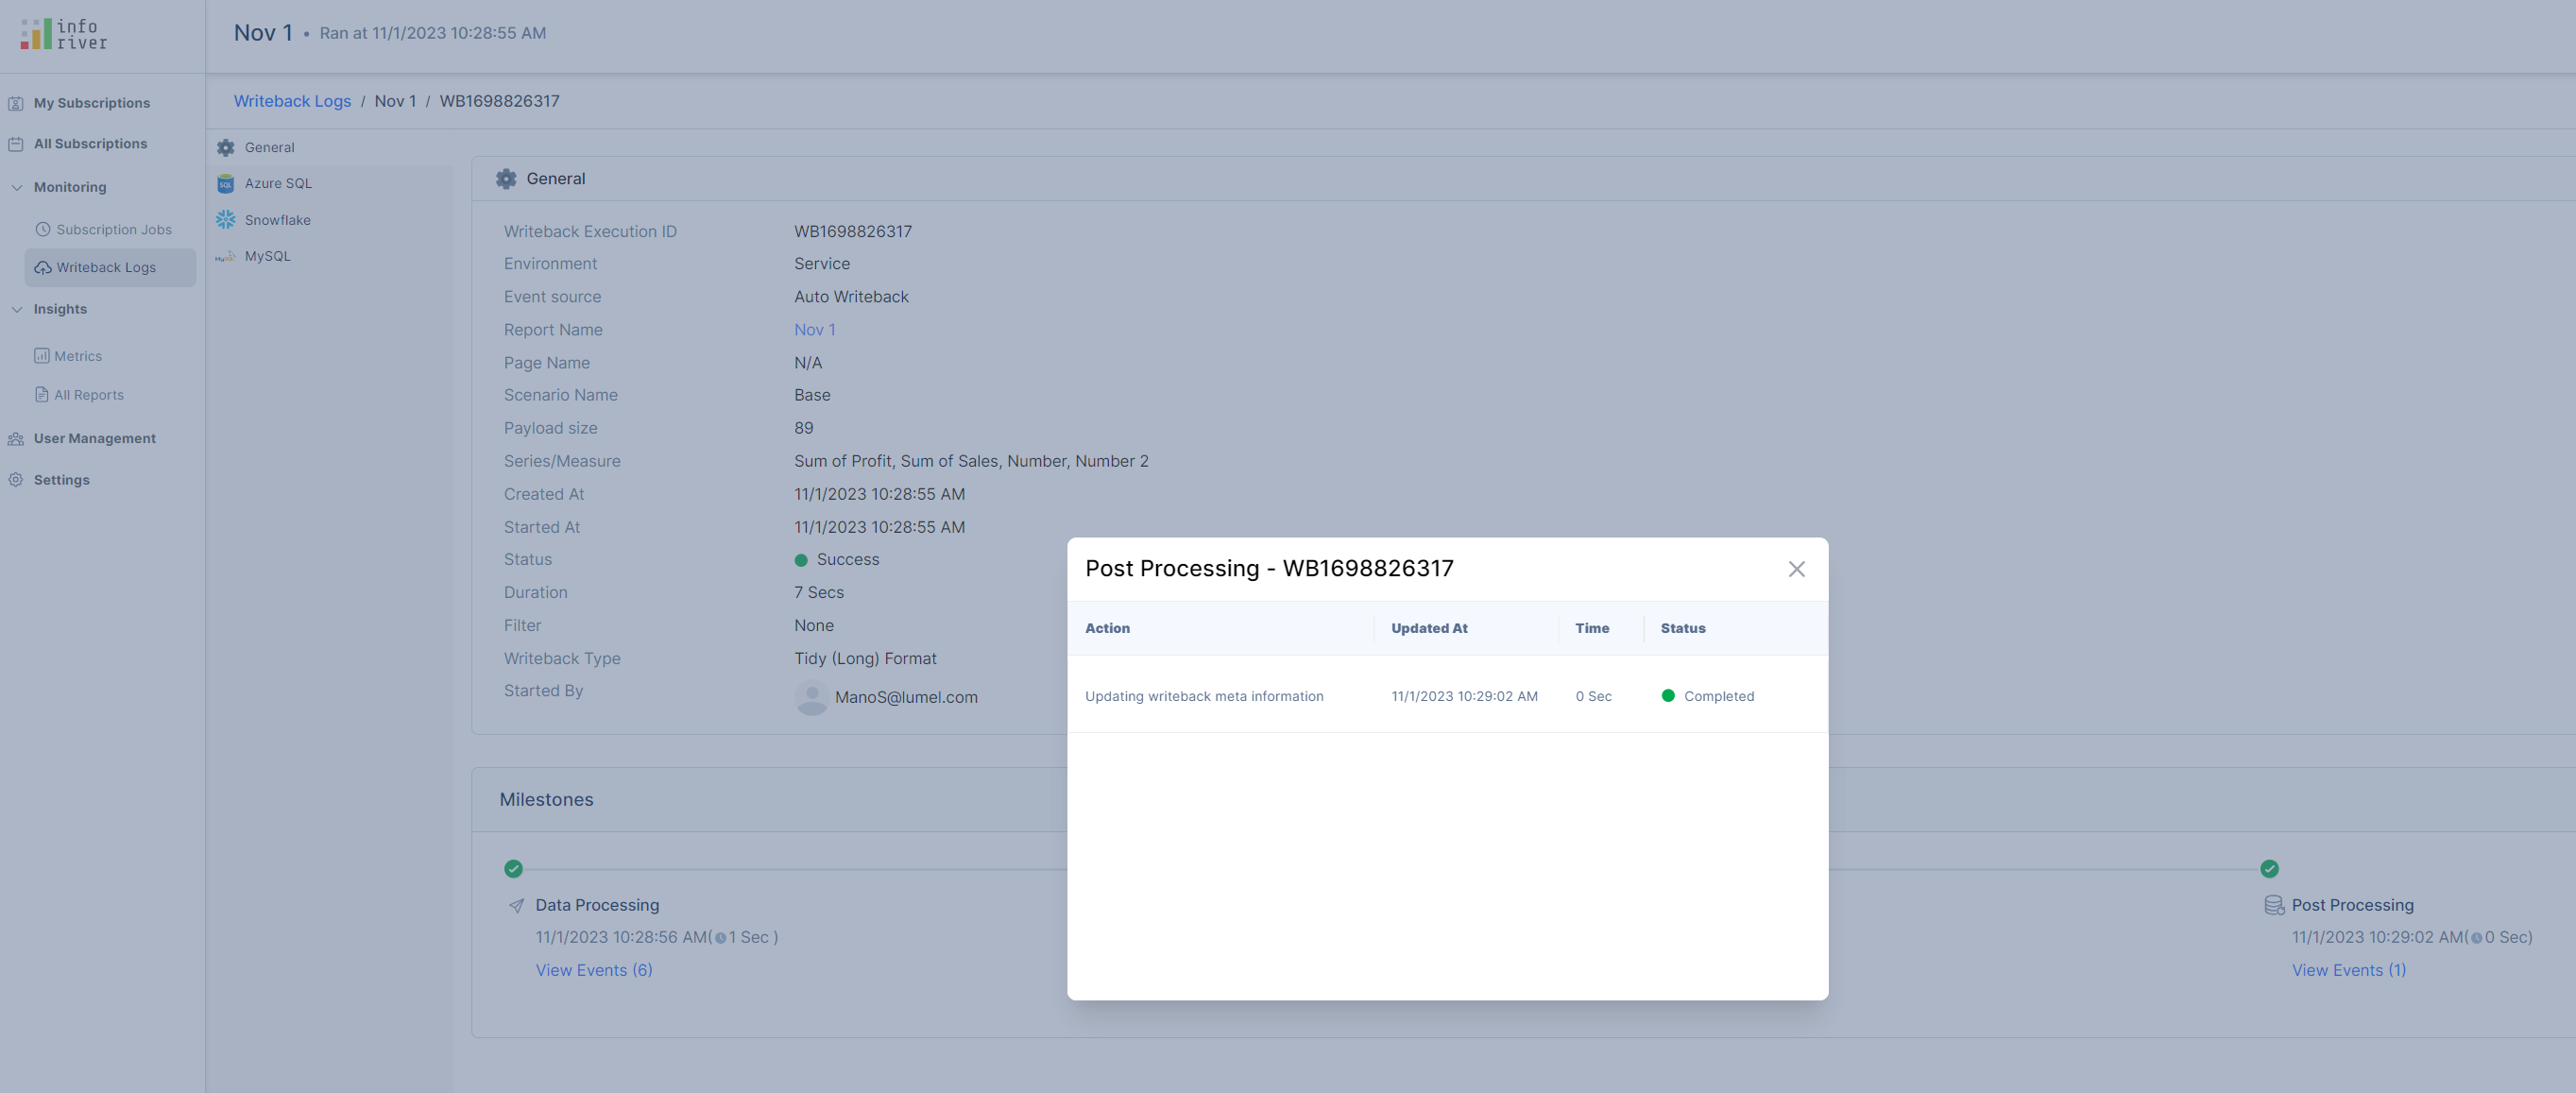
iii) Post processing

The post processing milestone indicates the events that occurred after processing the writeback. You can click on the 'View events' link to view the post processing action, the date and time the action was updated, and the status of the action/event.

Clicking on the name of the destination will display the connection details about the configured writeback destination.

2.2. Report

This specifies the report the writeback belongs to. You can sort the reports alphabetically in ascending or descending order using the up/down arrows respectively.

2.3. Destination

Destination(s) the data was written back to.

2.4.Duration

The total duration of the writeback.

2.5. Status

Shows whether the writeback succeeded or failed. You can sort the status alphabetically in ascending or descending order using the up/down arrows respectively.

2.6. Created at

The data and time at which the writeback was started. You can sort the created date in ascending or descending order using the up/down arrows respectively.

2.7. Started by

Name of the user who started the writeback. You can sort the user name in ascending or descending order using the up/down arrows respectively.

2.8. Scenario

Lists any scenarios that were written back. If there are no scenarios for writeback, the console will display 'Base'.

2.9. Writeback type

Specifies whether the writeback was in Long, Wide, Long with Changes, or Wide with Changes format.

2.10. Incoming cell count

Specifies the number of cells in your report that were written back.

2.11. Environment

The environment of the writeback. You can sort the environments in ascending or descending order using the up/down arrows respectively.

2.12. Event

Use this field to identify whether the log is for a regular writeback, auto writeback, or a reset operation.

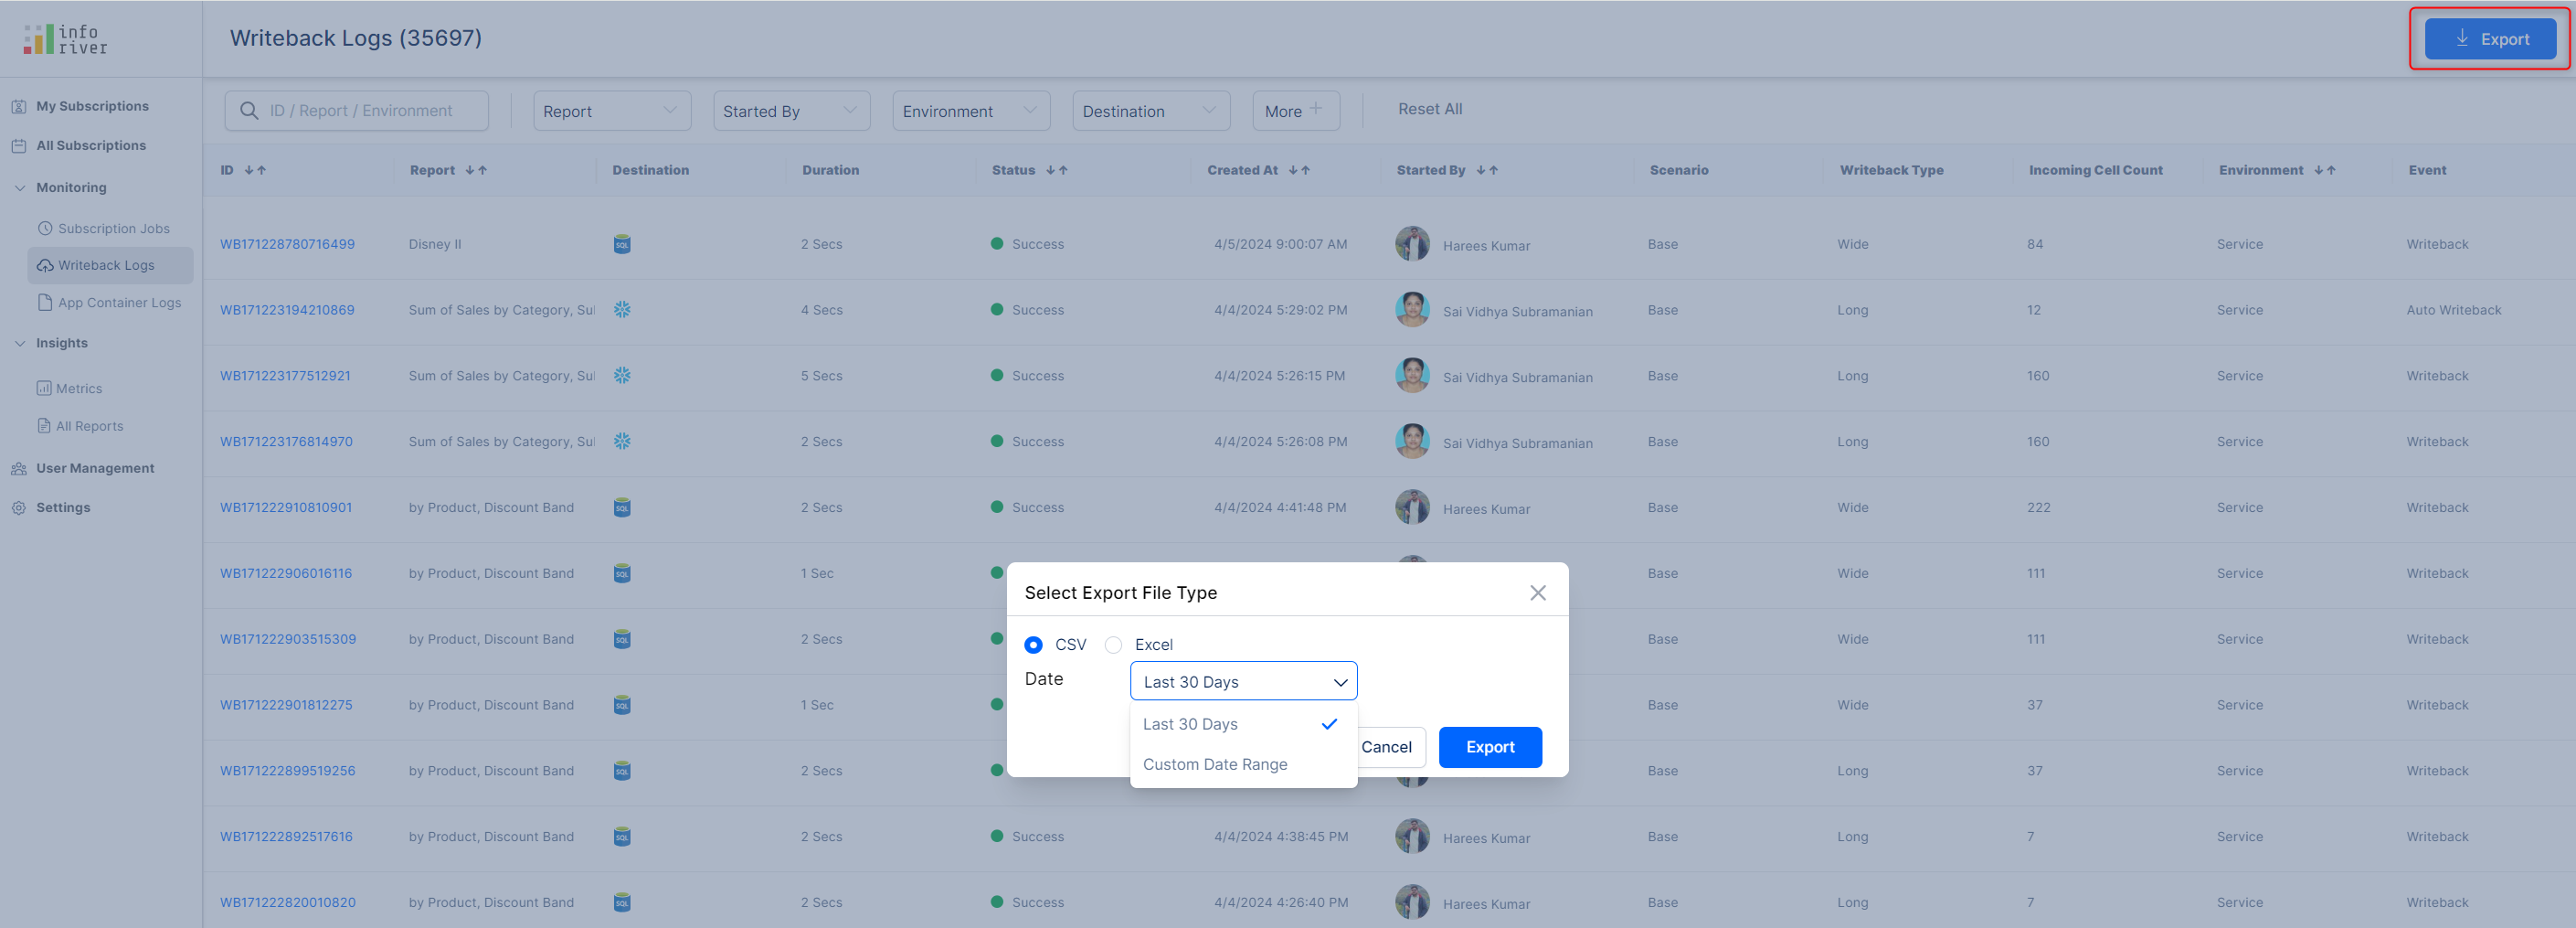
3. Exporting logs

You can easily export the logs for a specified period by following the steps outlined below.

Step 1: Click on the export button at the top right corner to open the export dialog box.

  • Choose the format: CSV or Excel

  • Choose the period range: the default range is 30 days or you can set a custom range

If you choose a custom range, you can select the start and end dates from the calendar widget.

Step 2: Click Export. The status of the export will be displayed in the top right corner. After the export is complete, you can click the Download link to save the file to your system.

Step 3: Open the file to analyze the logs. You can quickly root cause and debug writeback failures with the Failure Reason column in the writeback log export.

Last updated